Nothing ruins a PowerPoint presentation like a wall of text—especially when a simple visual would suffice. Whether you’re mapping out a critical decision or describing a complex process, a well-made flowchart can add polish and clarity to any slideshow. Use this guide to learn how to make flowcharts in both PowerPoint and Lucidchart.
7 minute read
Want to create a flowchart of your own? Try Lucidchart. It's fast, easy, and totally free.
How to create a flowchart in Microsoft PowerPoint
For many students, teachers, and professionals, MS PowerPoint is the go-to presentation software—and with good reason. When it comes to creating flowcharts, however, PowerPoint is extremely limited; it simply wasn’t designed for that. Lucidchart allows you to create beautiful, complex diagrams easily and quickly. Skip to the next section to see for yourself.
There are two ways to build flowcharts using only PowerPoint: with SmartArt or with the shapes library. This tutorial will cover both methods, touching on some of the pros and cons of each approach.
Create a flowchart with SmartArt
SmartArt graphics are pre-made collections of shapes—very basic, rigid diagram templates, essentially. Using SmartArt to build charts and diagrams can be faster than starting from scratch, but you’ll sacrifice flexibility. SmartArt is a great option if you want a quick, simple diagram. It should, however, only be used for the most rudimentary diagrams. SmartArt graphics are clip art images—additional elements can be added, but your options are limited to one or two preselected shapes.
If you choose to use SmartArt to build your diagram, follow these steps:
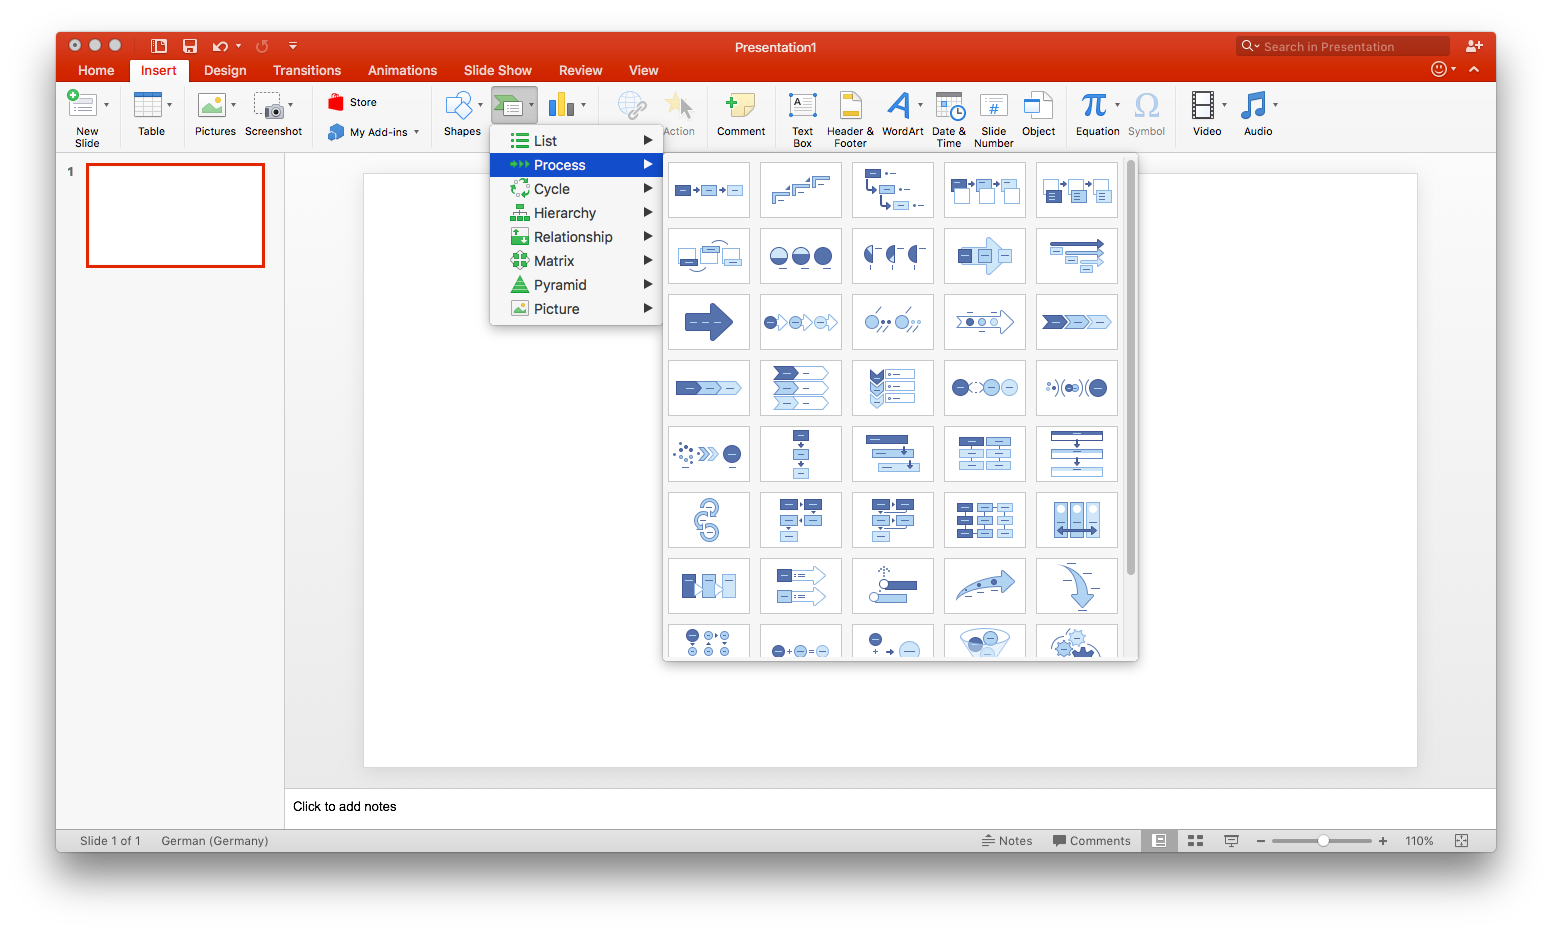
1. Select a flowchart from the SmartArt drop-down menu
In MS PowerPoint, navigate to the slide where you want to add a flowchart. Click Insert > SmartArt to open a drop-down list with a variety of diagram types. Hover your mouse over “Process” to see the various flowchart options. To insert one of these diagrams, simply click it.
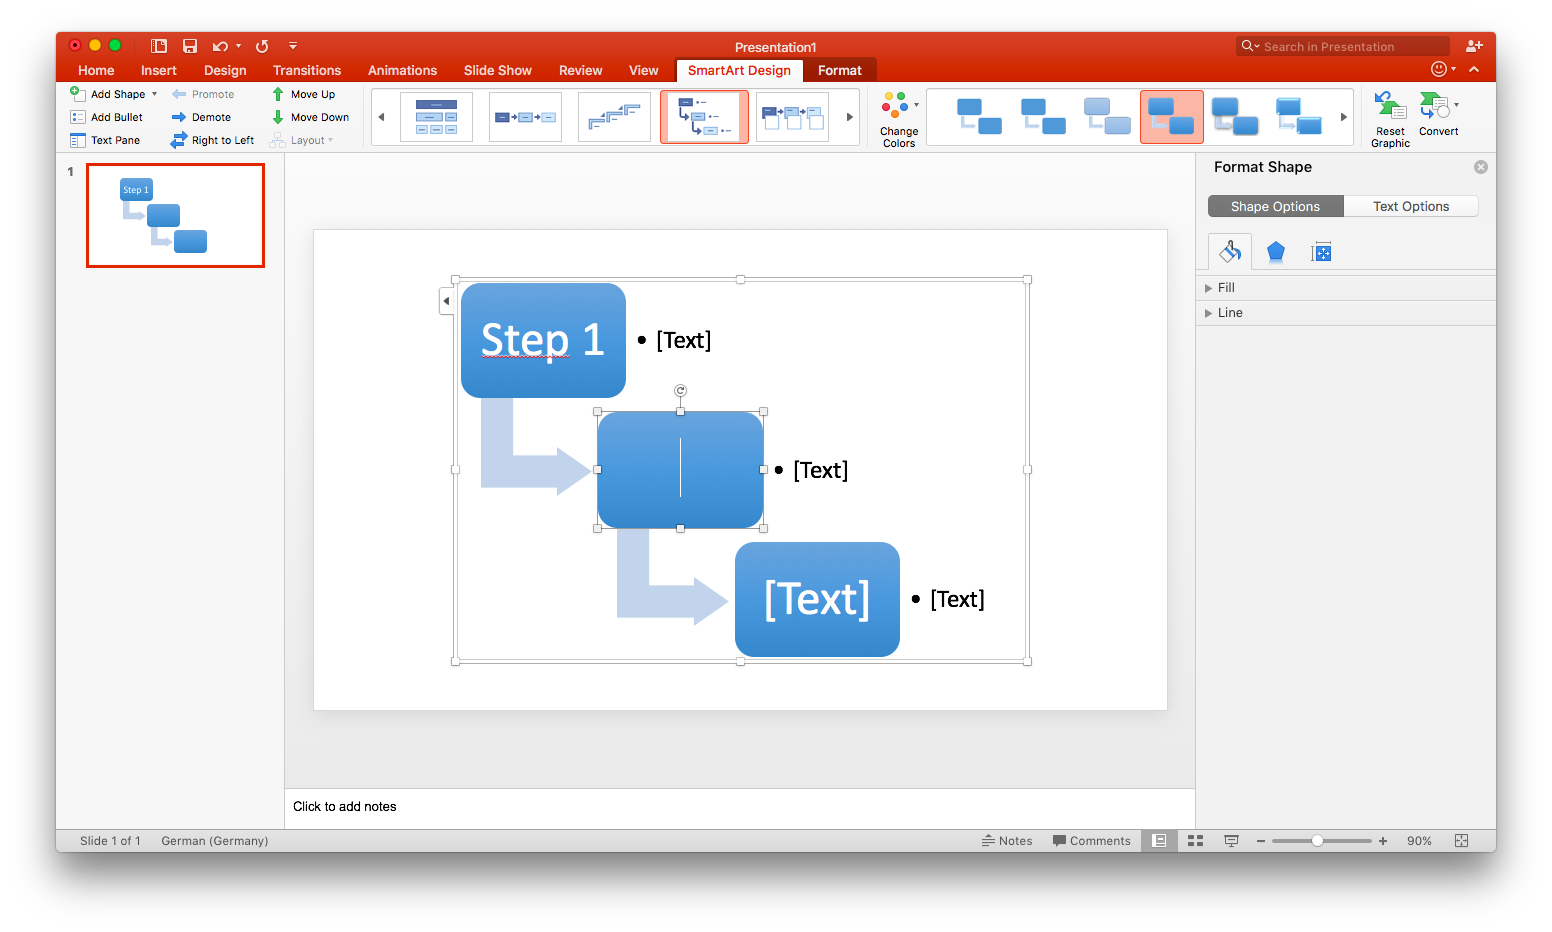
2. Add text and shapes to your flowchart
Text can be added to the shapes in your SmartArt graphic by clicking the center of the shape.
To add shapes, select the whole SmartArt graphic and click “Add Shape.” (This button is located in the toolbar’s upper left corner.) If you move shapes around—to do this, click and drag—the connecting arrows will automatically adjust.
3. Customize your flowchart
When you select your SmartArt graphic, two tabs appear on the toolbar: “SmartArt Design” and “Format.” By clicking on the former, you can change the diagram type, choose from a number of preset color schemes, and add shapes. The format tab, on the other hand, allows for more specific customizations, including individual shape color, text color, and font.
Create a flowchart with the PowerPoint shape library
Using the shape library to create a flowchart is substantially slower than using SmartArt because every box and arrow must be added individually. However, this method affords much more flexibility throughout the creation process. Additionally, if you’re looking for a traditional flowchart—one with process and decision boxes, and other flowchart-specific shapes—you’ll have to use the shape library, as SmartArt doesn’t offer any diagrams with these features.
1. Add the necessary shapes
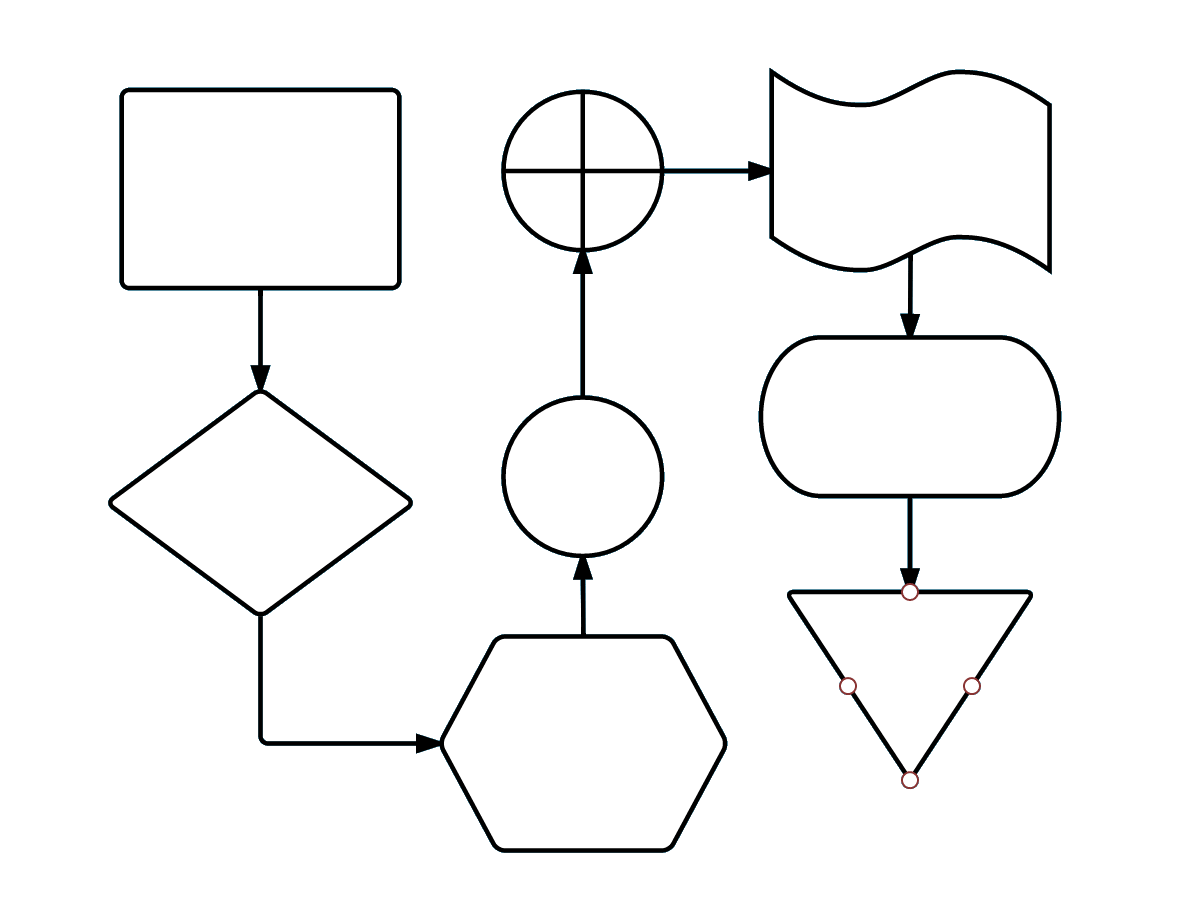
Go to Insert > Shapes. Doing this opens a dropdown menu of PowerPoint’s shape libraries—scroll down until you find the flowchart section. There you’ll find all the necessary shapes for creating a flowchart, from decision boxes to manual input boxes. To see any shape’s function, just hover your mouse over it and a small label will appear.
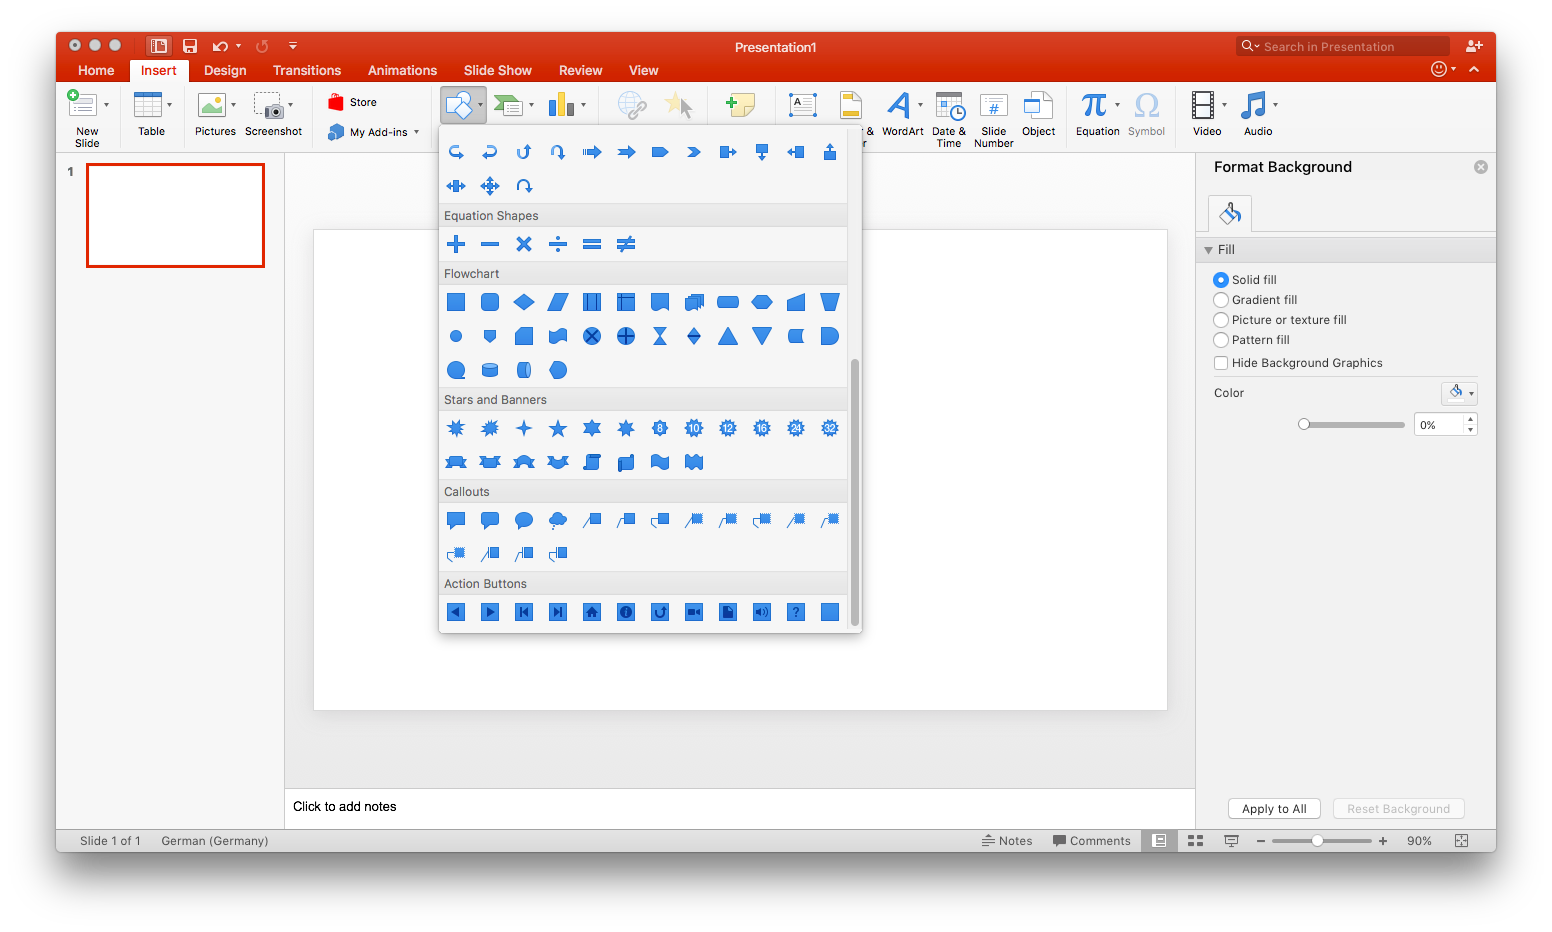
Once you’ve selected a shape, click and drag your mouse to draw it on the slide. To add more shapes, simply repeat this step from the beginning. (Tip: For shapes that will occur multiple times in your flowchart—such as process boxes—add one and then copy and paste it as required.)
2. Add connecting lines
A key feature of any flowchart is connecting arrows—after all, it’s these arrows that illustrate the diagram’s “flow” or relationship(s) to the other shapes in your diagram. As with the previous step, to add lines, go to Insert > Shapes. The arrows can be found in the lines section.
After selecting a line type, click and drag your mouse from one shape to another to draw a connecting line.
3. Label your shapes and lines
To add text to an existing shape, simply select the shape and begin typing. If you want to label any connecting lines, you’ll have to use text boxes. Go to Insert > Text Box and then click and drag your mouse to draw the text box; type to add text.
4. Customize your flowchart
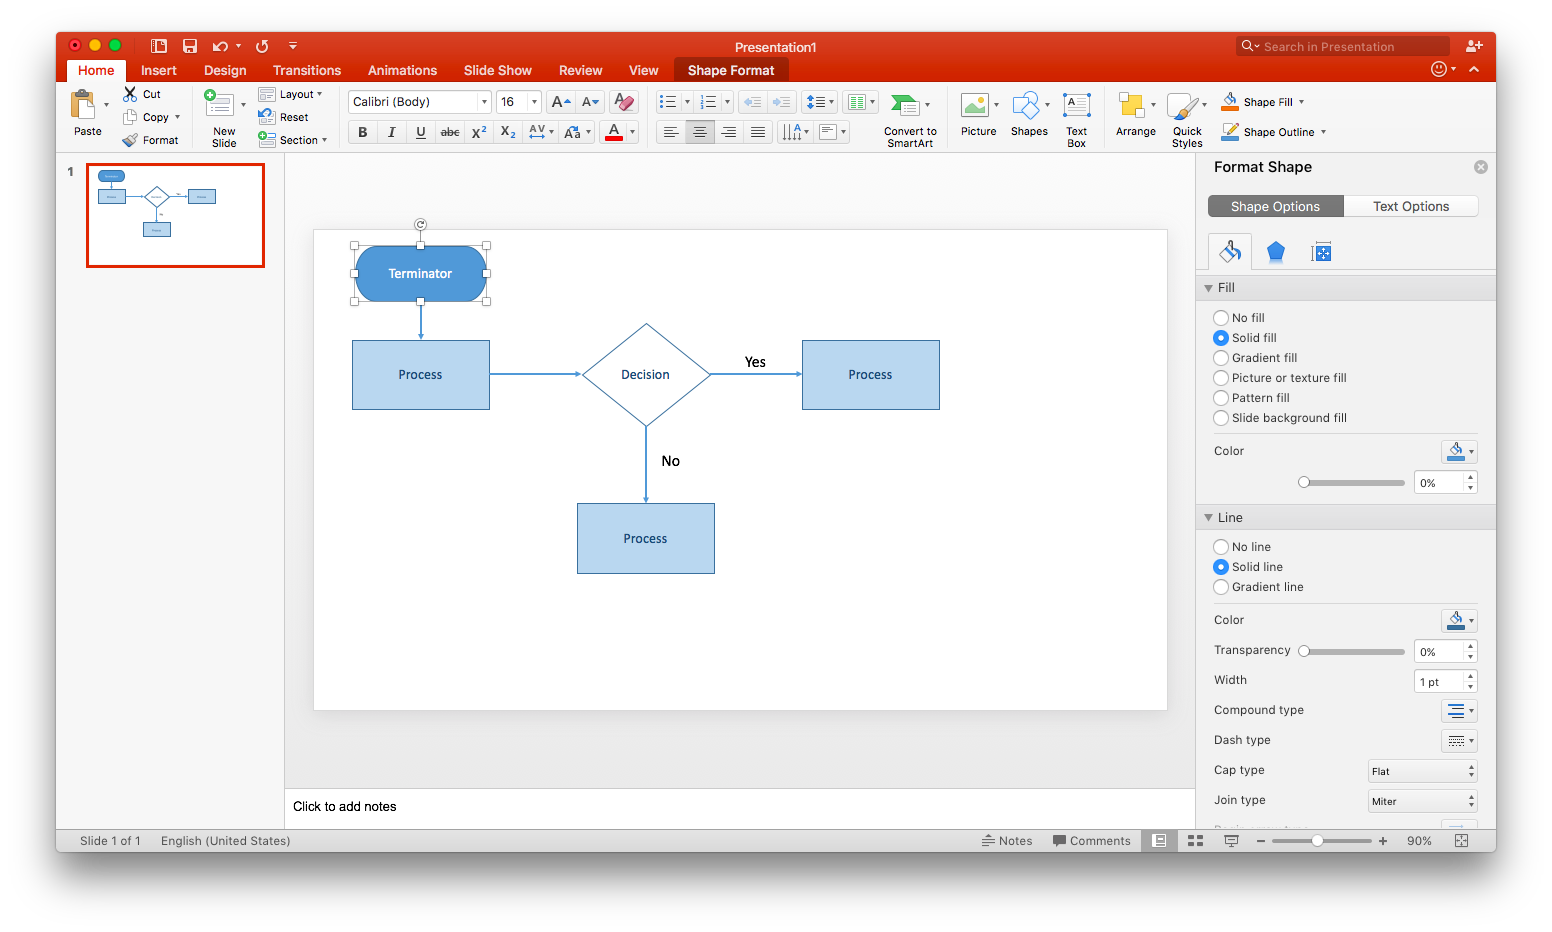
At this point, every shape and line you’ve drawn is styled according to MS PowerPoint’s presets. If you like the look of your flowchart as is, skip this step.
Nearly every aspect of the shapes in your diagram can be modified in the format shape pane, accessible by double-clicking any shape or line. You can then edit fill color, line weight, opacity, and many other elements of your diagram.
Want to create a flowchart of your own? Try Lucidchart. It's fast, easy, and totally free.
Create a flowchartHow to create a flowchart using Lucidchart
While it’s possible to make a flowchart using only PowerPoint (as outlined above), using Lucidchart is a more efficient and intuitive solution. And thanks to Lucidchart’s PowerPoint integration, you can bring your Lucidchart diagrams directly into your presentations!
Before getting started on your flowchart, you’ll need to register for a free Lucidchart account—all it takes is an email address! Once registered, you’ll be all set to move on to the steps below.
1. Choose a template or start from scratch
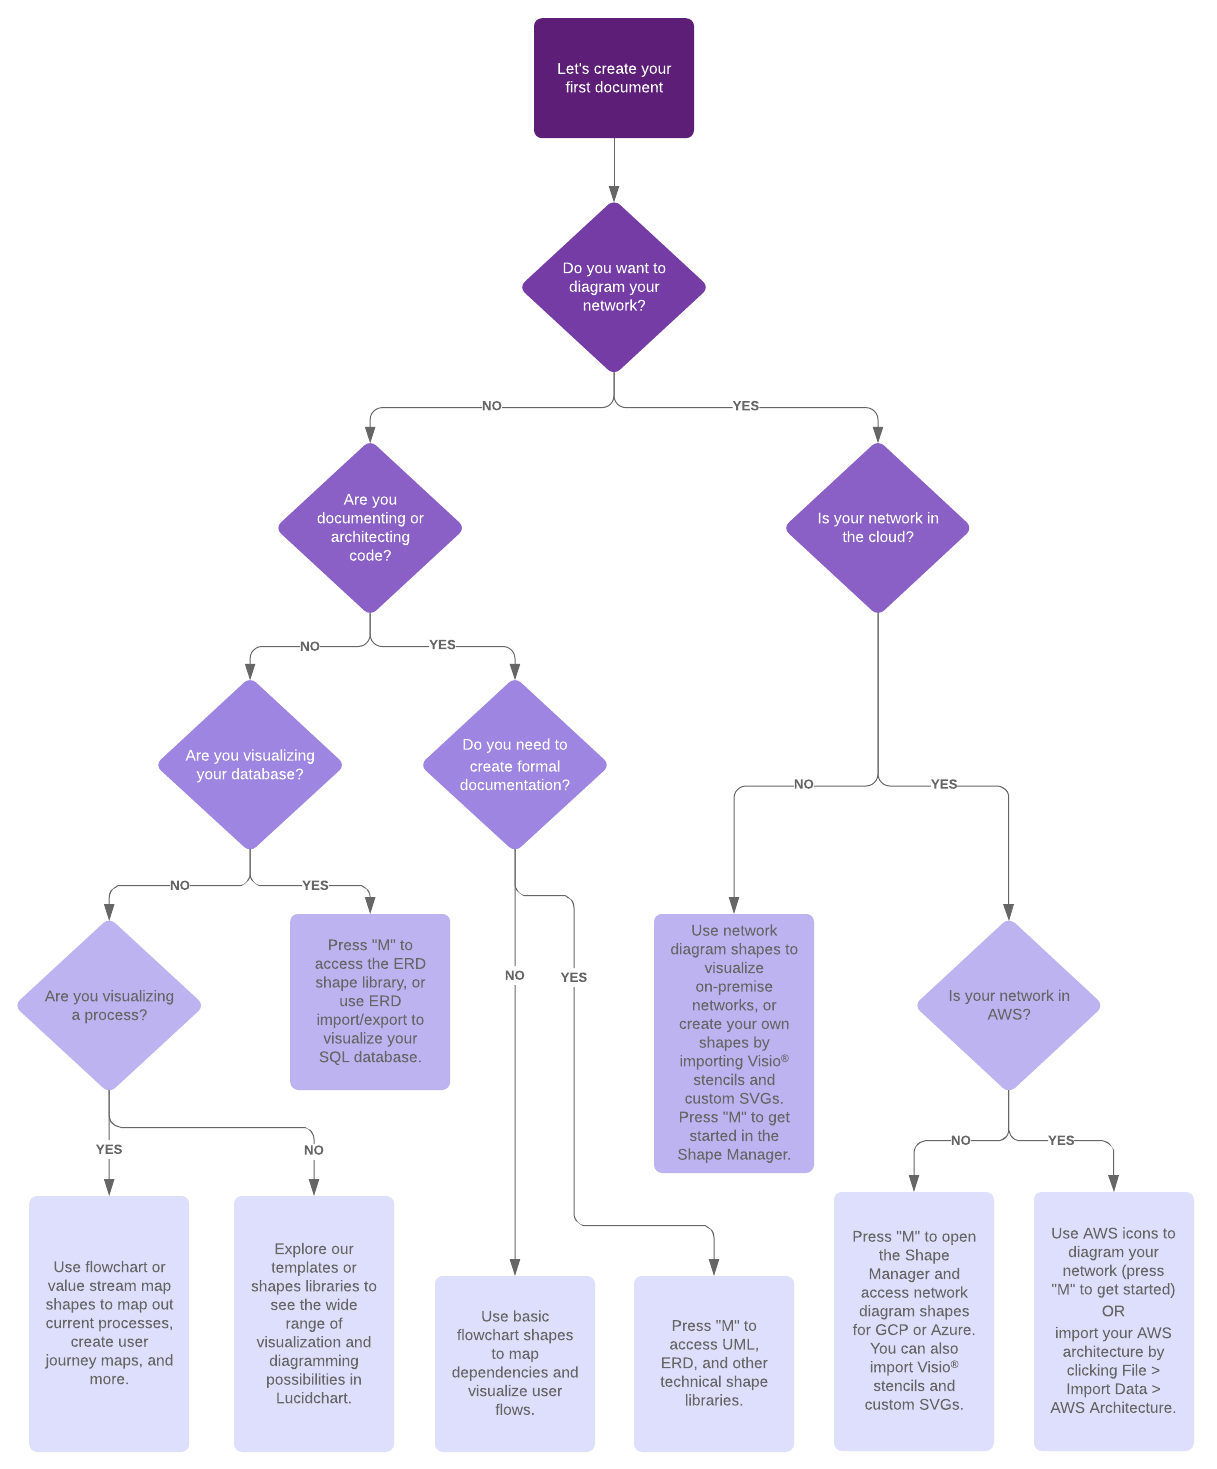
Lucidchart has dozens of pre-made flowcharts in its template library—to access them, click the down arrow next to “+Document” and select “Flowchart.” To read more about a template, simply click it once. To use a template, either double-click or select it and click “Create Document.”
Each template is completely customizable—move, add, or delete shapes and arrows until the diagram suits your needs.
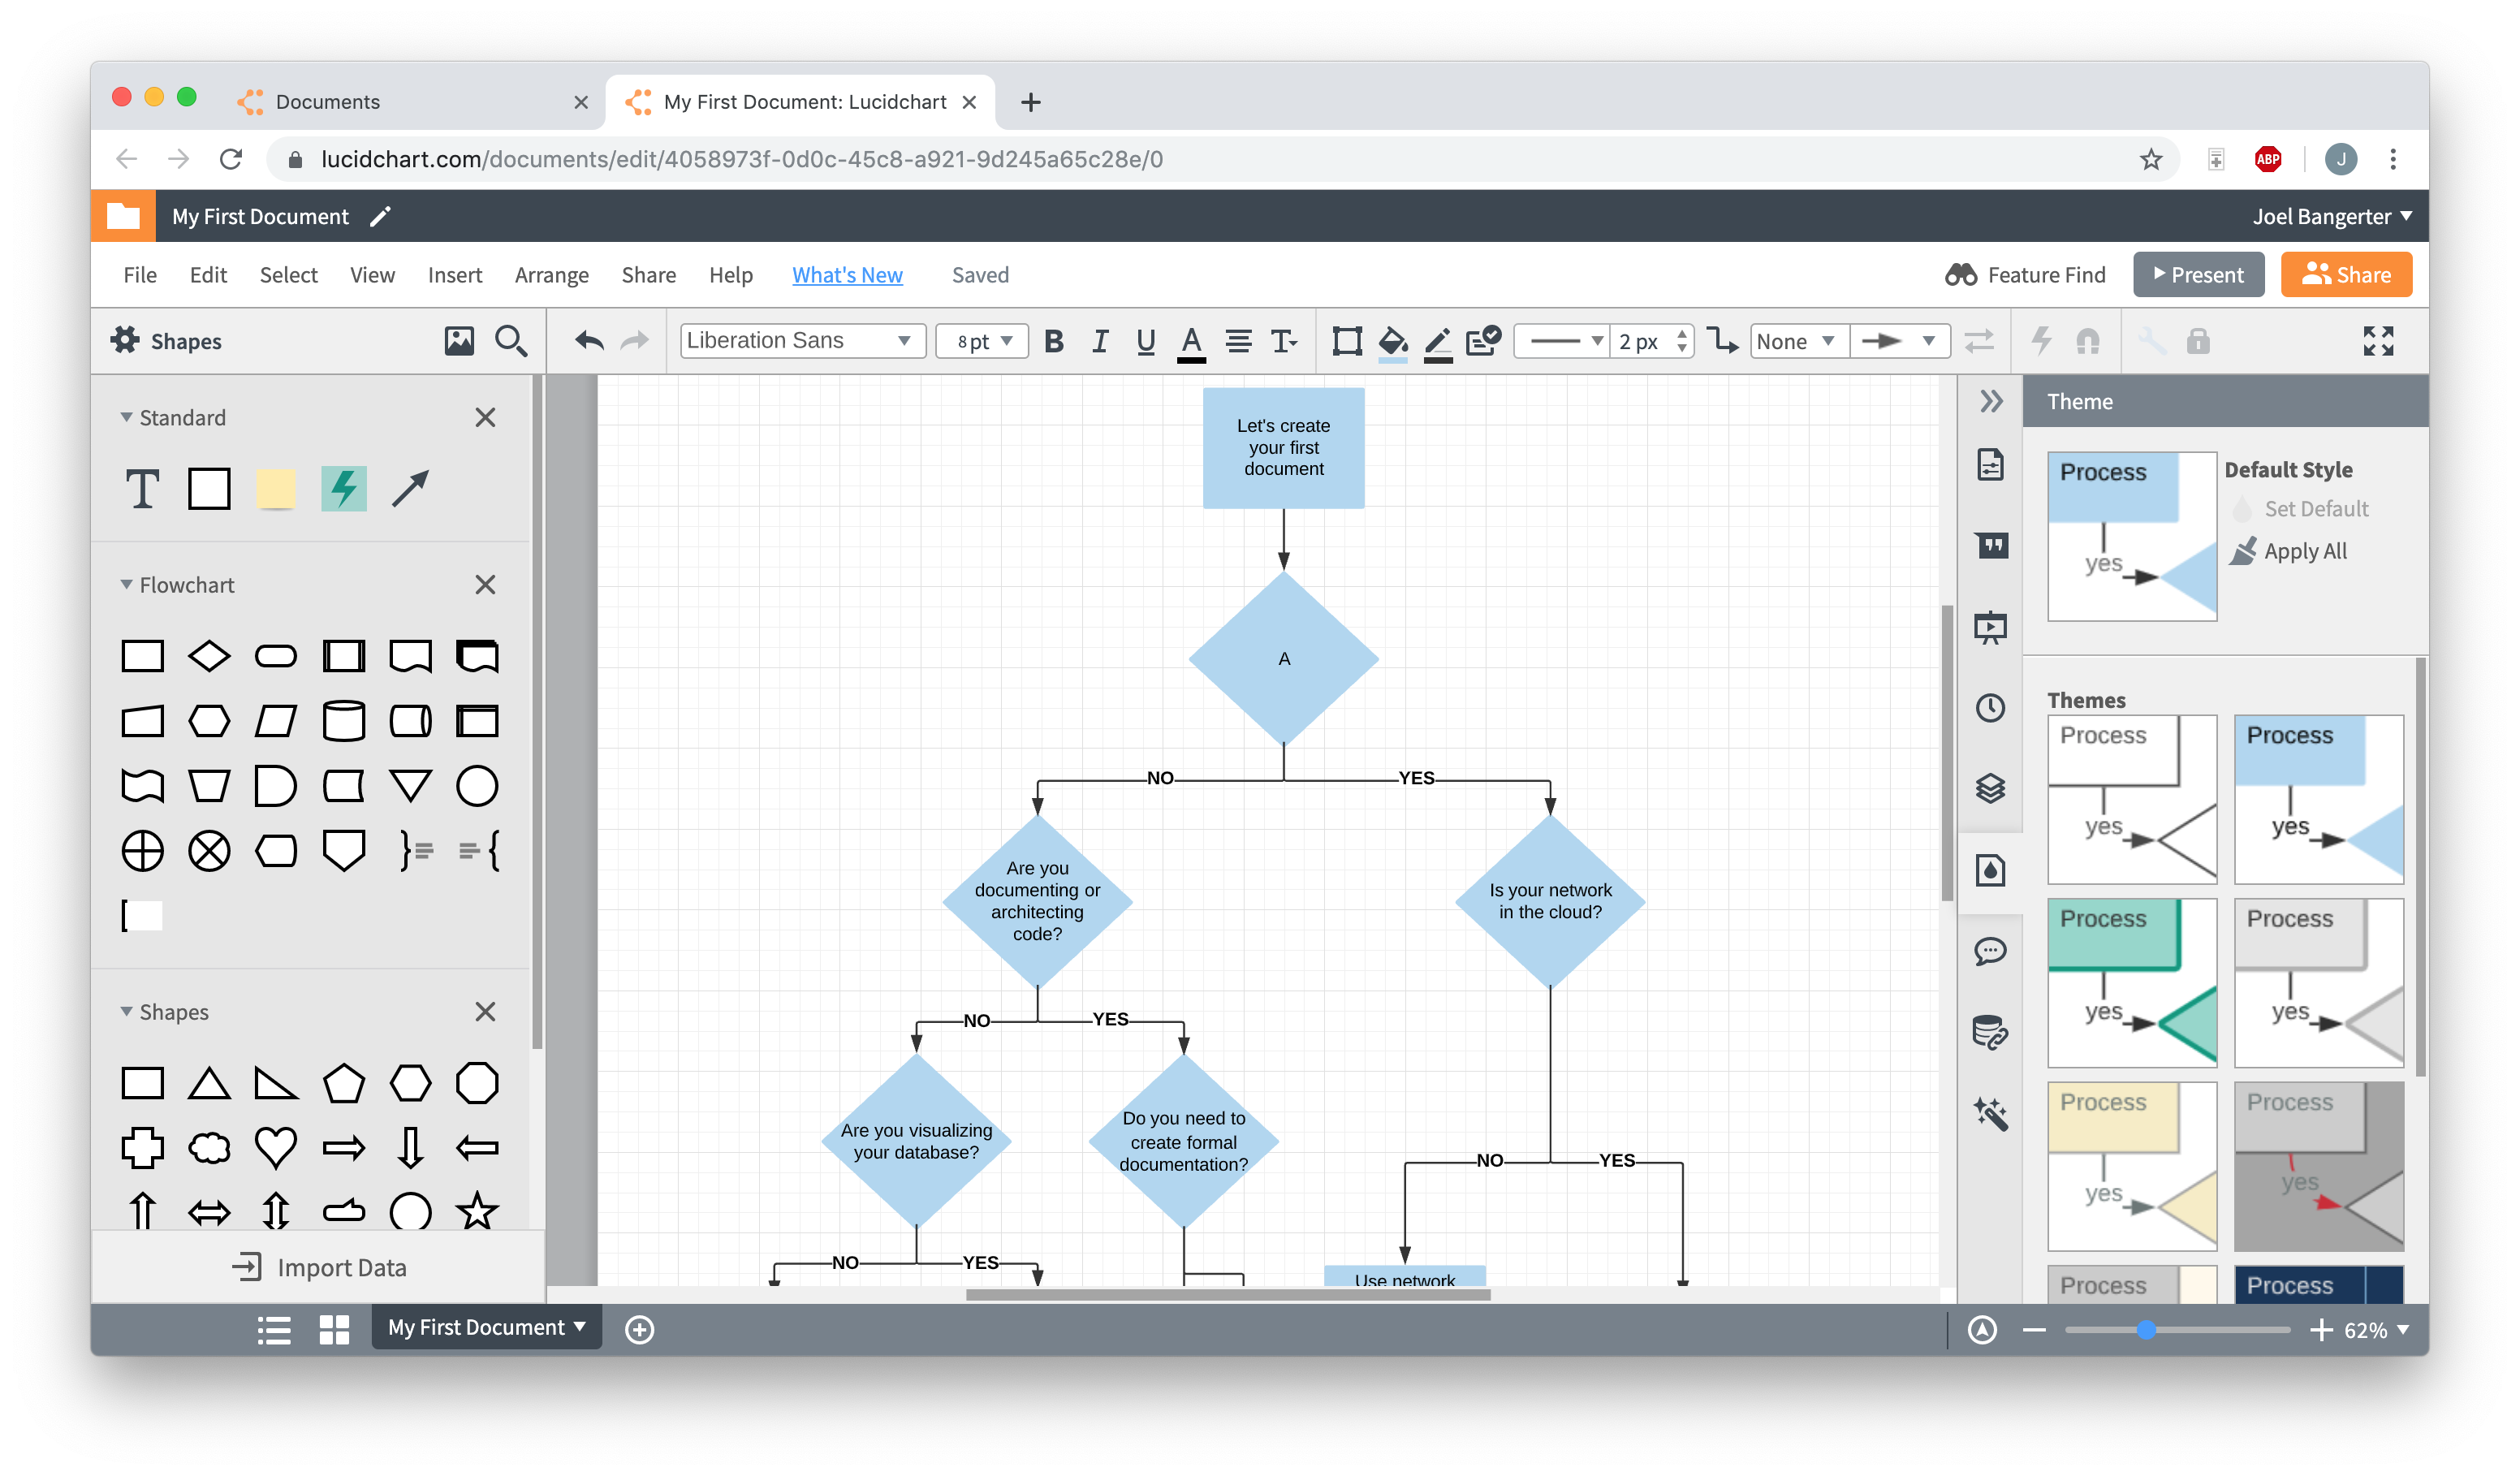
If you’d rather build your diagram from scratch, open a blank document by clicking “+Document.” With Lucidchart’s intuitive interface, adding shapes, lines, and text is a cinch. By default, the flowchart shape library is pinned to the shape menu—drag and drop shapes onto your canvas to start your flowchart. To add connecting lines, click and drag your cursor between two shapes.
2. Add text
At this point, your diagram should look almost complete. But it’s missing one crucial element: text. What decision is being made at each decision box? Which line represents yes? No?
Adding text to arrows and other shapes in Lucidchart is incredibly easy—just double-click and start typing! To edit existing text, do the same.
Font, text size and color, and much more can be easily adjusted using the toolbar at the top of the editor.
3. Format and style your flowchart
If you started your flowchart from scratch, it’s probably looking pretty plain—now’s your chance to change that. If you started from a template, your diagram is styled according to that template’s presets. You can still change the style to your liking!
To set a coherent, diagram-wide formatting theme, click “Theme,” the droplet icon located on the right-hand side of the editor. This opens a pane with a variety of themes to choose from—click on one to apply it to your diagram.
You can also style shapes individually using the toolbar at the top of the editor. Whether you’re changing line weight and fill color, adding a gradient, or adjusting opacity, use this toolbar to customize nearly every aspect of your shapes.
Insert a Lucidchart diagram into PowerPoint
With the Lucidchart add-in for MS PowerPoint, add your flowchart to a PowerPoint slide in a matter of minutes—just follow the steps below:
1. Install the Lucidchart add-in
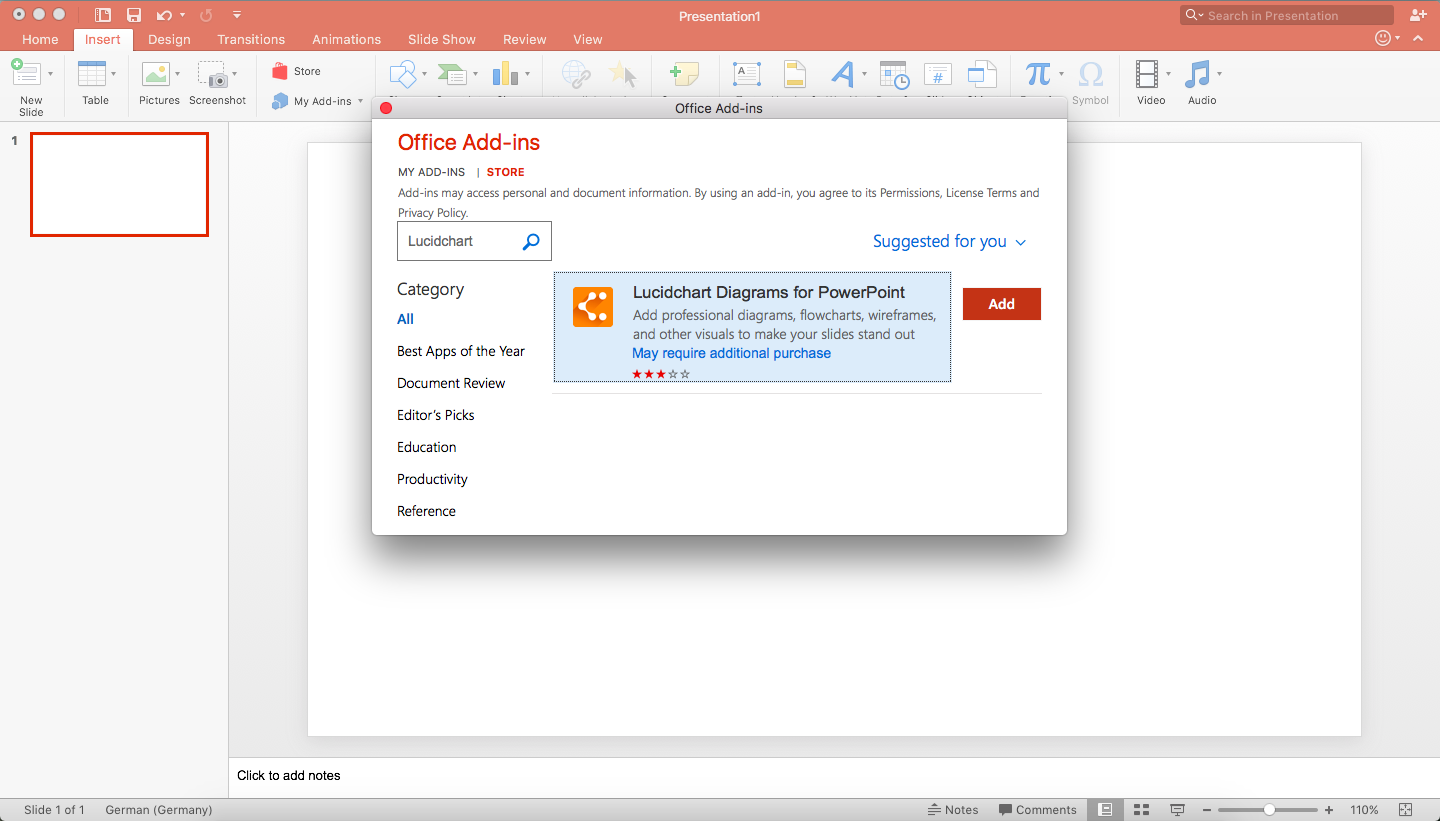
Installing the add-in takes only a few clicks! Open PowerPoint and go to Insert > My Add-ins > Store. Type “Lucidchart” in the search bar and click “Add.”
If the Lucidchart add-in doesn’t open when you download it, don’t worry. Simply go to Insert > My Add-ins > Lucidchart. (You may be prompted to enter your Lucidchart login info—once logged in, you can view all of your Lucidchart documents.)
2. Select a diagram to add to your PowerPoint slide
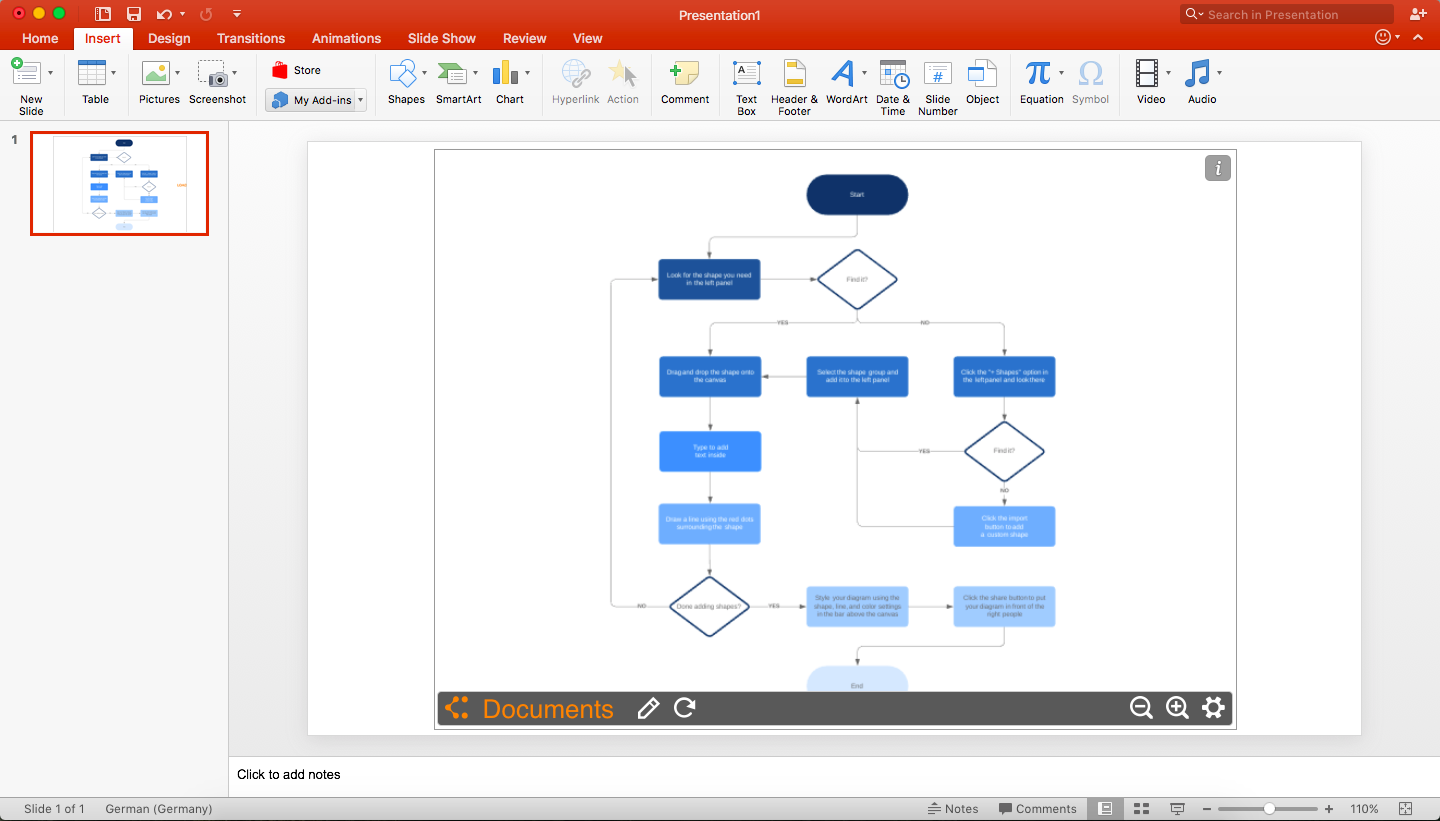
With the Lucidchart add-in open, you can view all of your Lucidchart documents in PowerPoint. To insert a diagram, hover your mouse over the diagram you wish to add and click “Select.” This will add the diagram to the current slide.
If you edit the diagram after inserting it, simply click the refresh icon (located on the toolbar below the inserted diagram), and any changes will be applied.
For more info on how to use the Lucidchart add-in, watch our video tutorial.