
How Lucidites Use Lucidchart: Diagrams Building Culture
Lucid Content
Reading time: about 4 min
Topics:
We’ve reached the end—the final blog post about the ways in which Lucid Software uses Lucidchart. (It’s okay to be upset.) When I started this project, I set out to learn how my co-workers applied our diagramming tool in their specific job functions, but I discovered right away that people used Lucidchart beyond their roles in engineering, product development, marketing, etc.
Not sure where to go for your new hire lunch? Someone has diagrammed it. If Lucidites are competing in a ping-pong tournament, you can bet there is a bracket living in Lucidchart to track the results. Lucid employees have even used the software in their personal lives—Sriraam Subramanian dropped maps into Lucidchart and marked points of interest to plan his trip to Yellowstone, and Craig Randall uses Lucidchart to map out storylines for the RPGs he builds.
Diagrams have worked their way into the entire culture of Lucid Software. Lucidchart doesn’t just make work better. It makes work more fun, too.
Planning OKRs
Our CEO, Karl Sun, borrowed an idea from his time at Google to help employees set goals: the OKR system. OKR stands for objectives and key results. Each employee submits three objectives each quarter, along with the intended measurable results, and scores them at the end for a clearer look at what he or she achieved over three months.
Employees refer back to their OKRs often, and QA Specialist Darren Pearson found a unique way of displaying his goals. Darren likes using mind maps in Lucidchart since they function the way he thinks—plus, Lucidchart is simple to use, customize, and share. Darren can make his OKRs look fun so he stays excited about his goals.

Set your own goals with a mind map
Presenting Tech Talks
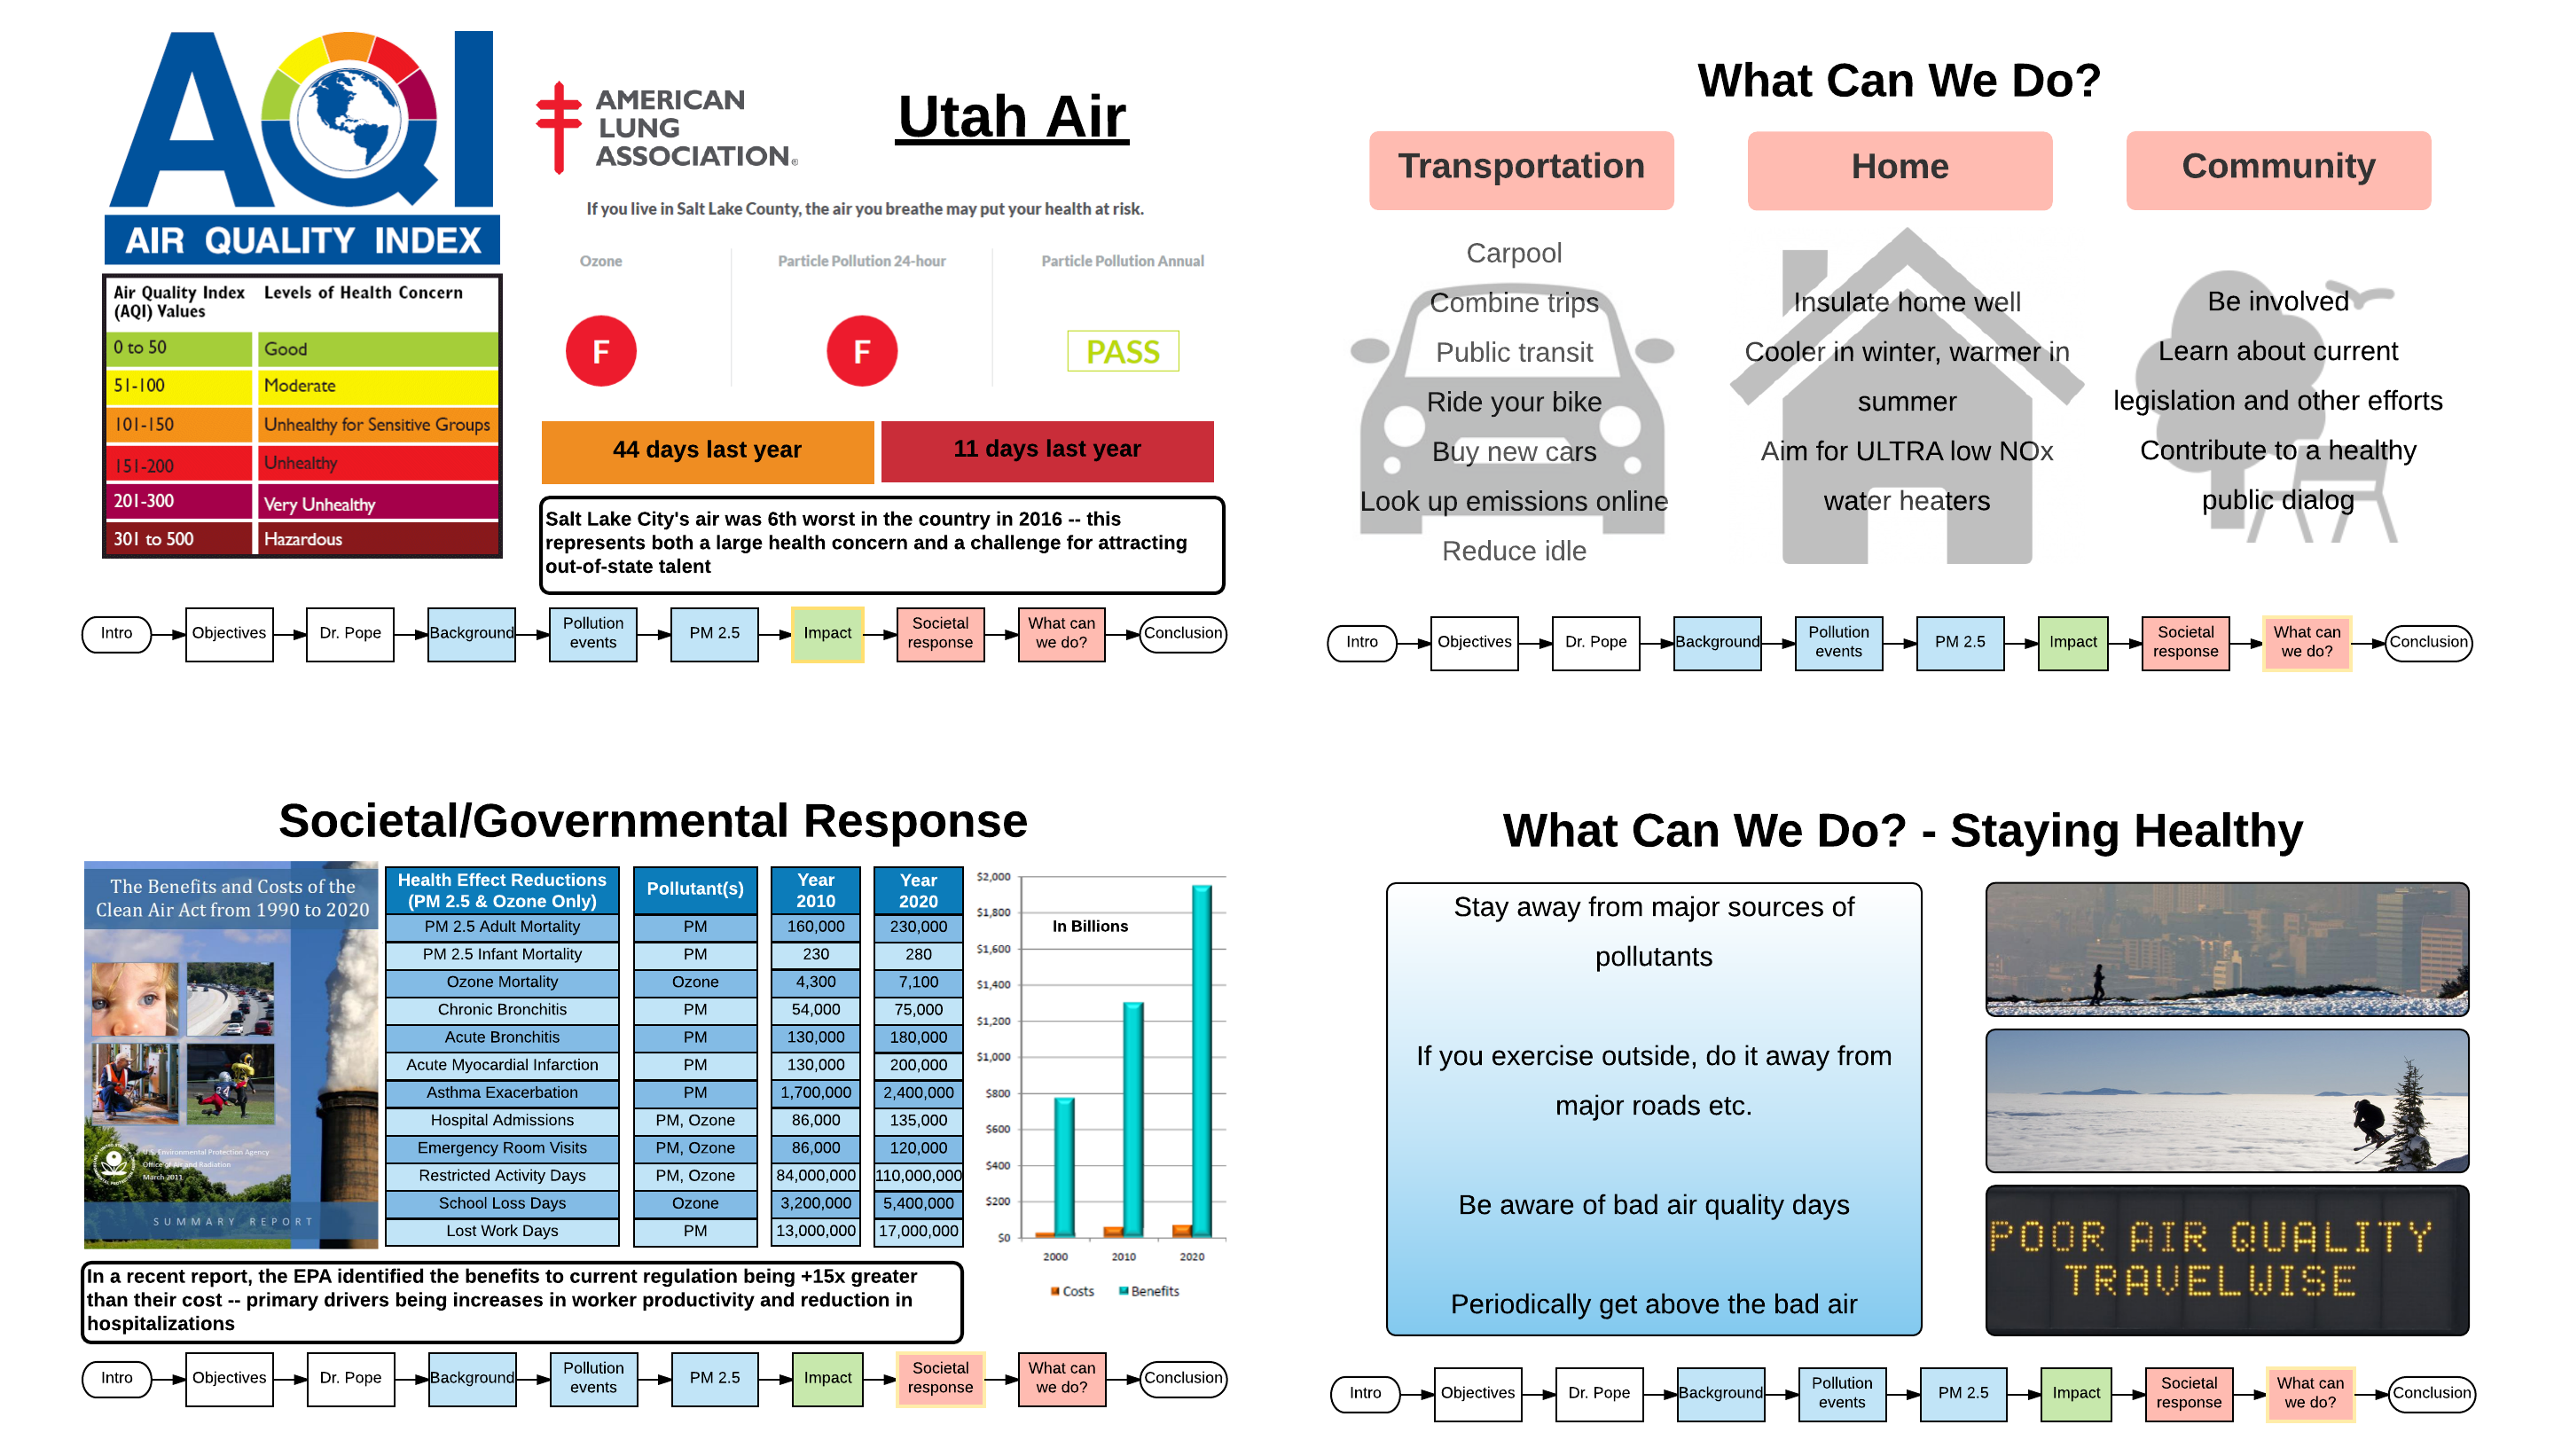
We recently expanded Tech Talks to include general and wellness topics, and just last month, Alex Burton presented on air quality, an ongoing problem in our hometown of Utah. Alex first outlined his presentation to group related material together and assign the approximate time to each section.

Then Alex stayed in Lucidchart to create the full slideshow for his Tech Talk. Using presentation mode, he turned all his visuals into individual slides. Alex even uses flowchart shapes to show the outline of his presentation at the bottom of each slide.
Orienting employees to a new workspace
You are probably aware of all the change that comes with a new job. It’s not just meeting new co-workers and learning where the conference rooms are. It’s finding your new favorite spot for lunch, deciding the fastest way to commute, remembering to take advantage of company benefits.
Libby Thomas, one of the forces behind our creative flowcharts, used that same medium to help new employees (or just really indecisive ones) determine where to go to lunch and where to use their wellness credit. In the case of the flowchart below, Libby uses links to make the process even easier—once the reader gets a result, he or she can click and learn more about that membership.

Declaring the rightful winner
Lucidites can get a little, shall we say, competitive. When a ping-pong or foosball competition is on, we use Lucidchart to create a bracket. The diagram includes a link to the rules at the top and images that describe some of our more creative competitors.
Lucidchart makes it simple to share the diagram with the entire company (so the winners can claim their rightful glory) and limit editing permissions to a few trustworthy people (so any sore losers can’t change the results).

Before games even begin, Lucidchart can assist with inviting people to participate. Abby Cohen made a sign-up form (shown in part below) for spring softball right in the editor.

Showing some love
When you work at a company that emphasizes visual thinking, you celebrate holidays a little differently. This Valentine’s Day, Emily Christensen designed a heart-shaped mind map, and she and the rest of the content team filled in all the reasons that we love working at Lucid Software.

The tool you already use to visualize processes and keep employees on the same page can keep your employees involved with the company and loving work as well. Make visualization a bigger part of your culture with Lucidchart.
Missed a post from this series? Check them all out here:
Product Development
Engineering
Quality Assurance
Marketing
Sales
People Operations
Lucidchart
Lucidchart, a cloud-based intelligent diagramming application, is a core component of Lucid Software's Visual Collaboration Suite. This intuitive, cloud-based solution empowers teams to collaborate in real-time to build flowcharts, mockups, UML diagrams, customer journey maps, and more. Lucidchart propels teams forward to build the future faster. Lucid is proud to serve top businesses around the world, including customers such as Google, GE, and NBC Universal, and 99% of the Fortune 500. Lucid partners with industry leaders, including Google, Atlassian, and Microsoft. Since its founding, Lucid has received numerous awards for its products, business, and workplace culture. For more information, visit lucidchart.com.