
How Lucidites Use Lucidchart: Diagrams for Product Development
Lucid Content
Reading time: about 4 min
Last time, we talked about the many ways that the Lucid Software marketing team uses Lucidchart, but let’s take a step back and see how our product managers use Lucidchart to create a plan and improve the software we offer, including Lucidchart itself.
If you work in product development or UX/UI design, look out for some new ways you can apply diagrams and visuals to your job.
Determining strategy
First things first: Our product managers need to decide on the features they want to work on. Jorge Mazal, Lead Product Manager, uses flowcharts to explain the methodology behind our product strategy. The example below shows the process the PMs should follow as they create roadmaps.

Jorge also uses Lucidchart to map out opportunities in the marketplace so the product team can determine what path to take next—other programs, like Word or Google Docs, wouldn’t be able to handle so many ideas on the same page.
Creating roadmaps
All of our product managers create roadmaps in Lucidchart to communicate the direction of the team and the product. Flowcharts can show both long-term roadmaps for the year and more specific goals for the quarter.
Vicky Thomas is the Head of Product Strategy at Lucid Software, She uses Lucidchart and other tools to create product roadmaps. Lucidchart works well for high-level planning because visuals allow Vicky to quickly communicate her ideas. Lucidchart also makes it simple for Vicky to change the diagram later on.
If you’re curious about the other tools Vicky uses, see her full blog post about a successful product manager’s toolbox.
Pitching ideas
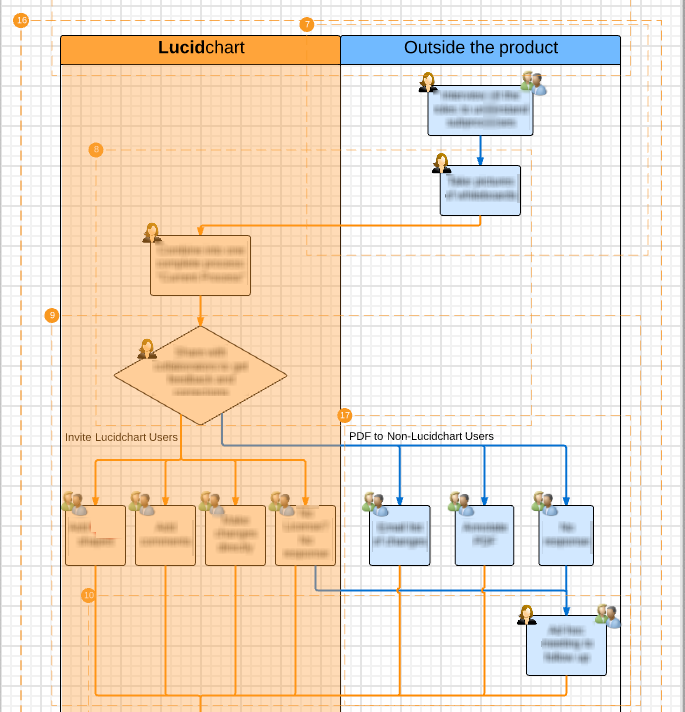
Product managers know that it isn’t enough to come up with an excellent idea—you have to get feedback from designers and engineers and then convince stakeholders that your suggested change or new feature will benefit users. You have to communicate the user problems that this new feature will resolve. Visuals help our product managers at Lucid Software illustrate customer stories and prove the value of new or improved features.
In this example, as part of a larger presentation, Anthony Morelli and Edgar Cheney showed a customer’s workflow inside and outside of Lucidchart and emphasized the pain points a customer may experience during that workflow. They later showed a similar visual of how the customer workflow would look if the product and engineering teams focused on a certain epic (that’s scrum speak for a block of requirements to build).
Say you do create diagrams to communicate user problems. Instead of exporting those images and uploading them to Google Slides or Powerpoint, you can create your whole slideshow in Lucidchart with presentation mode.
Just open the Presentation panel and drop slides (the orange boxes you see in the example above) around the content you want to display.
Making product flows
Once they have approval and support behind an idea, our team creates product flows to demonstrate how the software currently works and how it should work after the feature update.
Sr. Product Manager Anthony Morelli has taken a unique tactic to create product flows: He combines traditional flowchart shapes with our wireframe shapes in Lucidchart. Anthony can give a rough idea of the screen layout and then show the different paths users could take depending on the button they click.
In this instance, the product team was deciding whether to release a standalone Visio viewer app or bundle the Visio import functionality with our existing mobile app.

Product maps remain useful beyond the initial planning stages as well. QA specialists can refer back to these documents to ensure that the software functions as it should and that the engineers included all requirements.
To learn more about user flow diagrams, read Anthony's article.
Finalizing release plans
Finally, Lucidchart helps our team visualize the go-to-market plan when a new feature is ready. Our product managers have to coordinate with engineers, the QA team, the marketing team, and other groups to launch and announce the product on time, and swim lane diagrams within Lucidchart can clearly define each group’s role.

How have you used Lucidchart to develop products? Let’s hear your story in the comments.
Read how other teams at Lucid Software use Lucidchart:
Lucidchart
Lucidchart, a cloud-based intelligent diagramming application, is a core component of Lucid Software's Visual Collaboration Suite. This intuitive, cloud-based solution empowers teams to collaborate in real-time to build flowcharts, mockups, UML diagrams, customer journey maps, and more. Lucidchart propels teams forward to build the future faster. Lucid is proud to serve top businesses around the world, including customers such as Google, GE, and NBC Universal, and 99% of the Fortune 500. Lucid partners with industry leaders, including Google, Atlassian, and Microsoft. Since its founding, Lucid has received numerous awards for its products, business, and workplace culture. For more information, visit lucidchart.com.