
Mozilla
Lucidchart has helped product managers and UX designers at Mozilla to illustrate user flows, create low-fidelity mockups, minimize design artifacts, and keep remote workers aligned.
Contact salesKey benefits
- CONNECT
- Lucidchart allows John Gruen, who lives in New York, to easily communicate requirements to his UX designers in Taipei since he can't meet with them in person.
- CREATE USER FLOWS
- The team creates a high-level view of the application in Lucidchart before any high-fidelity design work so everyone understands the user experience before they invest a lot of time.
- COLLABORATE
- Lucidchart makes it simple to give everyone access to the user flow. The team can export it or publish it as a live link—any changes update in real time so team members are always aware of the current state.
- LINK TO DOCUMENTATION
- Mozilla links their Lucidchart diagrams to design artifacts in Dropbox to reduce duplication and ensure that people only reference up-to-date designs.
SIZE: Medium (101-2,500 employees)
Mozilla operates with the goal to develop an “Internet for people, not profit.” The company provides tools that make the Internet more open and accessible to users around the globe. Its innovations include the web browser Firefox, the systems programming language Rust, and a virtual reality platform.

Mozilla—a company you’ll likely recognize from its web browser, Firefox—develops open-source software to make the Internet safe and accessible to all. And, as it turns out, creating a space where people feel empowered to learn, create, and collaborate takes an extraordinary act of collaboration.
To achieve the company’s mission, product managers, designers, and developers all need to work together, even from different parts of the globe. Across multiple teams, Lucidchart helps Mozilla employees map out applications completely and easily. The web-based diagramming tool saves time and creates a shared understanding amongst the team before they press forward to build powerful software for a powerful Internet experience.
Illustrate an entire workflow
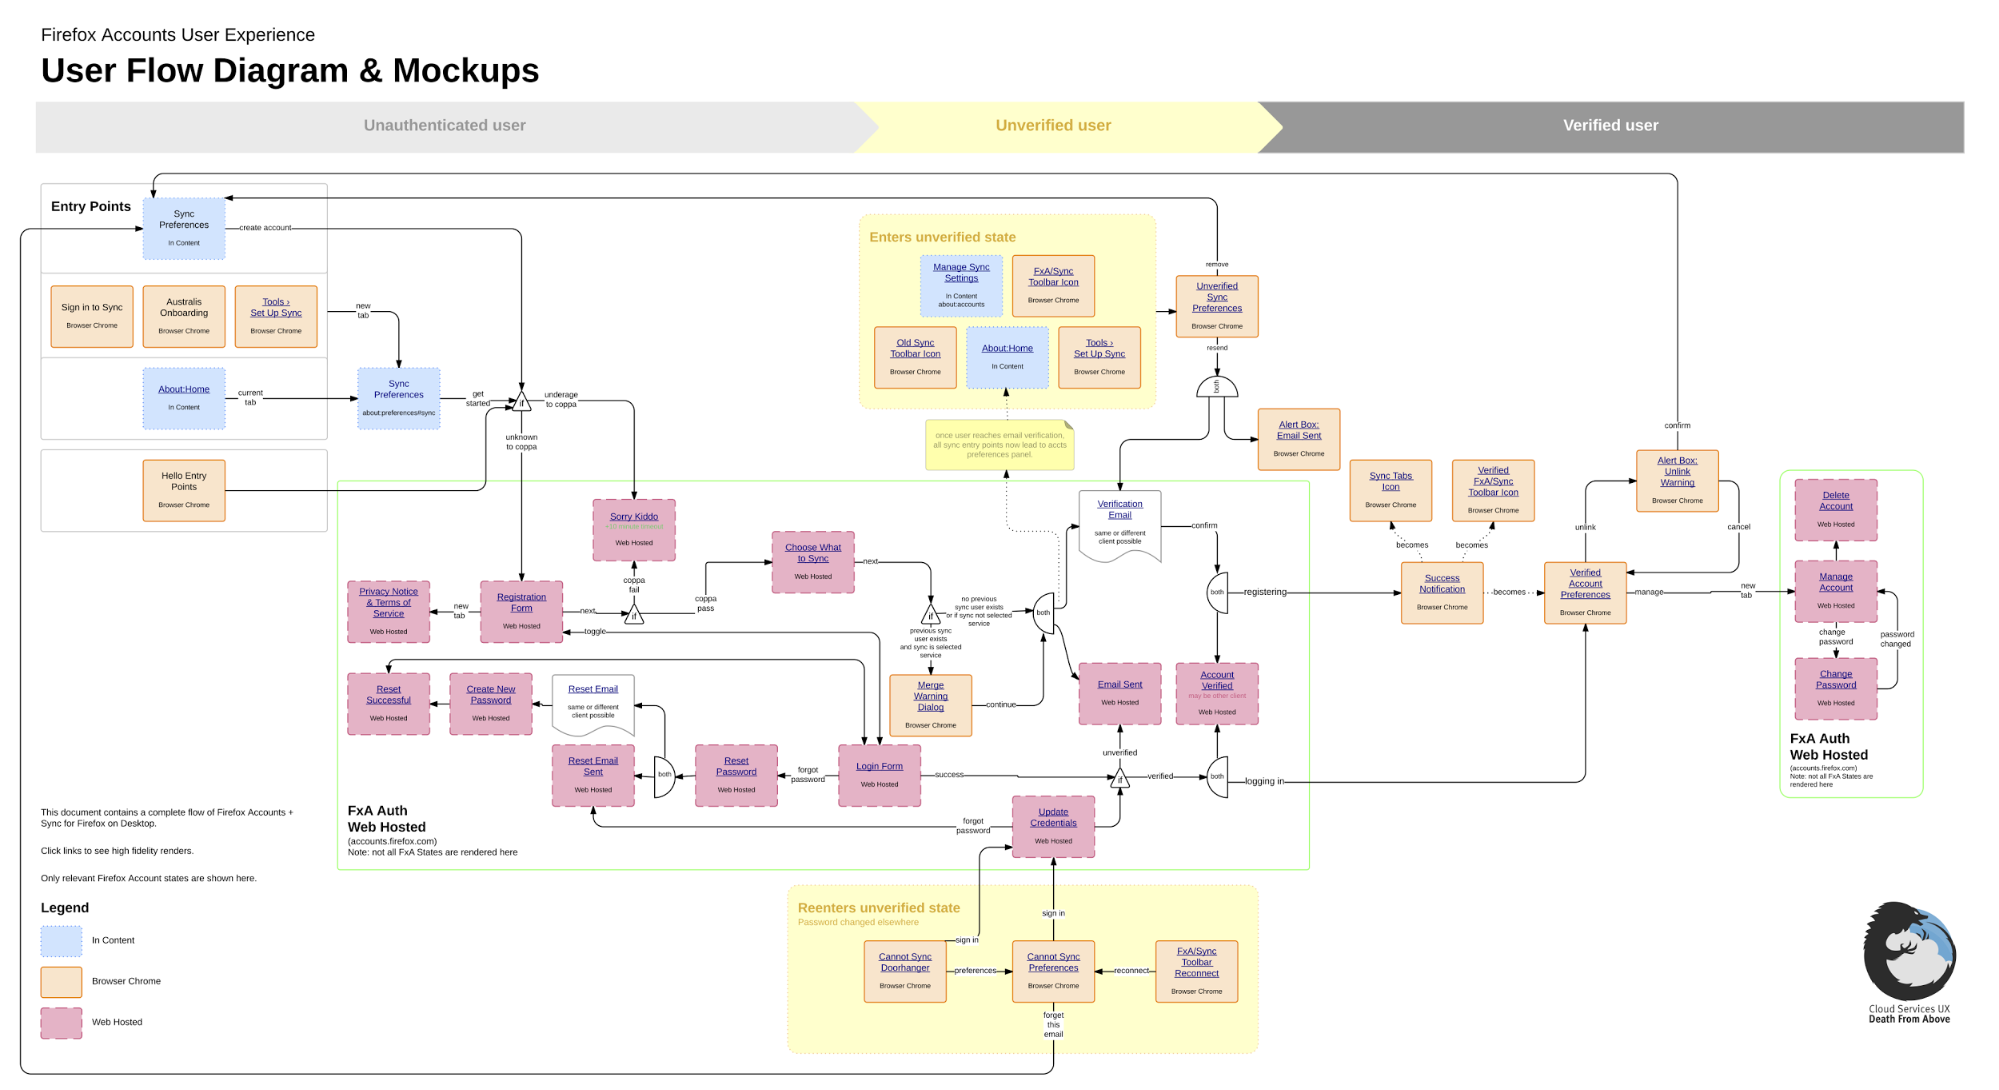
It all started when Ryan Feeley and John Gruen, both UX designers at the time, worked on Firefox Sync, which synchronizes bookmarks, browsing history, add-ons, and other information across multiple devices. The feature had been around for a while, but it was tricky for users to set up, so Ryan and John planned to design a simple username and password flow.
These designers wanted to keep everyone up to date as these changes happened; however, the inner workings of an application like this one become complex and involve multiple potential states. One screen won’t capture the application in its entirety.
And to top it off, Ryan worked in Toronto, and John worked in New York. To design this new workflow, they would need a way to communicate remotely.
So Ryan turned to Lucidchart. Using this tool, he and John could create user flow diagrams on unlimited canvas space to show all possible flows of the application. Because Lucidchart exists in the cloud, Ryan and John could both work on the diagram simultaneously. They could then share this diagram with developers and nail down the user flow before they started the final visual design.
Lucidchart includes all the shapes in the standard visual vocabulary that Ryan and John use—diamonds for decision points, dotted lines for conditionals, circles for concurrent actions, etc.—so these user flows are easy to read and understand. When he wants to “get really fancy,” Ryan has turned to other features, including links.
Minimizing duplicate design artifacts and duplicate work
Ryan discovered that Lucidchart, combined with the file-sharing service Dropbox, could solve another issue that he and John experienced as UX designers. Designers publish their work for different groups in different forms, including user flow diagrams, interactive wireframes, high-fidelity mockups, and usable graphic assets. In this instance, Ryan didn’t want to overwhelm the rest of the Firefox Sync team with the full UX documentation he gives the developers.
Having multiple versions of the same design creates an issue because design artifacts become out of date so quickly. Say a designer wants to include a low-fidelity mockup as part of a user flow diagram. The designer would not only spend extra time recreating that design, but he would also need to update the diagram as the design changes or leave the diagram inaccurate.
To reduce duplicate artifacts, Ryan and John developed a new workflow: they created a Dropbox folder filled with high-fidelity mockups and then linked specific stages of the Lucidchart user flow diagram to those files. If Mozilla employees wanted to see exactly what a user would see at a certain point in the flow, it was accessible in a single click.
This routine ended up as a win for developers as well. A developer could work from the same artifact for weeks—the fewer artifacts they receive, the better. At the same time, the UX designers could keep working on and modifying their designs. With the Lucidchart and Dropbox combination, the developers received one diagram, one resource, and Ryan and John could update the mockups in Dropbox. Having the right artifacts all in the same place equaled less confusion.
Saving time with low-fidelity mockups
Later, Ryan realized that the developers didn’t need a pixel-perfect design from his user flow diagrams because Mozilla has established its visual standards so well. He just needed to show the basics, and the developers could match the design from other parts of the website. So how much of the low-fidelity design could Ryan accomplish within Lucidchart?
Ryan imported Firefox logos and Mozilla’s standard font of choice and saved time by creating impressive low-fidelity mockups right within the editor.
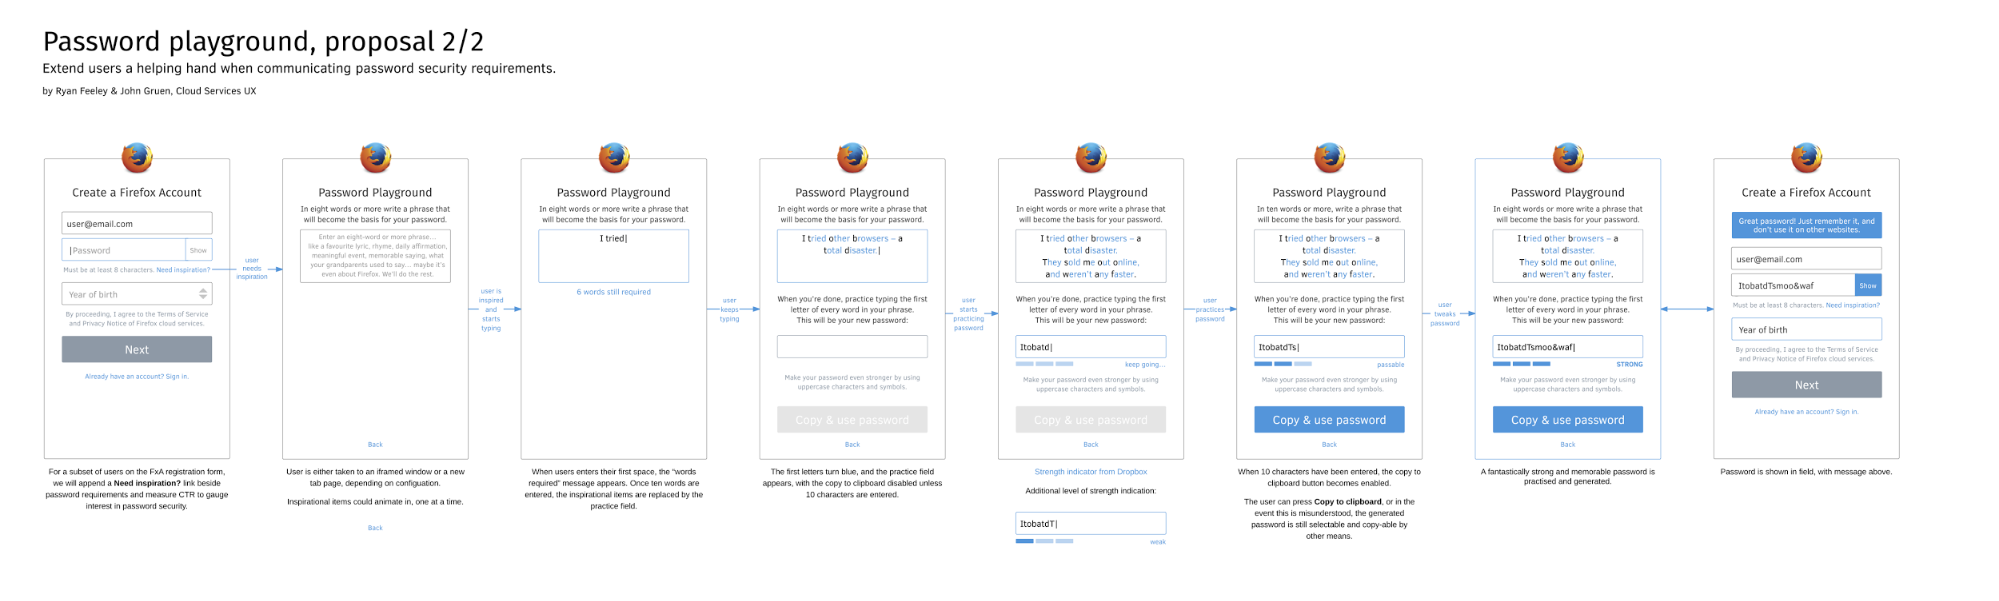
The mockups combined with user flows give developers a clear picture of how the application should look and how it should function. Ryan explained that his team even uses his user flow diagrams to train new members:
“Maintaining these diagrams helps people come up to speed with the way the system works.”
Keeping product managers and UX designers on the same page
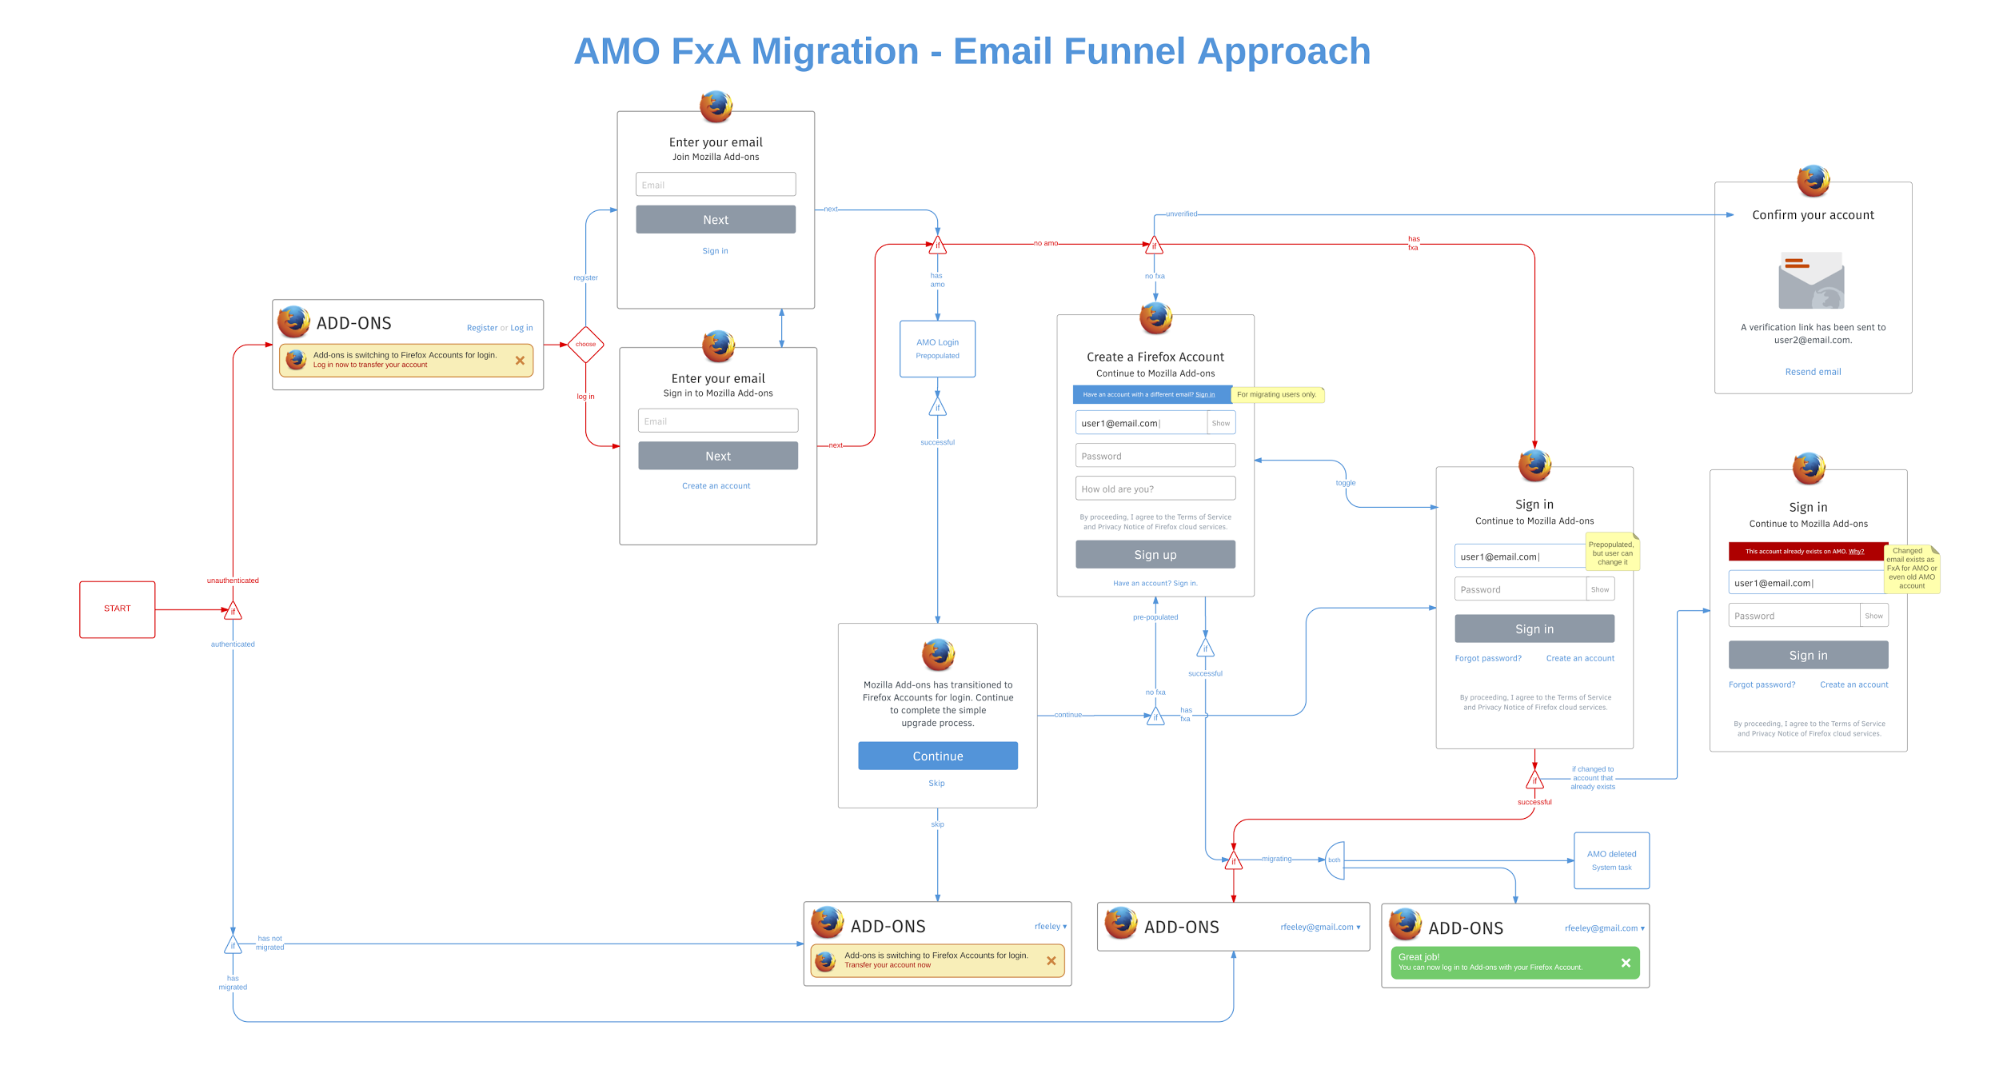
John Gruen has since switched teams to become a senior product manager over TestPilot, a platform that tests experimental Firefox features. When John started in this new role, he realized Lucidchart could once again meet his needs for a new challenge.
While designing on his own, John usually prefers to build interactive mockups in HTML, CSS, and Javascript to test the user experience himself. However, John found that method difficult to maintain once design was no longer his primary job and once he realized the designers on his team worked more in Photoshop and Sketch and less in code.
Without the time or bandwidth to use his regular method, John needed a way to show his team the current state of the application and to communicate different points of the application they should work on. And once again, these Mozilla employees worked in separate places. The design team was located in Taipei, thousands of miles away and 12 hours ahead of John, who was still located in New York.
So John creates and shares user flow diagrams in Lucidchart.
Mozilla designers work in other programs, like Illustrator and Sketch, to produce pixel-perfect mockups, but John explains that pixel-perfect mockups aren’t a valuable use of time until the later stages of the design process:
“It’s better for us to be working at a fidelity that matches the problem that we’re trying to solve.”
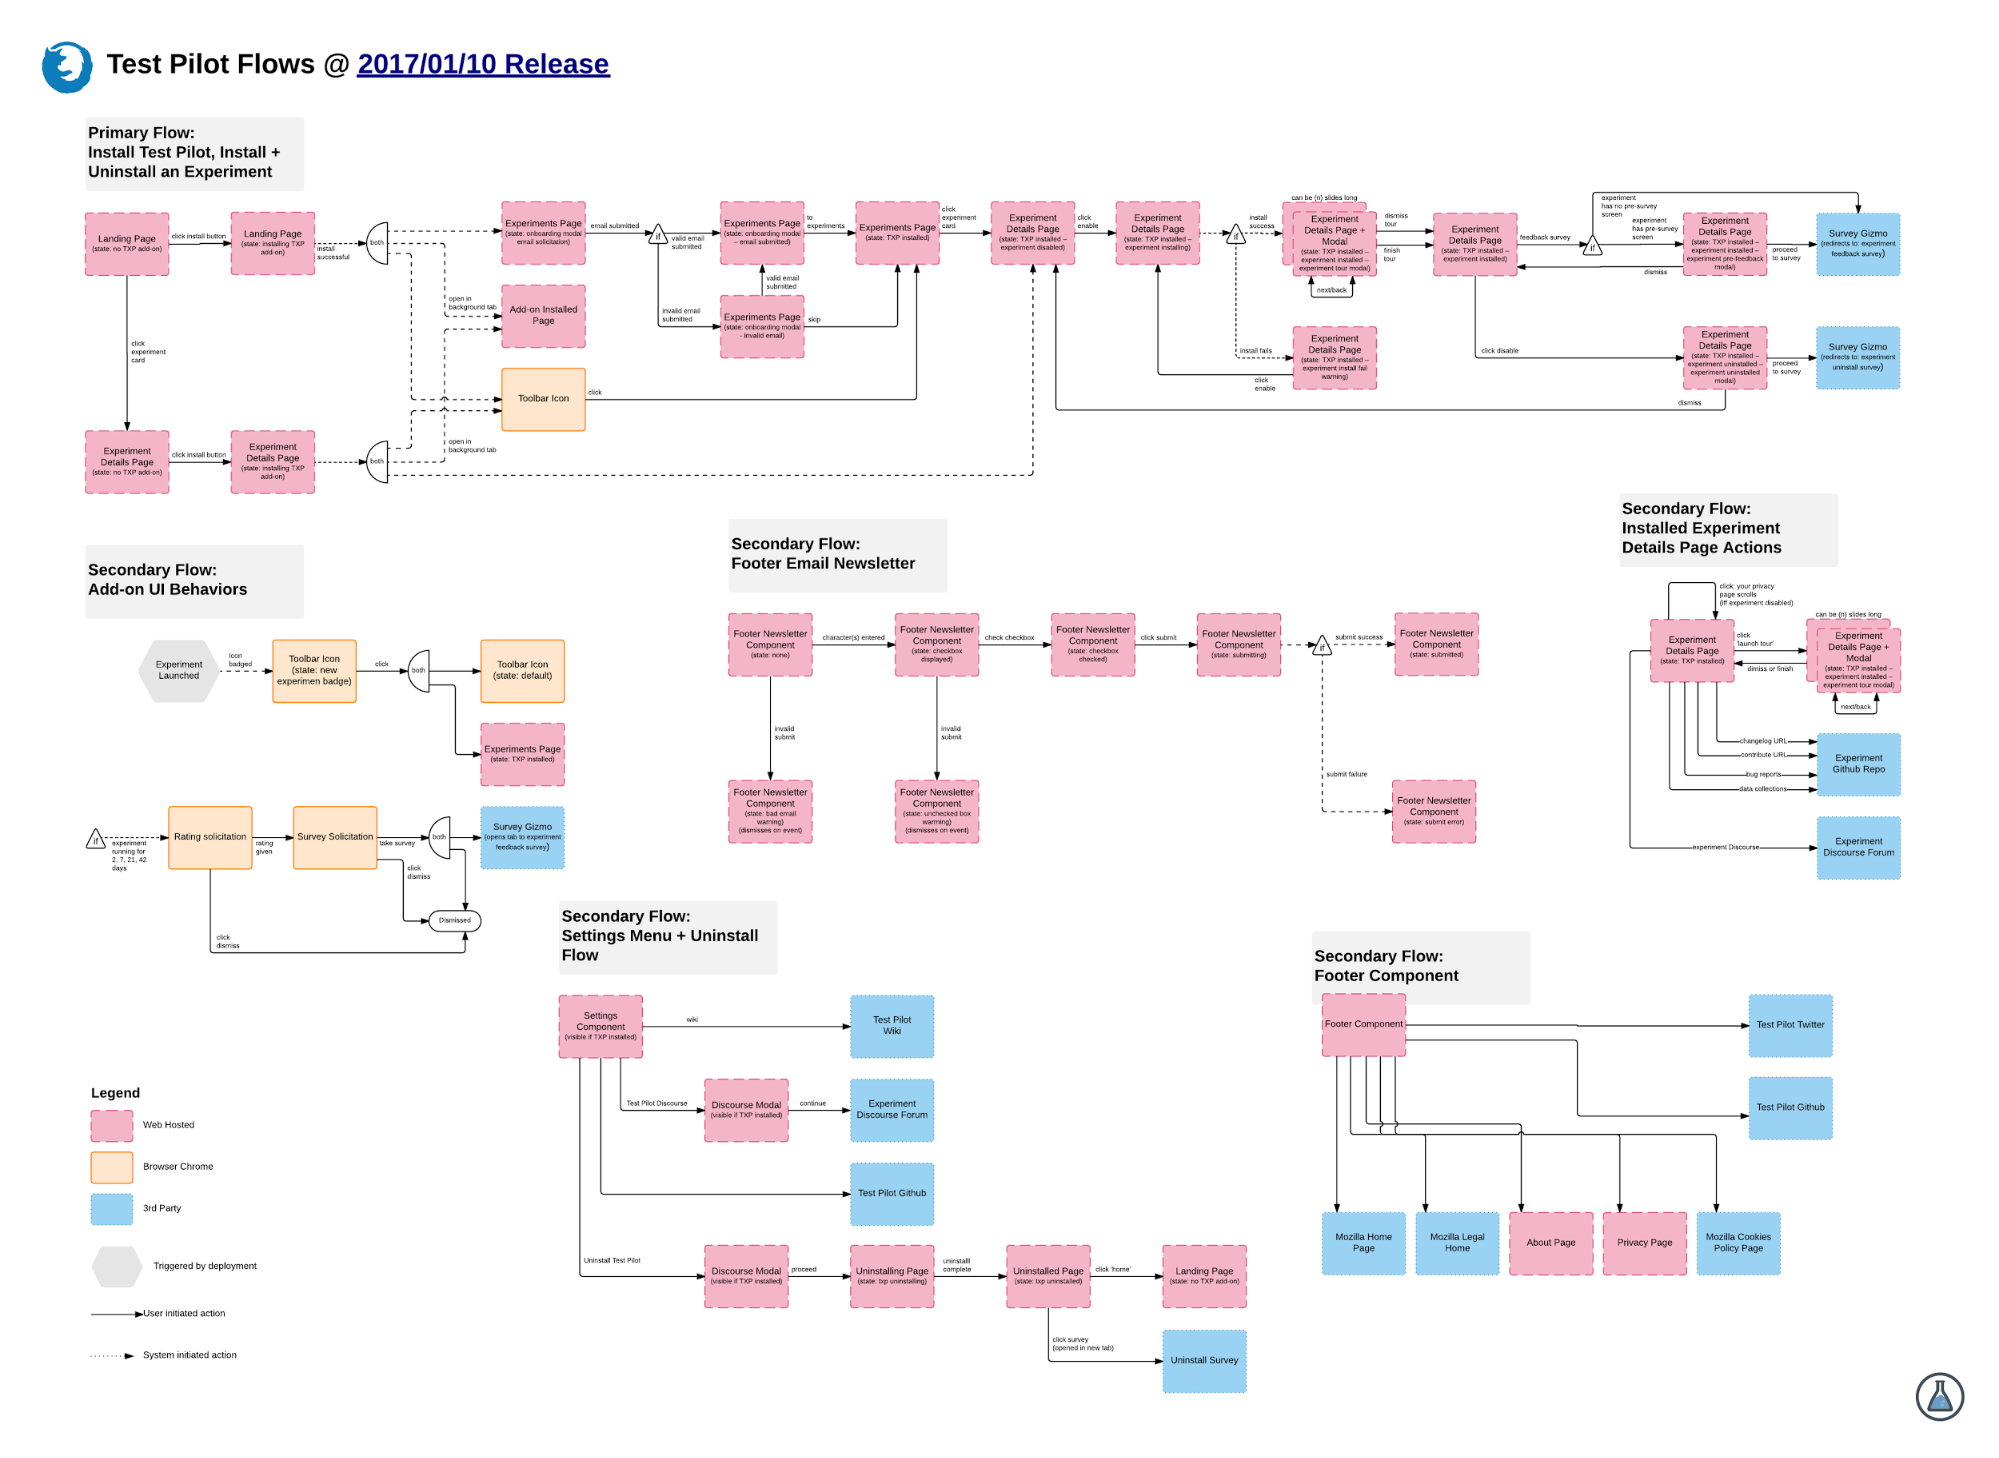
As an example, one of the designers on John’s team created high-fidelity mockups of the application early on in the design process. At that point, those mockups explained an idea still locked inside the designer’s head. John didn’t understand the context. He needed more than an image of one screen—he needed to know how he got to that particular screen and how he would move away from it to the next stage of the process. He asked the designer if they could step back and look at the entire application first.
Thanks to Lucidchart’s ease of use, John’s team can quickly define user flows with a high-level diagram and make sure everyone understands how the application works before the designers spend long hours on high-fidelity mockups. John states:
“Any tool that lets you crank out ideas fast and convey meaning fast… that’s obviously a win.”
Simplifying and defending processes with service blueprints
John has also used Lucidchart for service blueprinting, a technique used to model multi-touchpoint services. Many designers see these blueprints as an extension of a customer journey map—they show the customer journey, as well as all the interactions that occur behind the scenes to make that journey happen.
While John has used this technique to pitch ideas internally and generate buy-in, he plans to start blueprinting again for public communications about TestPilot and the process Mozilla uses to approve new features. In Lucidchart, John can easily visualize the process and add that image to a blog post. The service blueprint simplifies an otherwise complicated process for users who want to learn more about TestPilot without too much trouble.
Lucidchart = complete diagrams that are easy to create, share, and update
John noted several points of value in his experience with Lucidchart, including how easy the diagrams are to share, publish, and keep up to date.
One of the most valuable aspects, however, relates back to his and Ryan’s original need for the diagramming tool. It offers the ability to model an entire application—though John still likes interactive wireframes, the user flow diagrams he builds in Lucidchart allow him and the team to see what users experience all at once, without having to click through mockups to see what comes next.
“It’s the best way I know to map a global view of something. The fact that I can do that asynchronously and remotely for my company is invaluable.”
It makes sense that Mozilla and Lucidchart fit together: Mozilla believes the Internet allows people to collaborate and build great things. Lucidchart, the top web-based diagramming tool, proves it.