
Making a decision tree can help you clear up even the most complicated of choices and find the best option to pursue. Here's how.
6 minute read
Want to make a decision tree of your own? Try Lucidchart. It's quick, easy, and completely free.
Why make a decision tree?
Decisions, decisions—we all have to make them. When a business makes the wrong decision it can be a costly mistake resulting in financial loss, poor use of resources, and negative impact on a company’s image. Thankfully, a decision tree diagram can help. While it’s not a crystal ball, it can provide some valuable insight that can steer you in the right direction. One of the biggest benefits of a decision tree is that it can take emotions out of the equation.
Decision tree diagrams are often used by businesses to plan a strategy, analyze research, and come to conclusions. Lenders and banks use decision trees to calculate the riskiness of loans and investment opportunities. They are also a popular choice for infographics, often appearing in magazines or shared on social media. The point is that decision trees can be used to evaluate just about any question or concern and visualize possible outcomes.
Want to make a decision tree of your own? Try Lucidchart. It's quick, easy, and completely free.
Make a decision treeAnatomy of a decision tree
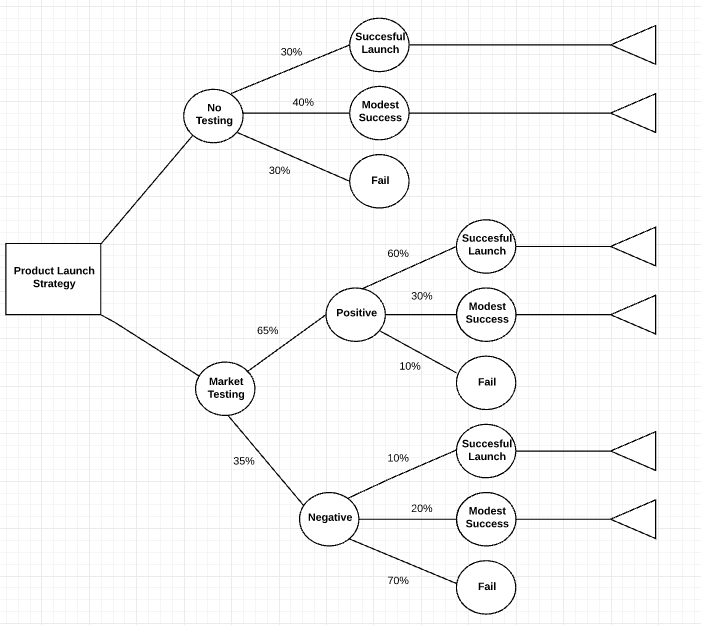
One of the nice things about a Decision Tree Diagram is that there aren’t a lot of elements. The key elements are called nodes, and appear as a square or circle with branches (lines) connecting them until a result is reached. Squares represent decisions, while circles are for uncertain outcomes.
Nodes have a minimum of two branches extending from them. On each line write a possible solution and connect it to the next node. Continue to do this until you reach the end of possibilities and then draw a triangle, signifying the outcome.
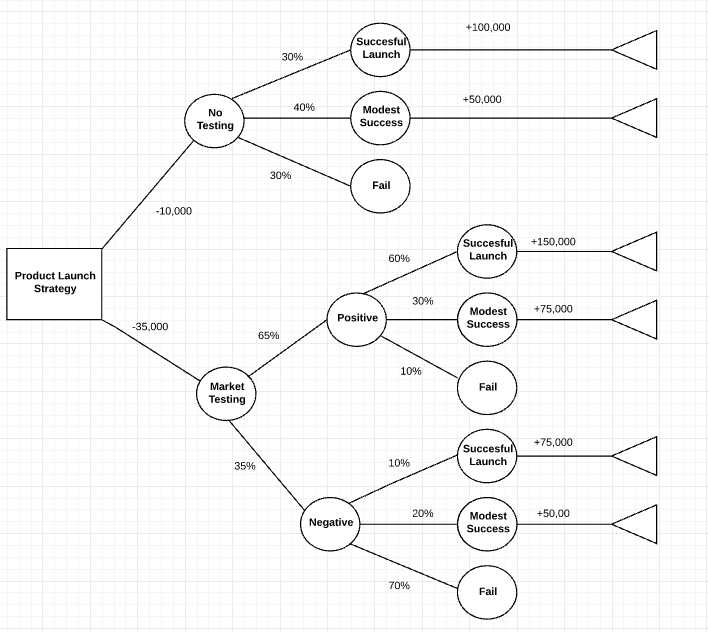
Once you’ve got the basic layout of a decision tree complete, you can add values to each line to garner more intelligence. Here’s how to do it:
1. Look at each line and add an amount to each.
2. To analyze your options numerically, add an estimate for the probability of each outcome. Note: When adding percentages all the lines from a single node need to equal 100, if you’re using fractions they need to add up to 1.
3. Assign a possible amount to each triangle at the end of the branches.
4. Calculate the results by multiplying the result by the percentage probability for each end branch in that outcome and subtract the cost of that course of action. You’ll end up with an estimate of what that particular outcome could yield.
Here’s an example:

Note:
If you have a large tree with many branches, calculate the numbers for each square or circle and record the results to get the value of that decision. Start on the right side of the tree and work towards the left.How to make a decision tree with Lucidchart
Let’s use Lucidchart to make a Decision Tree for a product launch, and decide if it makes sense to invest in market testing first. There are only a few symbols (circle, square, line, and triangle) in a Decision Tree Diagram, so we’ll make one from scratch. Log in to your account (if you don’t have one, sign up to try Lucidchart free for a week) and follow the steps below.
1. Open a blank document
In the Documents section, click the orange +Document button and double-click.

Tip:
You can also click the orange down arrow and choose a blank diagram template. If you choose that option, skip to step 3.2. Adjust the page settings
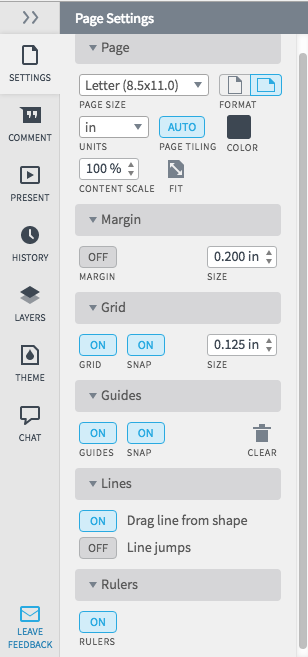
When you open a blank document, instead of a template, you can change the page settings, margins, guides, grids, lines, rulers. On the right, you’ll notice the Page Settings menu where you can make any adjustments. Just click the options you want and once finished click the arrows next to Page Settings to hide the menu. Since Decision Trees can get large, we’re going to change the page format to landscape.
3. Name the decision tree diagram
Click on the Blank Diagram header at the top of the screen and type a name for the file.

Note:
If you chose a template, a pop-up screen opens, type the name of your diagram in the text box and click OK. The new name appears in the top left corner of the screen.4. Start drawing the decision tree
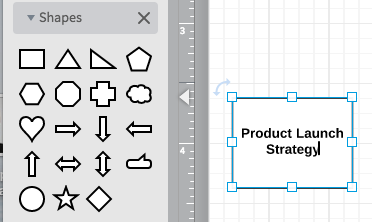
Click and hold the rectangle under Shapes and drag it to the far left side of your document. Decision trees are drawn left to right, so place it as close to the margin as you can. Use the grid and ruler to align the rectangle where you want it. Type the decision in the rectangle.
Tip:
Use the text formatting options at the top of the diagram to change fonts, colors, spacing, etc.5. Add nodes
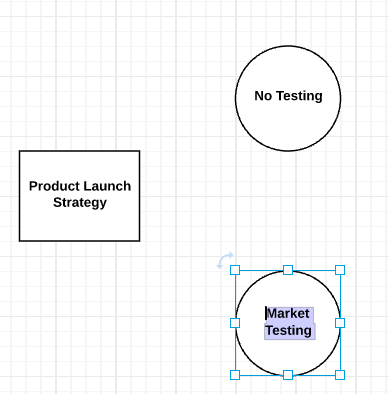
Click and drag a circle to the diagram to add the uncertain nodes. Use the grids to align the circles on the page. To adjust the circle’s size, click on it, click on a blue square and drag it to resize. Type the name of the uncertain outcome in the circle.
You can add as many possibilities as you want, but you need a minimum of two options when starting a decision tree. Continue adding nodes to the decision tree until you reach the end outcome for each choice.
Tip:
If you don’t want to resize each node (circle), simply click on an existing circle and press and hold Command+C on the keyboard. Next, press and hold click Command+V and a duplicate circle will appear, drag it into place.6. Add branches to the decision tree
To draw lines between the nodes, click on a shape and click and hold one of the orange circles and drag the line to the next node. An arrow is automatically drawn between the two objects.

Tip:
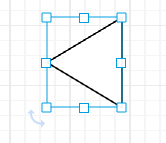
To remove the arrowhead from the line, choose No Tip from the Endpoint option for lines in the top menu bar.When you get to the end of a branch, where no other decisions are needed in that route, add a triangle to the end of that row.
7. Add probabilities and values to the decision tree
It’s time to evaluate the decision tree, so you can estimate how much it’s worth if a particular outcome occurs. Look at the circles and add estimates for the probability of each outcome. To add numbers to the diagram, click on the large T in the Standard options and drag it to the spot where you want to add an estimate.
Note:
Percentages for each node should equal 100, if you’re using fractions, each node should add up to 1. Feel free to use existing data, if you have it.Next, add the cost of each option along the branch (decision line).
8. Calculate the value of each decision
Start on the right side of the tree and work towards the left. Subtract the cost each decision from the expected benefits.
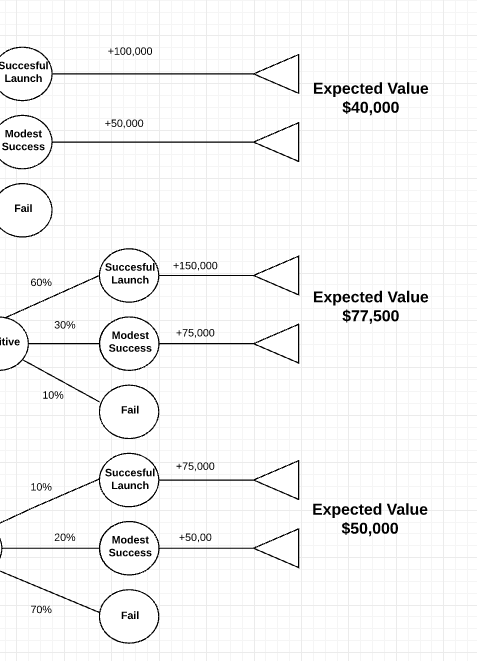
Once calculations are complete, you’ll clearly see which option will give you the biggest reward.
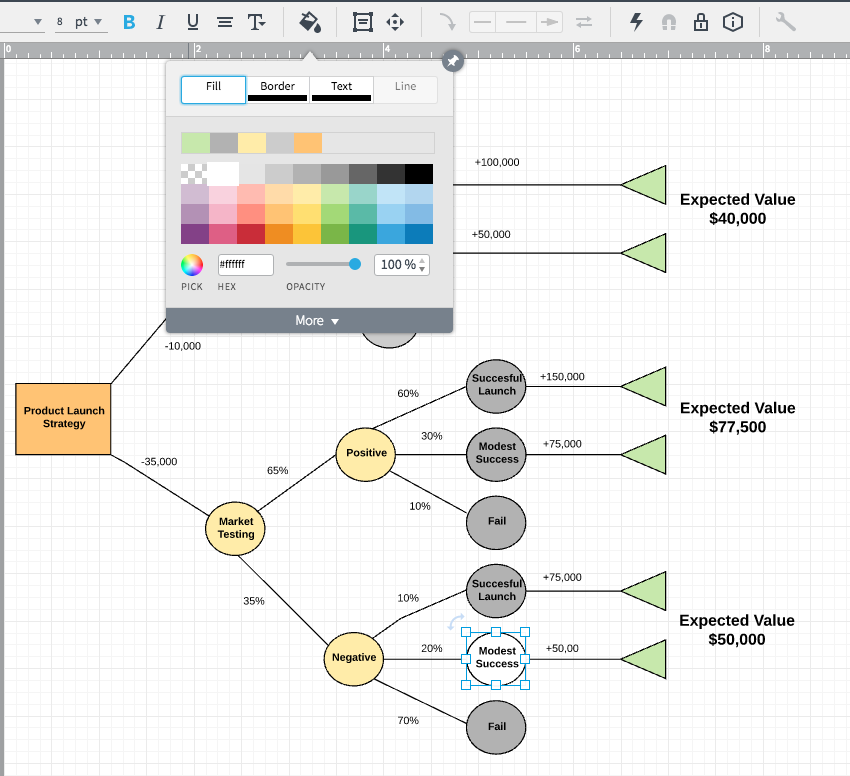
9. Add colors to the decision tree
Once you have the basic design of your decision tree complete, you can add colors by clicking on a symbol and then click the color-fill icon on the menu bar and choose a color.
10. Share your decision tree diagram
Once you like the way the decision tree looks, you can share it with others either via email, link, social media (Facebook, Twitter, Google+, and LinkedIn), or embed it on a website. Click the blue Share button in the top right corner of the screen and a pop-up will appear. Choose how you’d like to share the diagram and enter the appropriate information.
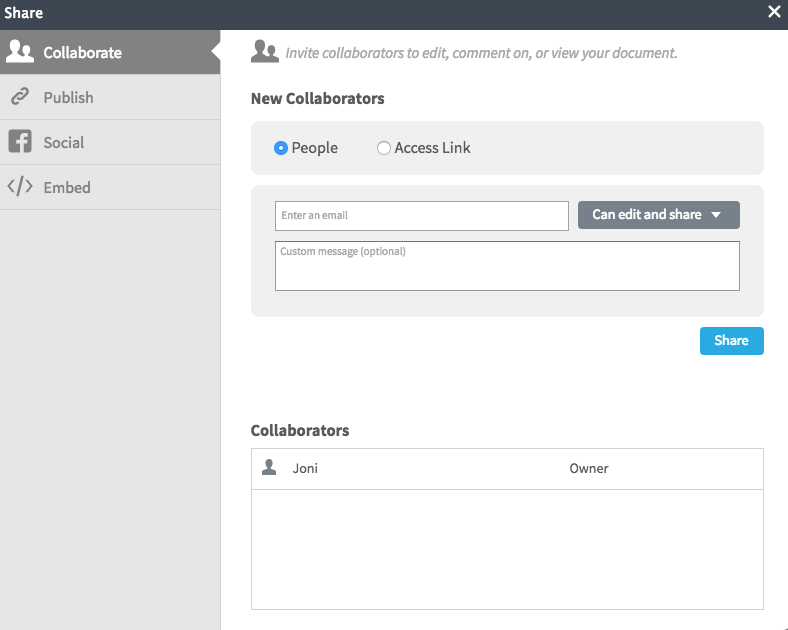
When you add a collaborator by sending a link to decision tree via email, you can work on the diagram simultaneously and use the chat feature to have discussions.