
Professionals in sales, project management, and other areas use business process modeling software to map out their approach to any specific process. Learn the essentials of BPMN and BPMN 2.0, along with the history, purpose, benefits, symbols, diagram types, and key tips for business process modeling.
13 minute read
Want to make a Diagram of your own? Try Lucidchart. It's quick, easy, and completely free.
What is BPMN?
Business Process Modeling Notation (BPMN) is a flow chart method that models the steps of a planned business process from end to end. A key to Business Process Management, it visually depicts a detailed sequence of business activities and information flows needed to complete a process.

Its purpose is to model ways to improve efficiency, account for new circumstances or gain competitive advantage. The method has been undergoing a standardization push in the past few years and is now often called by a slightly different name:
Business Process Model and Notation
, still using the BPMN acronym. It differs from Unified Modeling Language (UML) used in software design.Very recent history
Business Process Modeling Notation was developed by the Business Process Management Initiative (BPMI) and has gone through a series of revisions. In 2005, that group merged with the Object Management Group (OMG), which took over the initiative. In 2011, OMG released BPMN 2.0 and changed the method’s name to Business Process Model and Notation. It created a more detailed standard for business process modeling, using a richer set of symbols and notations for Business Process Diagrams. Since 2014, BPMN has also been complemented by a decision flow chart method called the Decision Model and Notation standard, since BPMN doesn’t naturally lend itself to decision flows.
Purpose and benefits
At a high level, BPMN is targeted at participants and other stakeholders in a business process to gain understanding through an easy-to-understand visual representation of the steps. At a more involved level, it’s targeted at the people who will implement the process, giving sufficient detail to enable precise implementation. It provides a standard, common language for all stakeholders, whether technical or non-technical: business analysts, process participants, managers and technical developers, as well as external teams and consultants. Ideally, it bridges the gap between process intention and implementation by providing sufficient detail and clarity into the sequence of business activities.
The diagramming can be far easier to understand than narrative text would be. It allows for easier communication and collaboration to reach the goal of an efficient process that produces a high-quality result. It also helps with communication leading to XML (Extensible Markup Language) documents needed to execute various processes. One main XML standard is called BPEL or BEPEL4WS, standing for Business Process Execution Language for Web Services.
Common BPMN symbols
A business process model and notation diagram, or BPMN diagram for short, is used to build easy-to-read business process model flowcharts, which can be shared across organizations and industries. BPMN diagram symbols are categorized into four main groups: flow objects, connecting objects, swimlanes, and artifacts. Read this comprehensive guide of BPMN diagram shapes and their meanings below.
BPMN event types
Events represent an event in a business process.
 |
Start event symbol- Signals the first step of a process. |
 |
Intermediate event symbol- Represents any event that occurs between a start and end event. |
 |
End event symbol- Signals the final step in a process. |
BPMN event symbols
Each of these BPMN event symbols can be styled to represent the specific details of their process. The examples below are contained within start event symbols, but they can be combined with any event type. Common event symbols represent the following circumstances:
 |
Message symbol- Triggers the process, facilitates intermediate processes, or finishes the process. |
 |
Timer symbol- A time, date, or recurring time and date triggers the process, aids intermediates processes, or completes the process. |
 |
Escalation symbol- A step reacts on an escalation and flows to another role in the organization. This event is only used within an event sub-process. An escalation occurs when someone at a higher level of responsibility within the organization becomes involved in a process. |
 |
Conditional symbol- A process begins or continues when a business condition or business rule is met. |
 |
Link symbol- A sub-process that is part of a larger process. |
 |
Error symbol- A caught error at the start, middle, or end of a process. An event sub-process with an error trigger will always interrupt its containing process. |
 |
Cancel symbol- Reacts on a transaction that was canceled within a sub-process. In an end event, the cancel symbol represents the triggered cancellation of a process. |
 |
Compensation symbol- A refund that’s triggered when operations partially fail. |
 |
Signal symbol- A signal that communicates across different processes. A signal symbol can begin a process, facilitate it, or complete it. |
 |
Multiple symbol- Multiple triggers initiating a process. |
 |
Parallel multiple symbol- A process instance that doesn't start, continue, or end until all possible events have occurred. |
 |
Terminate symbol- Triggers the immediate termination of a process step. All related instances are terminated at the same time. |
Diagramming is quick and easy with Lucidchart. Start a free trial today to start creating and collaborating.
Make a diagramBPMN activity symbols
Activities describe the kind of work being done in a particular process instance. There are four BPMN activity types: tasks, sub-processes, transactions, and call activities.
 |
Task symbol- The most basic level of an activity and cannot be broken down further. For example, a morning routine process might involve the task of turning on your computer. |
 |
Sub-process symbol- Is a group of tasks that fit together particularly well. There are two different views of the sub-process. One is the collapsed view, which has an expandable plus sign to show more details. The other view is an expanded sub-process view, which is large enough to house all the tasks that fully describe the sub-process. |
 |
Transaction symbol- Is a specialized sub-process that involves payment. |
 |
Call symbol- Is a global sub-process that is reused at various points in the business flow. |
BPMN gateway symbols
In a BPMN diagram, gateway symbols that separate and recombine flows. There are several types of gateways:
 |
Exclusive symbol- Evaluates the state of the business process and, based on the condition, breaks the flow into one or more mutually exclusive paths. For example, one report will be written if a supervisor grants approval; no report will be generated if the supervisor withholds approval. |
 |
Event-based symbol- An event-based gateway is similar to an exclusive gateway—both involve one path in the flow. In the case of an event-based gateway, however, you are evaluating which event has occurred, not which condition is being met. For example, you might wait to send an email until the CEO has arrived at the office. If the CEO doesn’t arrive, the email will remain unsent. |
 |
Parallel symbol- Differs from other gateways because it’s not dependent on conditions or events. Instead, parallel gateways are used to represent two concurrent tasks in a business flow. An example is a marketing department generating new sales leads and contacting existing leads at the same time. |
 |
Inclusive symbol- Breaks the process flow into one or more flows. For example, an inclusive gateway could involve business actions taken based on survey results. One process may be triggered if the consumer is satisfied with Product A. Another flow is triggered when the consumer indicates that they are satisfied with product B, and a third process is triggered if they aren't satisfied with A. |
 |
Exclusive event-based symbol- Starts a new process instance with each occurrence of a subsequent event. |
 |
Complex symbol- These gateways are only used for the most complex flows in a business process. An ideal use case for the complex gateway is when you need multiple gateways to describe the business flow. |
 |
Parallel event-based symbol- As the name suggests, this gateway is similar to a parallel gateway. It allows for multiple processes to happen at the same time, but unlike the parallel gateway, processes are event-dependent. |
Connecting objects in a BPMN diagram
Connecting objects are lines that connect BPMN flow objects. There are three different types: sequence flows, message flows, and associations.
 |
Sequence flow symbol- Connects flow objects in proper sequential order. |
 |
Message flow symbol- Represents messages from one process participant to another. |
 |
Association symbol- Shows relationships between artifacts and flow objects. |
Swimlanes in a BPMN diagram
Swimlanes are used to organize aspects of a process in a BPMN diagram. Swimlanes visually group objects into lanes, with each aspect of the process added to a separate lane. These elements can be arranged either horizontally or vertically. Swimlanes not only organize activities into separate categories, they can reveal delays, inefficiencies, and the workers responsible for each step in a process.

Artifacts in a BPMN diagram
Artifacts represent information relevant to the model but not to individual elements within the process. The three artifact types are annotations, groups, and data objects that can be used in a BPMN diagram. All three are used to augment and describe a BPMN process.
Annotations
allow the modeler to describe additional flow parts of the model or notation.Groups
organize tasks or processes that have significance in the overall process.Data objects
represent data placed into the process, data resulting from the process, data that needs to be collected, or data that must be stored.
 |
Data input symbol- Represents data requirements that tasks in the business process depend on. |
 |
Data output symbol- Demonstrates information produced as the result of a business process. |
 |
Data collection symbol- Signifies information collected within a business process. |
 |
Data storage symbol- Represents the ability to store or access data that’s associated with a business process. |
How to make a BPMN diagram online
Now that you have an understanding of the elements that make up a BPMN diagram let’s see how to create one using Lucidchart. We’ve already created templates and BPMN icons to help you get started with the process, feel free to modify them to fit the needs of your diagram. Log in to your account (if you don’t have one, sign up to try Lucidchart for free) and follow the steps below.
1.
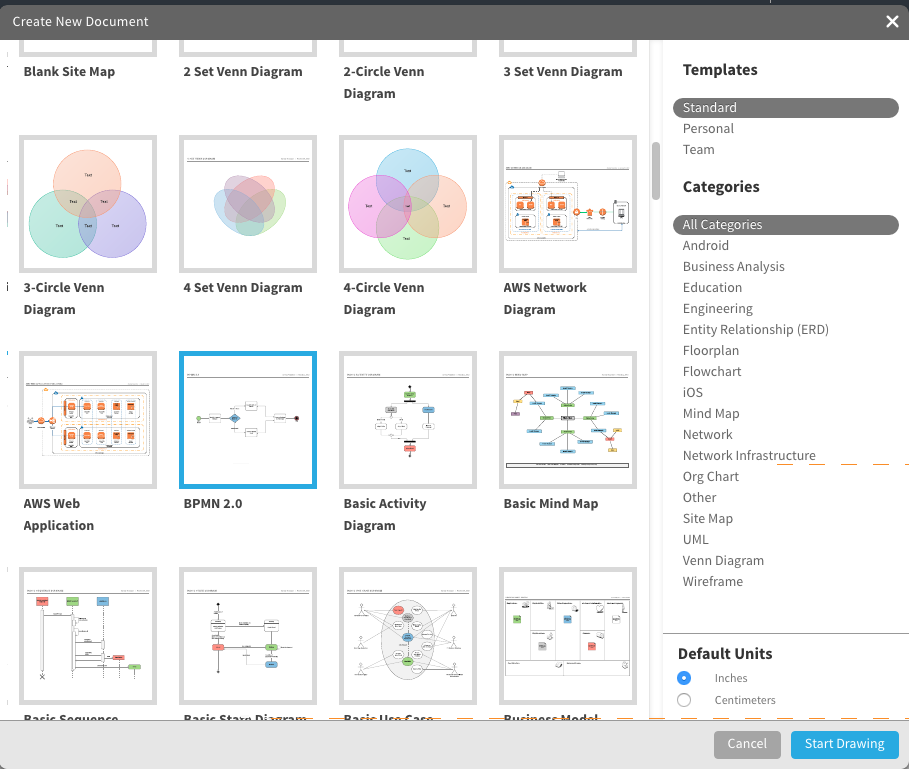
Select a BPMN diagram template
In the Documents section, click on the down arrow in the orange +Document button and double-click on the Blank BPMN 2.0 template.
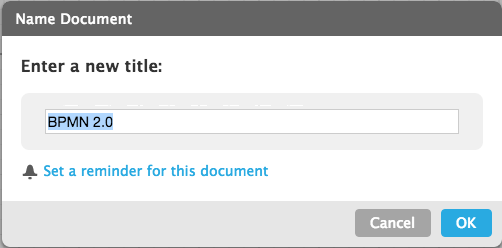
2. Name the BPMN Diagram
Click on the BPMN 2.0 header in the top left corner of the screen. Once the pop-up screen opens, type the name of your diagram in the text box and click OK. The name of your BPMN diagram appears in the top left corner of the screen.
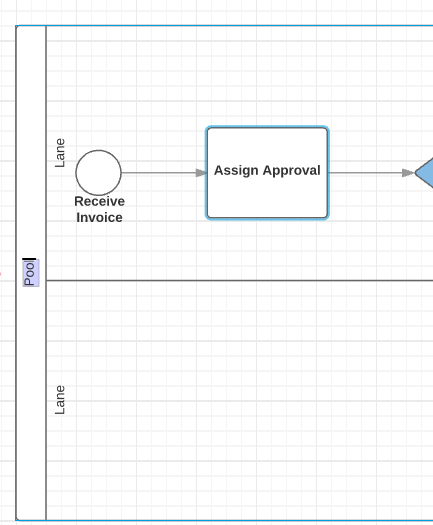
3. Start BPMN process
Our template depicts a payment process. We’re going to modify it to show the BPMN diagram for an incoming invoice. To start the process, you’ll need to create an open circle. Click on the green circle so it’s selected and change the color by clicking the color-fill option in the menu bar and select white.
Tip:
When you click on the circle, you can change it to a non-interrupting event by clicking the Non-Interrupting box in the pop-up window. You can also specify the event type.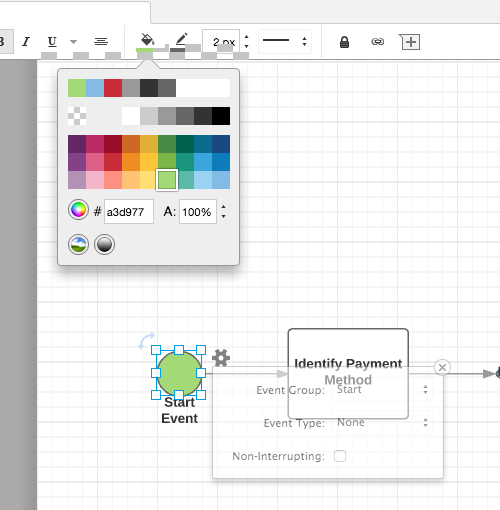
Rename the event by double clicking on Start Event, press the Delete key on your keyboard, and type the new name.
4. Add activities
There are some activities already on the template, but you can customize them. If the activities are where you want just double-click on the text to change it.
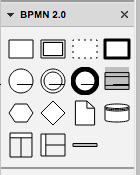
Add more activities by dragging and dropping BPMN icons onto the diagram. In the left column of the screen, you’ll notice a lot of shapes and symbols. We’ve already created the symbols needed to make a BPMN diagram. Scroll to the bottom of the list to the BPMN 2.0 section. These are all the BMPN symbols you need. (Note: hover over each to see what they represent: task, transaction, process, data object, gateway, swimlane/pool).
Tip:
As you place elements on the graph you can customize it even further by selecting what the activity (or task, gateway, etc.) does by choosing an option provided in the pop-up window. You can access this window anytime by clicking on the element and clicking the gear icon in the top right corner.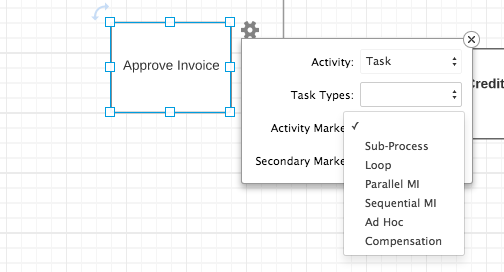
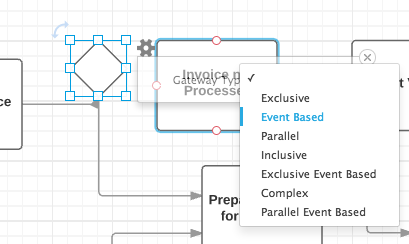
5. Add gateways
There is already a gateway on the template, but if you need to add more select the gateway icon from the set of BPMN 2.0 tools and drag it to where you want it placed on the diagram. Choose the type of event from the drop-down window in the pop-up box. The corresponding icon will appear in the gateway triangle.
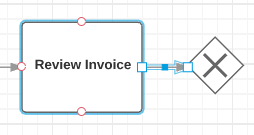
6. Add connecting objects
Double-click on an activity or gateway, and click and hold one of the orange circles and drag the line to the appropriate symbol. An arrow is automatically drawn between the two objects.
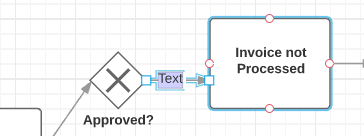
Name the actions of the connecting objects by either clicking directly on the arrow until a text box appears or clicking on the T in the standard box (located at the top of the icon options on the left side of the screen). If opting for the latter option, place your mouse on the graph where you’d like the text to appear, click and a text box appears. Type the text you want.
7. Add pool or swimlane
Perhaps one group in your organization completes certain actions on the BPMN diagram, and another department accomplishes other activities. Make this evident on the diagram by adding a pool/swimlane.
Select the pool icon from the set of BPMN 2.0 tools and drag it to where you want it placed on the diagram. Select the type of event from the drop-down window in the pop-up box. The corresponding icon will appear in the gateway triangle. Double-click on the text Pool and Lane to change the content.
Tip:
You can adjust the amount of swimlanes that appear as well as orientation by clicking the gear icon in the top right corner of the pool.You’ll likely need to realign the events so that they fall in the appropriate swimlane. To move multiple items, click the first item, hold the shift key and click any additional items you want to move and drag them to the appropriate lane. The connecting objects will realign themselves automatically.
8. Customize the BPMN diagram with colors and fonts
Once you have the basic design of your diagram, you can add colors to symbols, and change fonts. Here’s how to:
Add colors to elements:
Click on an element on the diagram and then click the color-fill icon on the menu bar and choose a color.Tip:
To make multiple elements the same color, click the first item and then hold the shift key and click the remaining shapes. Next, click the color-fill icon and choose a color.
Change the font:
Choose Select All from the Edit option in the menu. Click the font box, choose a new font, and click it. All text in the diagram will be updated. You can use the other shortcuts (font color, size, bold, italic, underline, and alignment) to customize the font even more.
9. Share your BPMN
diagram
The title you created at the beginning of this exercise will appear at the top of the diagram. Once you like the way the BPMN diagram looks, you can share it with others either via email, link, social media (Facebook, Twitter, Google+, and LinkedIn), or embed it on a website. Click the blue Share button in the top right corner of the screen and a pop-up will appear. Choose how you’d like to share the diagram and enter the appropriate information.
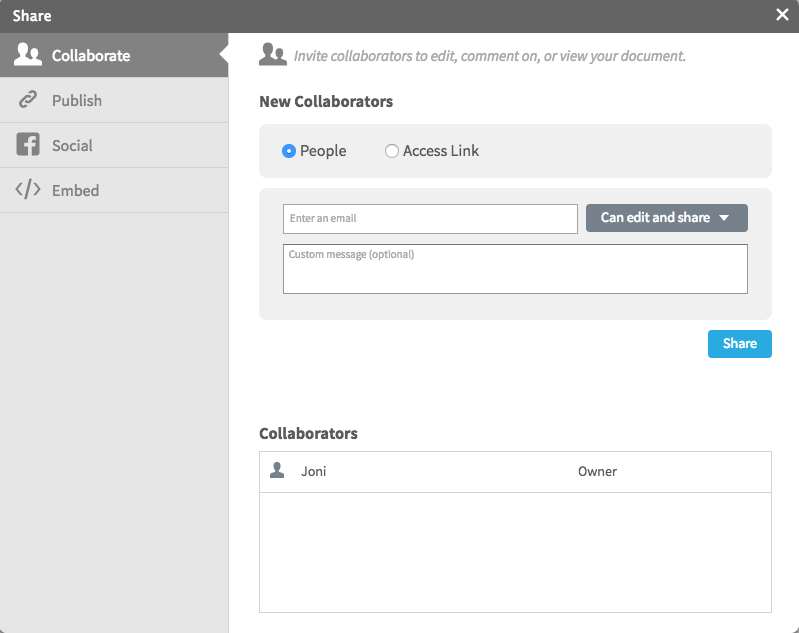
When you add a collaborator by sending a link to the BPMN diagram via email, you can work on the diagram simultaneously and use the chat feature (the yellow quote icon in the top right corner of the screen) to have discussions.
BPMN Templates and Examples
New Customer Process
This template diagrams a customer's possible journey from initial engagement through set-up and retention.

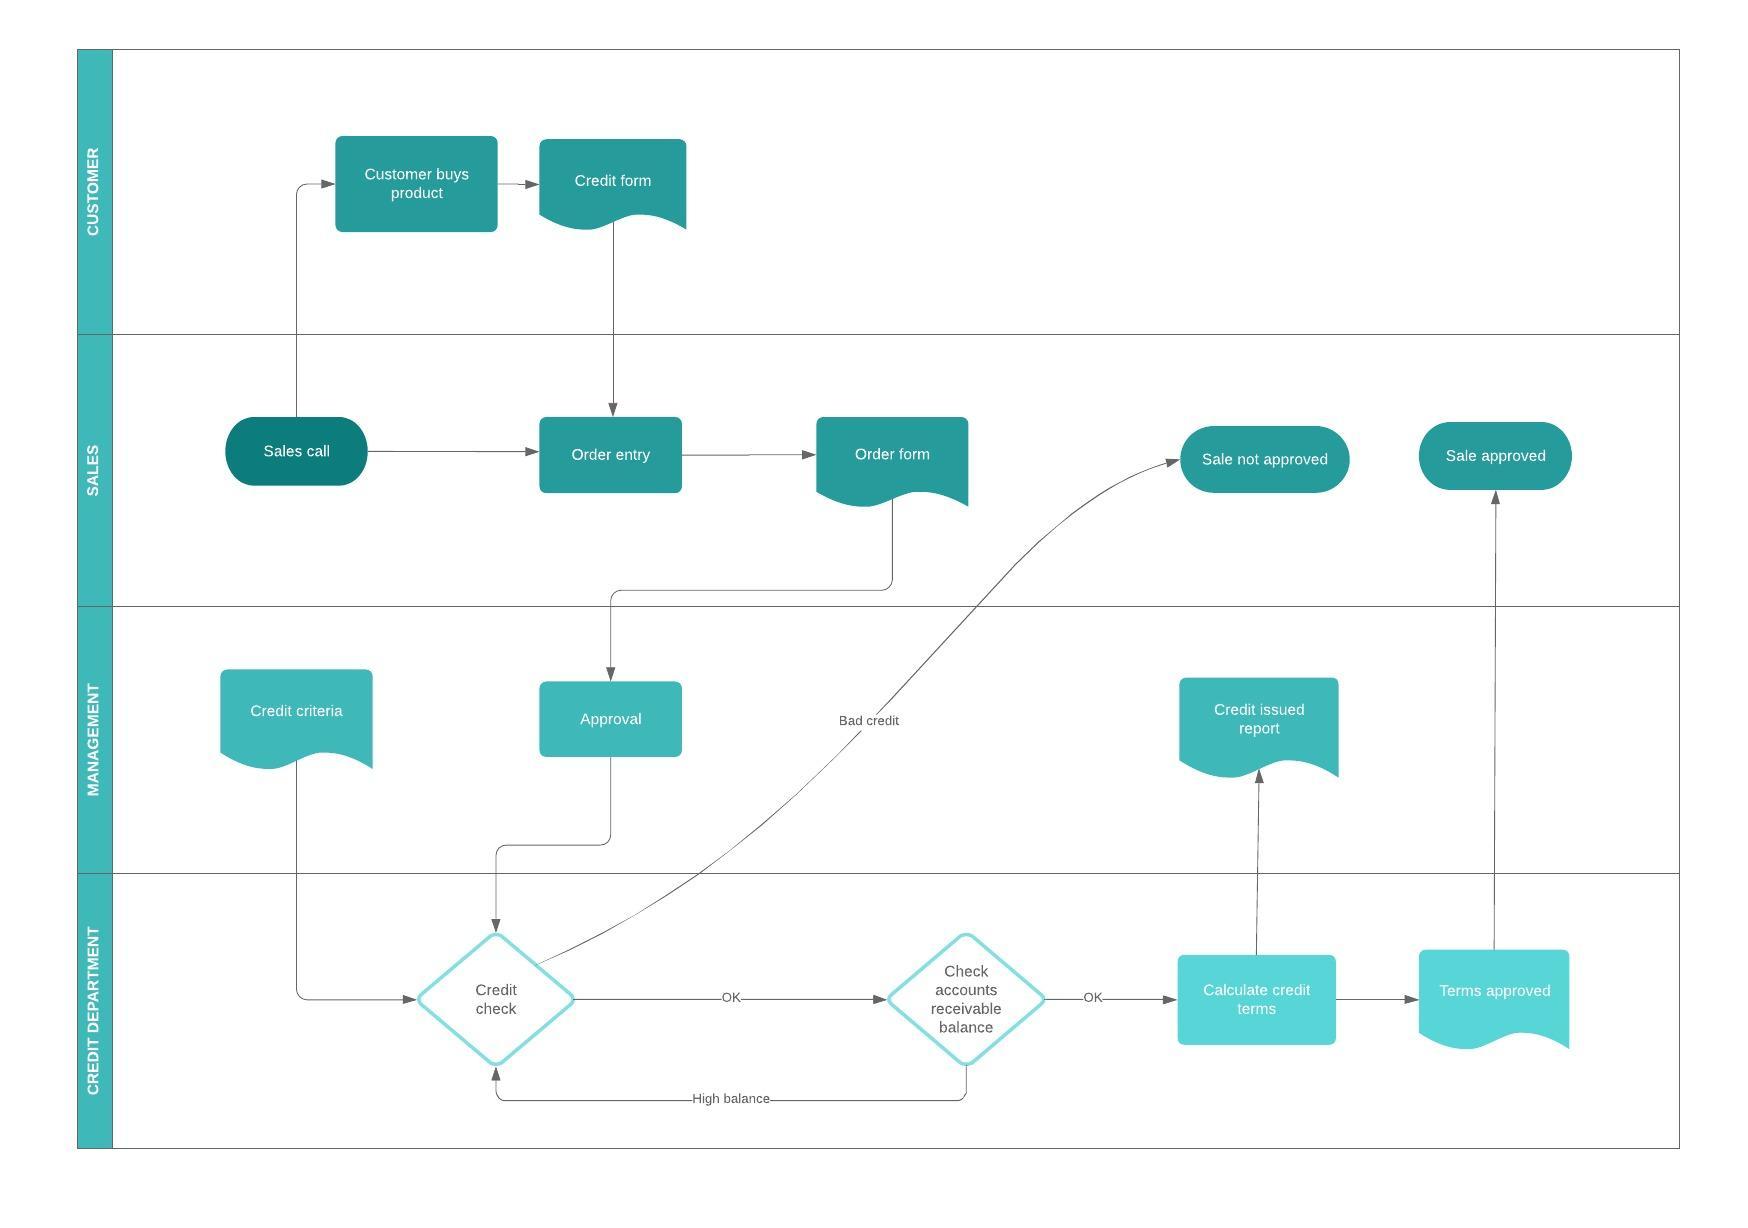
Business Process Flow Template
Use this template to visually diagram a business process flow. Customize the swimlanes to further segment stages of the process.
Workflow Template
Workflow diagrams provide an overview of a business process.They show each step from start to finish using standardized symbols and shapes. Workflows also help define roles within an organization and enhance communication between different departments.
