Data flow diagram (DFD): Level 2
This level two data flow diagram (DFD) template can map out information flow, visualize an entire system, and be shared with your stakeholders. Try it free today!
What is the Data flow diagram (DFD): Level 2 template?
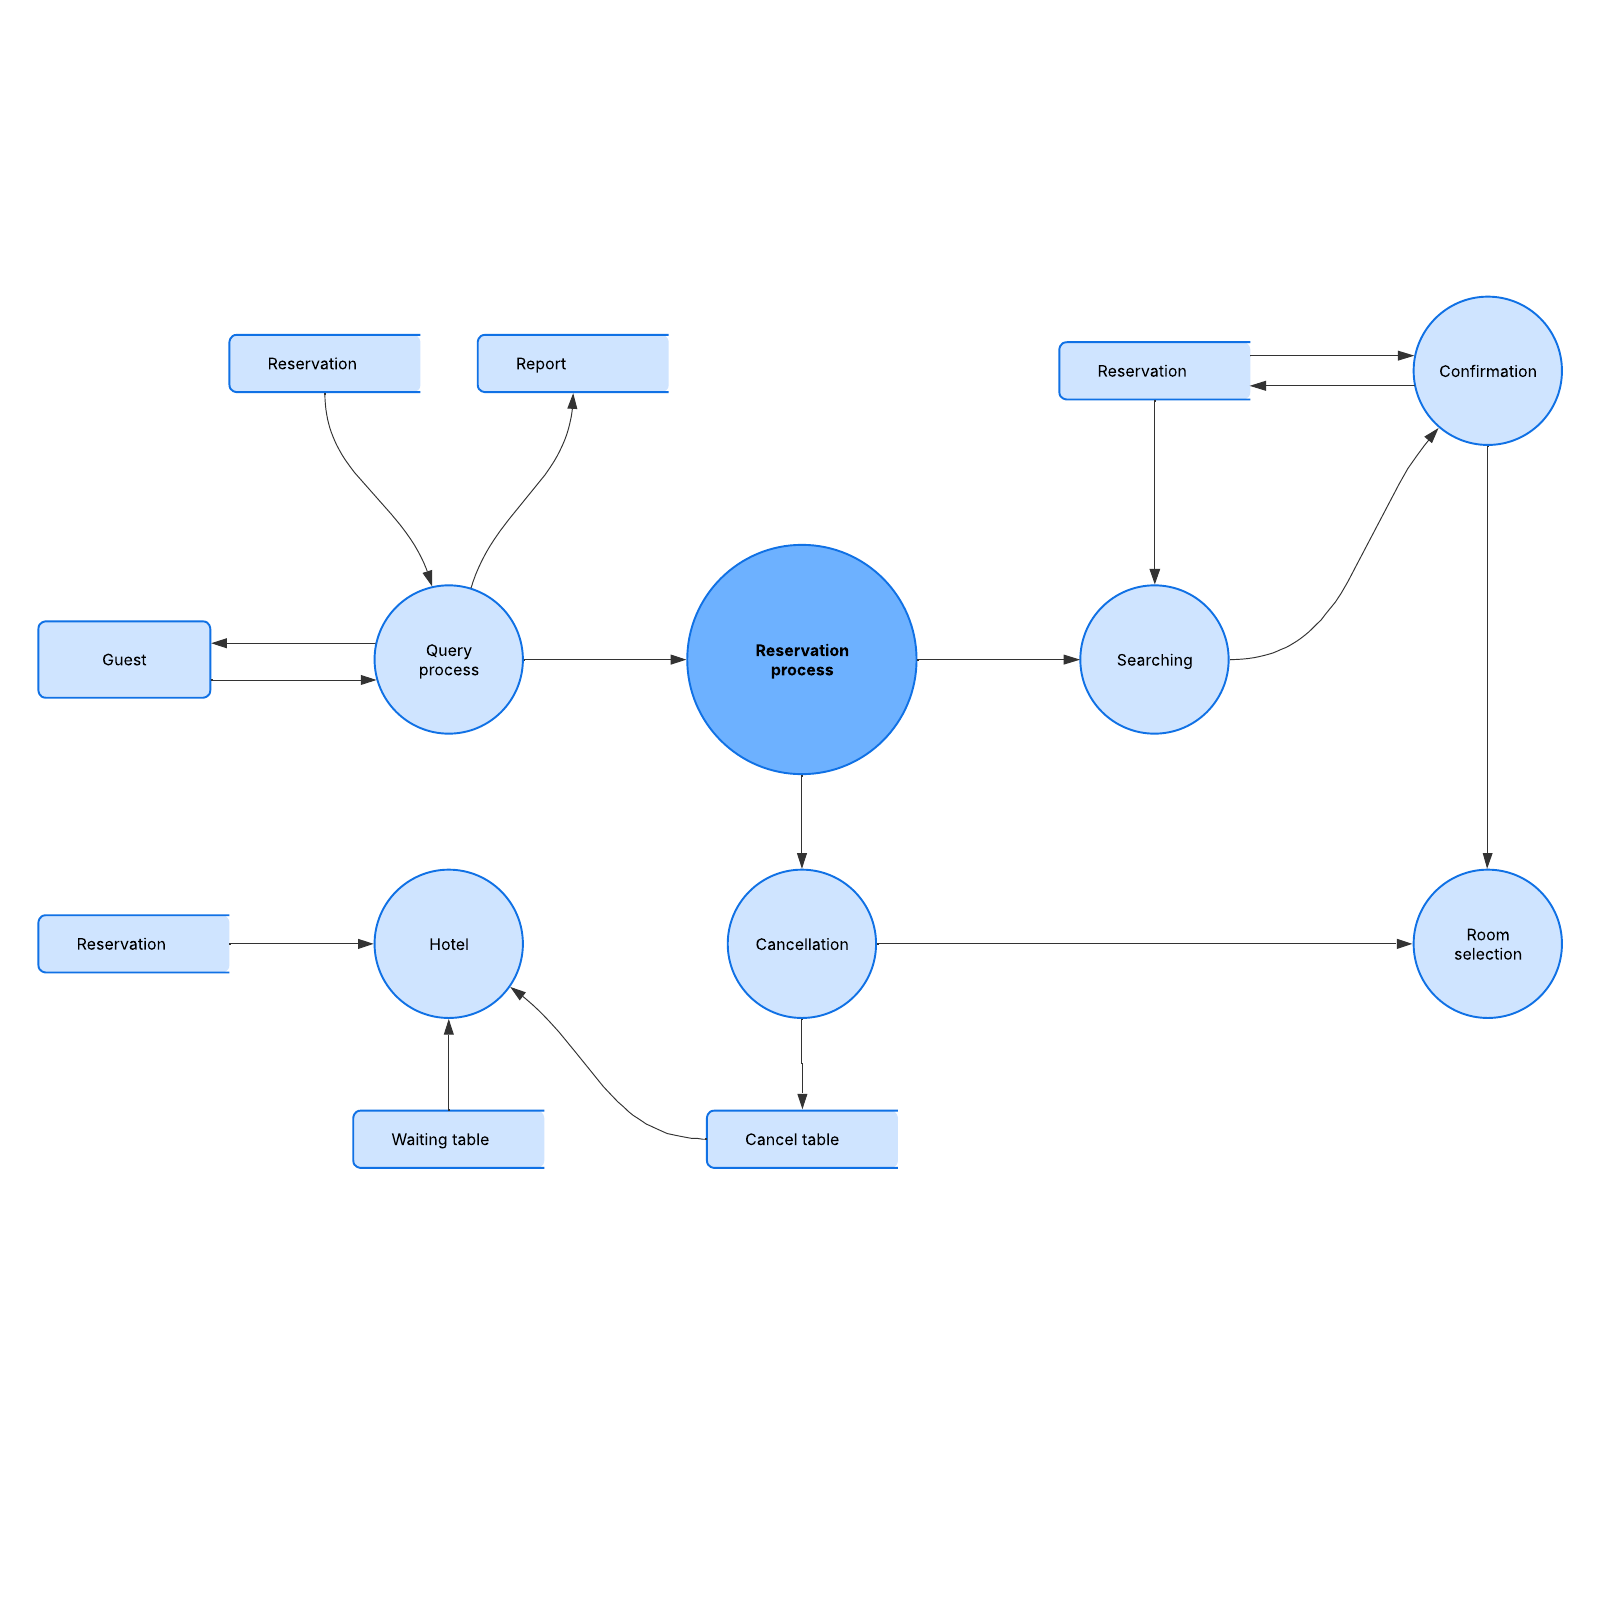
Data flow diagrams, or DFDs, map out how information flows through a process or system. These diagrams use symbols like rectangles, circles, and arrows, which are labeled to show data inputs and outputs, storage points, and where the information goes in between each point.
Data flow diagrams vary in how complex they are, and we describe their depth with a label of 0, 1, 2, or 3 and beyond, though most do not go beyond level 3. This diagram template is consequently moderately complicated.
Benefits of using the Data flow diagram (DFD): Level 2 template
When you use this data flow diagram template, you can take a very complex system and make it simple to understand. You’ll be able to visualize it in its entirety, which helps you identify and mitigate issues before they become significant problems. You’ll also be able to find opportunities for improvement.
This template is flexible and easy to customize. Use it to analyze or model various types of systems in different fields, including software engineering, business analysis, agile development, and system structures.
Then, share the template with just one click. Get feedback or buy-in from stakeholders, so that everyone is aligned.
How to use the Data flow diagram (DFD): Level 2 template in Lucidchart
If you’re importing data from another source, click on “Import Data” on the bottom left of the screen. You can also edit the template directly.
To format a shape, click on it, then click “Shape Options.” Choose the line or fill colors. If you hover over the shape or click on any red circle, you can add a line to connect it to another shape.
Edit the text next to the lines by double-clicking it. Or, double-click anywhere on the line and start typing to add text. Find more options for line formatting in the Properties bar at the top of the canvas.
If you’d like to learn more about DFDs and how to create them in Lucidchart, click the buttons on the right side of the document to access helpful tutorials.


