Functional decomposition example
This functional decomposition example template can help you:
- Break down large, complex processes and functions into simpler components.
- Help individuals such as stakeholders understand processes better.
- Decrease the amount of mistakes made through increased recognition of requirements.
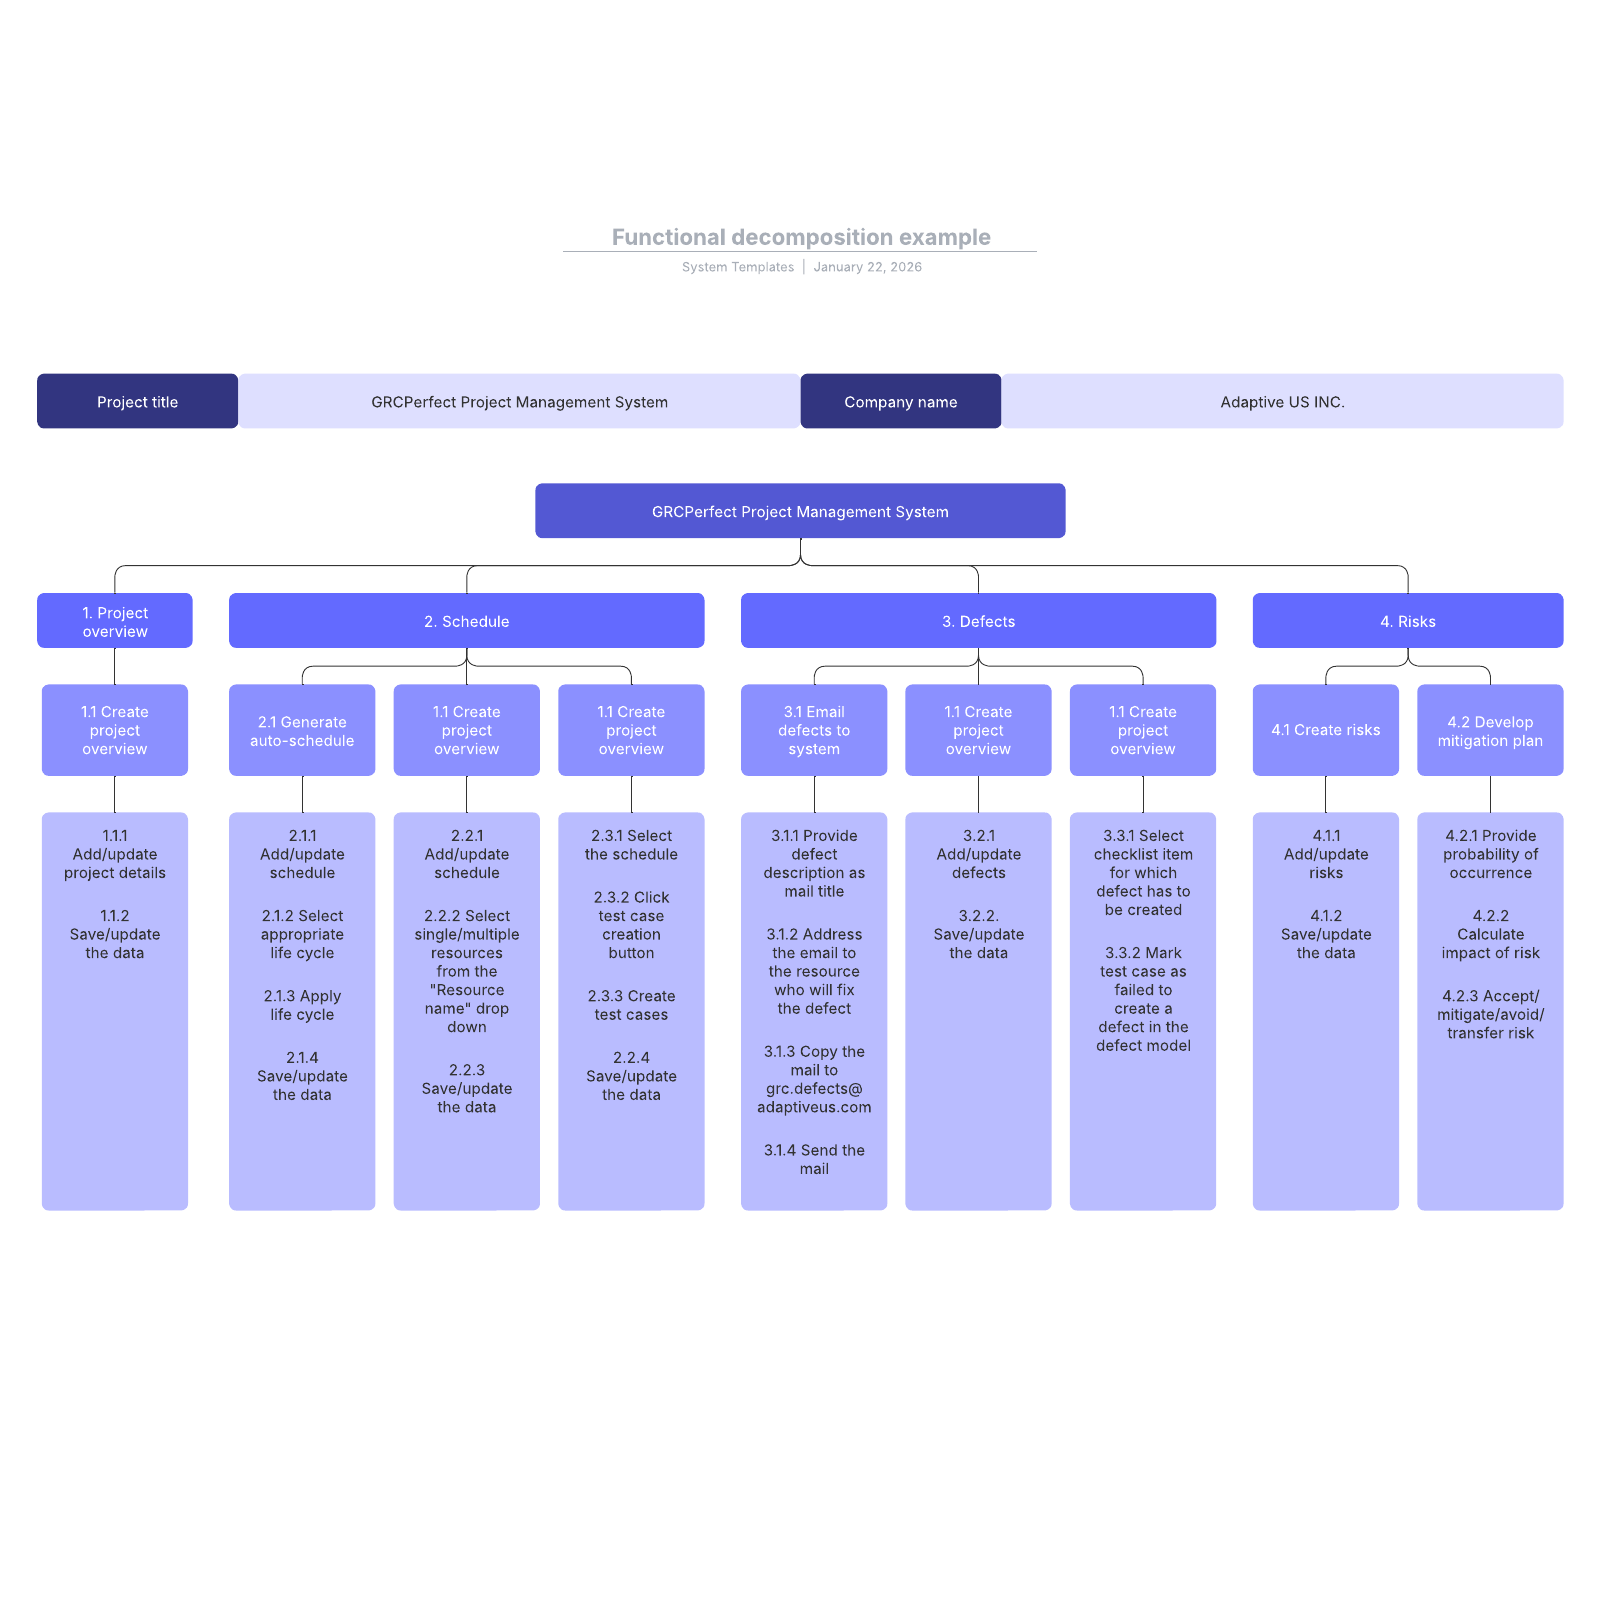
Open this template to view a detailed example of a functional decomposition diagram that you can customize to your use case.
What is the Functional decomposition example template?
Functional decomposition sounds like it describes the process of composting, but it’s actually a useful process for understanding things that are otherwise overwhelming. For instance, if you were to try and wrap your head around how modern airports work from flight paths to ticketing, there would simply be too much to understand at once. But by breaking down air travel into its smaller components, it’s easier to grasp. Functional decomposition templates help you break down any large, complex processes and functions into simpler components that are much simpler to learn. This template contains both an example of a finished template and a link to start your own functional decomposition diagram.
Benefits of using the Functional decomposition example template
- Simplify the complex: Anything can be simplified, from air travel to software. This template can help with essentially any use case, from wedding planning to freeway systems.
- Help stakeholders better understand processes better: Introduce foreign concepts in an accessible way.
- Increase accuracy: Once your team understands how individual components play into a larger system, it’s much easier to understand why the requirements exist.
- Easily share: Decrease redundancy while training and align every team.
How to use the Functional decomposition example template in Lucidchart
- Once you’ve studied the example, click on the blue button to the right of the document to create your own diagram.
- To customize, click on a shape and type the information you want to include. Add and arrange shapes as needed.
- Turn on auto tiling in the page settings tab to allow the canvas to automatically adjust.
- For extra help (and inspiration), view Lucidchart tutorials through the button to the right of the document.


