Hospital ER diagram example
A hospital er diagram template helps illustrate the data flow involved in a patient's visit. Adapt this template to your medical practice. Sign up for free!
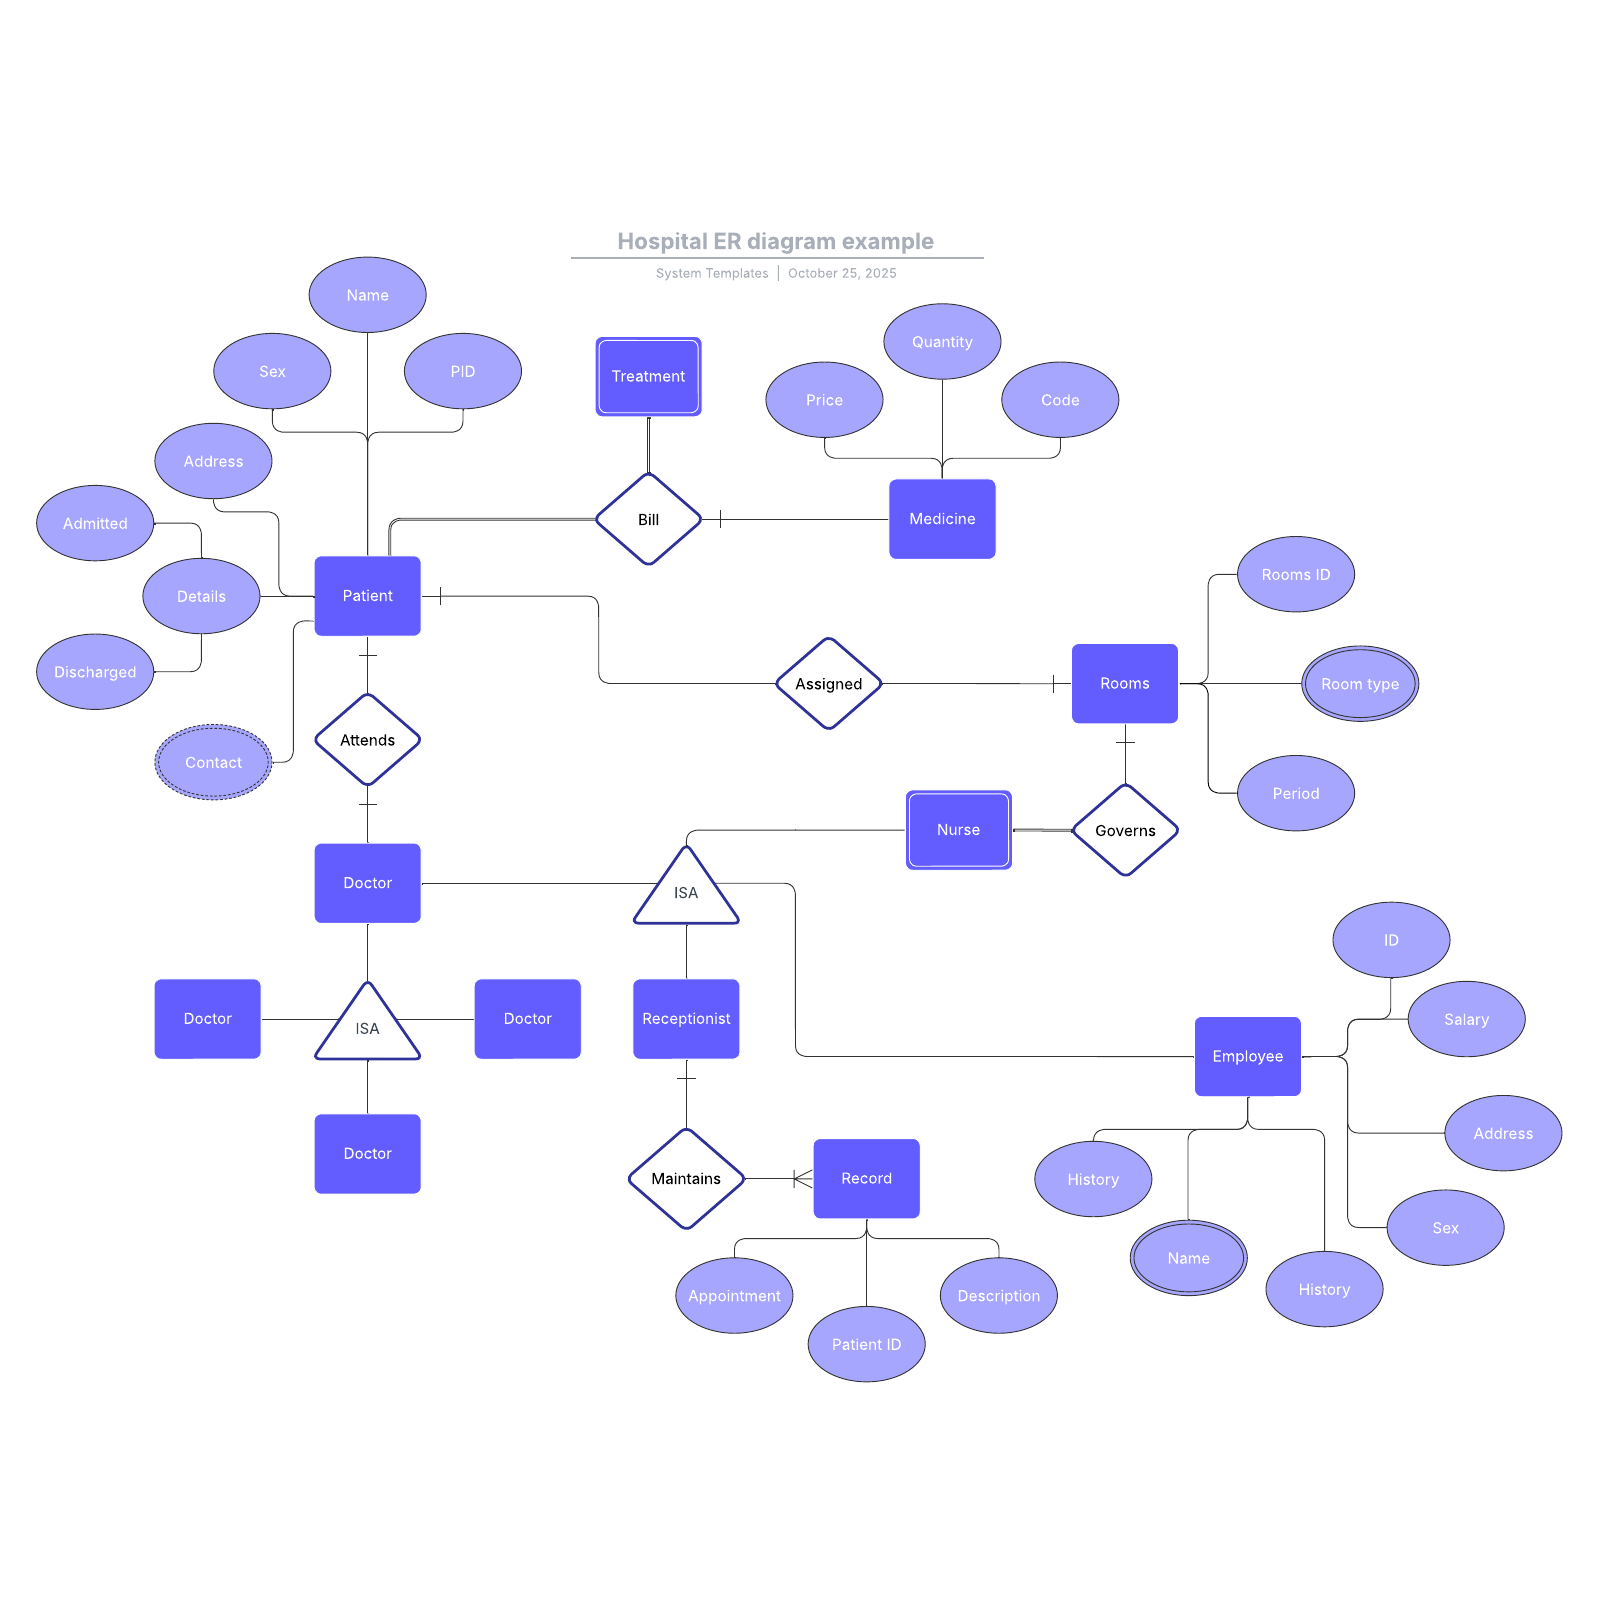
What is the hospital ER diagram example template?
A hospital ER (entity relationship) diagram is a flowchart illustrating how “entities” relate to each other within a system. It’s important to note that when we say "ER" in this template, we’re discussing an entity relationship—not an emergency room.
This template is an example of illustrating the data flow involved in a patient’s visit so you can study it and make your own. This is especially important given the sensitivity of data in the healthcare field.
Benefits of using the hospital ER diagram example template
- Illustrate the data flow involved in a patient’s visit: Efficiently map out processes to identify gaps or issues and improve the speed of care. Identify opportunities for improvement across the entire process.
- Align your team so everyone knows best practices and processes: Use for training or onboarding so that all team members can understand data handling and entity relationships at a glance.
- Customize based on your needs: Private practice? No problem. Vet clinic? We’ve got you. Easily customize to any use case.
- Share with others to boost collaboration: It’s difficult to get all stakeholders in the same room at the same time. Instead, share with a single click and receive feedback in real time.
How to use the hospital ER diagram example template in Lucidchart
Follow these instructions to use the ER diagram template.
- Study the template and customize it by adding text to a shape. Easily add shapes on the canvas or delete them by selecting and pressing "delete."
- Format shapes as you’d like by clicking on the properties bar at the top of the canvas. Hover over a shape and click on any red circle to add lines.
- Format lines by clicking on a line and then changing the color, style, width, option, and endpoints using the properties bar.
- Turn on auto-tiling in the "Page Settings" tab to allow the canvas to automatically adjust.
- Click on the button to the right of the document to access more tutorials.


