
Okta
Okta relies on Lucidchart to create visuals that convey product value and build trust with customers. They have found these visuals to be invaluable throughout the sales cycle.
Contact salesKey benefits
- DEMONSTRATE VALUE
- Okta creates diagrams that show customers exactly how Okta works, building trust with transparency. While on the phone, sales reps can then pull up a template and customize it based on the technical information the customer provides.
- TRAIN
- Okta uses architecture and sequence diagrams to show both new and veteran reps how to solve customers' business challenges with Okta solutions. Technical architects keep diagrams up to date so that reps can easily reference them in the centralized Lucidchart library.
- IMPLEMENT
- Sales architects create very detailed post-sale diagrams for each customer that technical consultants then reference to achieve a smooth implementation.
SIZE: Medium (101-2,500 employees)
Okta is the leading independent identity provider for the enterprise. The Okta Identity Cloud connects and protects employees and connects enterprises to their partners, suppliers, and customers. Okta enables simple and secure access from any device.

Customers need to feel confident. We heard this over and over again while talking to employees at Okta, which provides identity management to connect any person to any technology. Okta is part of a very complex and sophisticated aspect of the IT industry: security. As a player in this industry, the company is well aware that they cannot succeed unless customers have complete confidence in the solution they provide.
But that kind of trust is something you have to build up to. Dan Marma, sales architect at Okta, compares the process to dating—customers are scoping you out, trying to determine if you really know what you’re doing and if you can really meet their needs.
Obviously Okta has this whole “dating” thing down pretty well, with thousands of satisfied customers and a recent successful IPO.
Their secret to success? Working visually.
Their secret to crafting visuals? Lucidchart's intelligent diagramming capabilities.
Sometimes, it doesn’t matter how many times a sales rep explains how Okta’s solution will work for a customer. Sometimes the only way to gain trust and help customers actually understand the complexities of how Okta can fit into their existing architecture is to show rather than tell. Visuals cut through “marketing fluff”—they’re proof that Okta will solve a need.
Dan describes:
“The Lucidchart diagrams inspire confidence with the customer so they can say, ‘Hey, these guys have done this before. These diagrams look good. They make sense. They’re readable. What we’re doing is no longer this confusing thing.’ Remove that element of confusion, and people feel better about their decision."
Okta has a template library that is famous here at Lucid. With hundreds of templates available for anyone to reference and customize, it’s a one-stop shop for employees, whether it be for the internal education, customer-facing presentations, or solution implementation that are all key to building relationships and trust with Okta customers. And the readily available templates allow employees to spend more time implementing successful solutions for customers and less time manually diagramming.

Learning the value
Eric Karlinsky is on the technical marketing team within the product organization at Okta. He’s the mastermind behind many of the beautiful diagrams in Okta’s library. These visuals are used for external purposes, such as technical case studies, but a lot of the assets are initially created for internal use and education—sales reps can’t instill trust in customers if they don’t have a complete understanding of the needs Okta solves themselves.
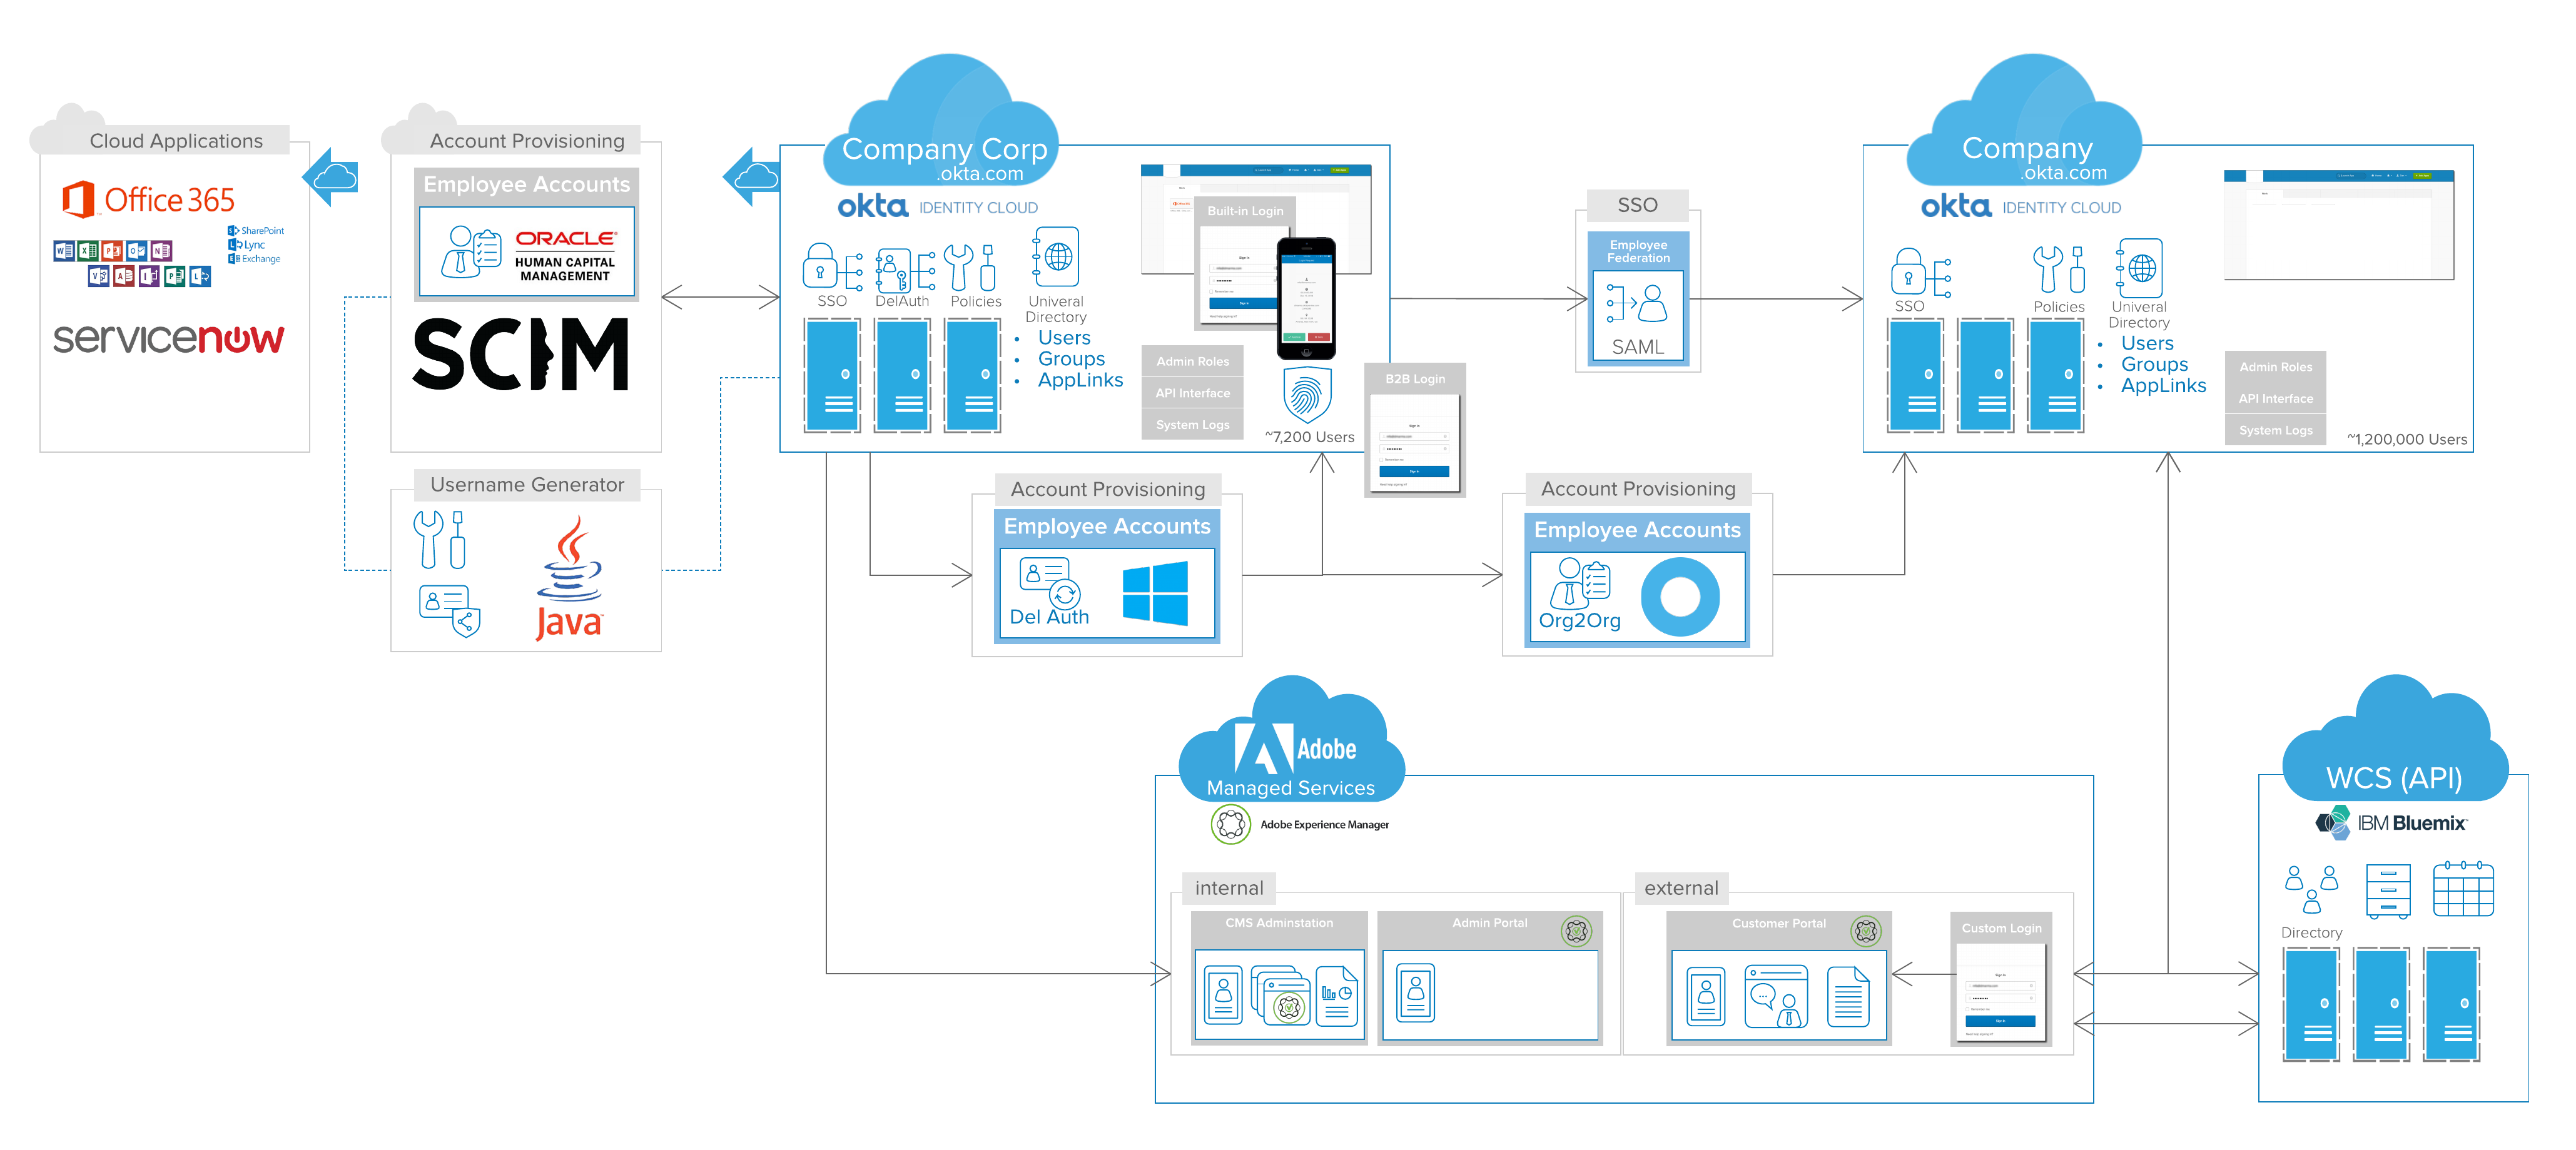
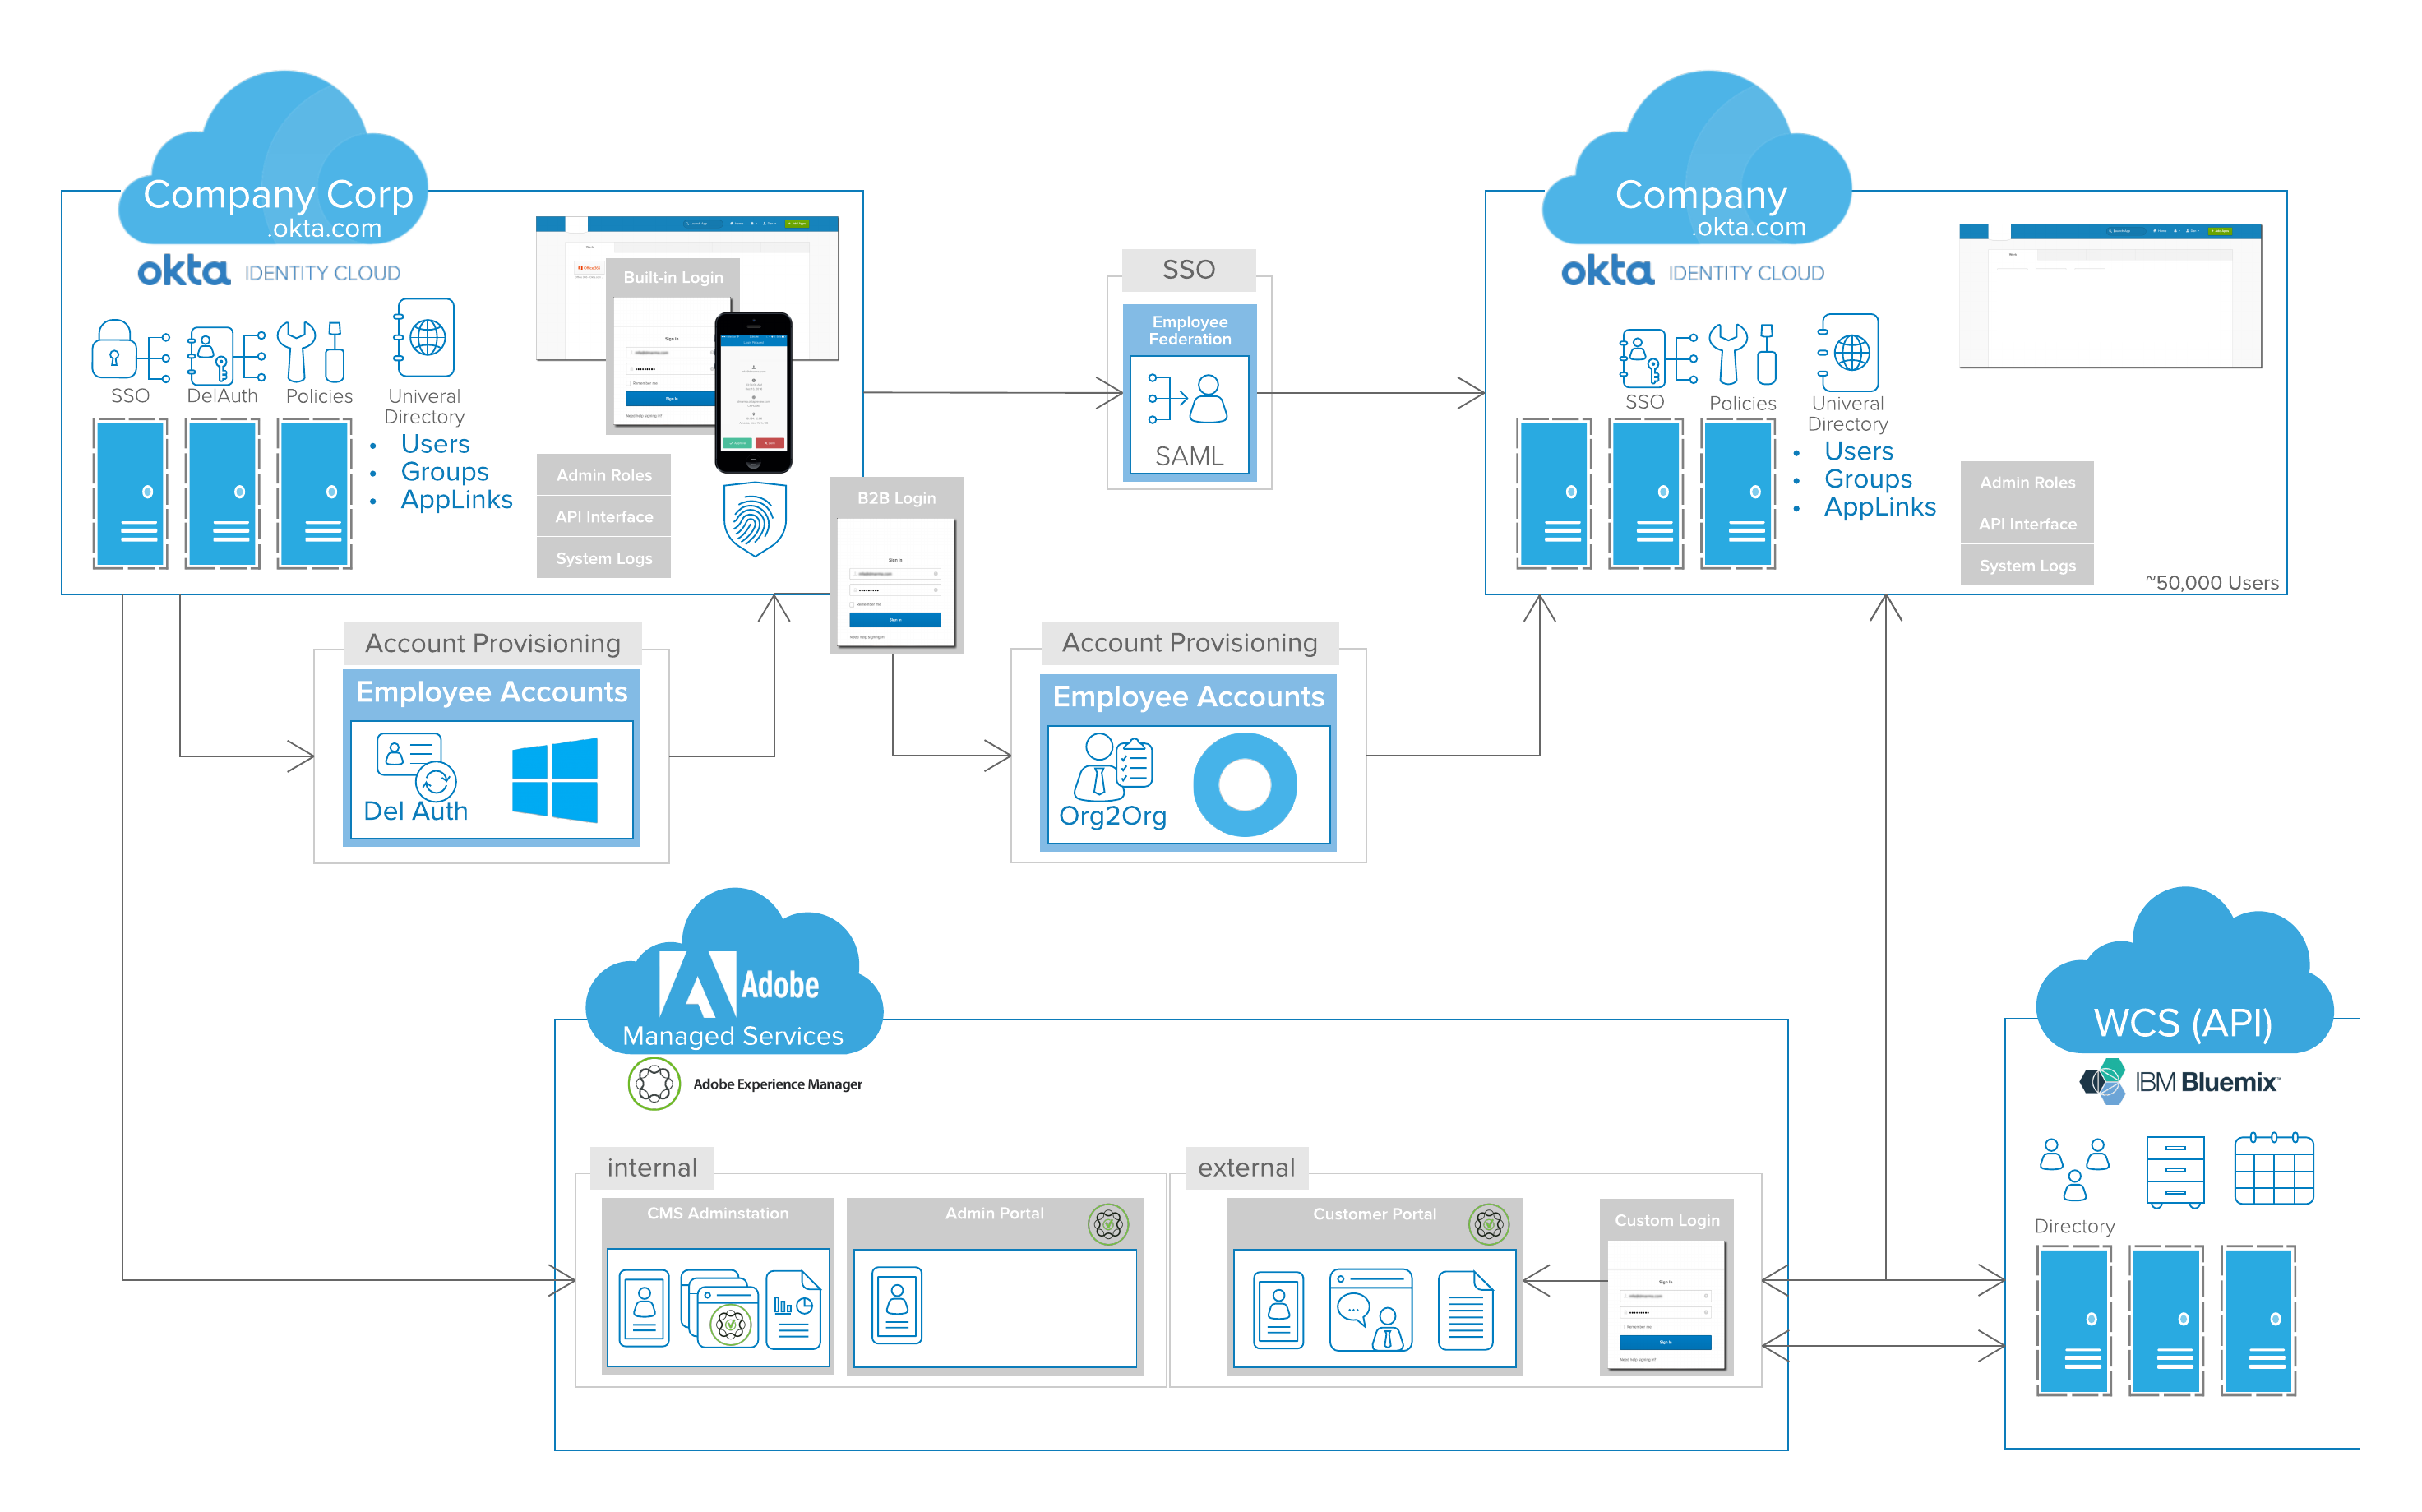
Okta focuses on providing solutions, working to address a specific set of problems they know customers face. To enable sales reps to speak to these business challenges, Eric and his team rely on Lucidchart to craft professional architecture and sequence diagrams that illustrate the solutions Okta offers and break down the complexity involved. For example, Eric can create a sequence diagram illustrating the multi-factor authentication feature and how the different components interact. Using Lucidchart’s UML sequence markup feature, Eric is able to build these sequence diagrams even more efficiently and avoid the tedious nature of manual diagramming. For companies transitioning to cloud technology, Eric builds architecture diagrams showing how Okta integrates with existing architecture to support this transition.

Anytime a new feature is released, Eric’s team is proactive about creating diagrams to educate employees on how the feature works and which customer needs it addresses.
These visuals are all added to the company template library, but they are also exported and added to PowerPoint presentations that include messaging, statistics, and case studies around specific business challenges. These presentations are then distributed to reps to train them on speaking to these pain points. After using them for their own education, reps customize the presentation for specific customers. The visuals help customers quickly gain insight into how Okta will work with their existing applications.
The Okta team continually adds to its arsenal of templates, trying to ensure reps always have a relevant use case to draw from. Consequently, it’s essential that Eric can build these diagrams quickly, regardless of the level of complexity, but still have them look polished and professional. That’s why he prefers Lucidchart over other diagramming applications.

“Lucidchart enables me to quickly create tough diagrams. It’s really intuitive, and I can do it quickly. But it’s not going to come out ugly,” Eric says. “At a previous job, I used Visio. I had to spend a ton of time on my diagrams. I’d build up the diagram then have to go back through it and reorganize and reconnect everything, just so it didn’t look like a bowl of spaghetti. With Lucidchart, I spend half the time and get a far better result.”
Closing the deal
Once reps have a firm understanding of how Okta provides value, they have to be able to translate that to customers. Phil Carolan, Regional Director of Professional Services, says one challenge the company faces is being able to accurately communicate information to customers (due to the complex nature of Okta’s solutions). While they could talk about these solutions for hours or compose dry novels to send to customers, neither are very effective methods. It’s visuals that can be the difference between deal and no deal.
Dan explains:
“I find that when we're talking to different people, when I am able to use a diagram to show how the Okta Identity Cloud would work for their particular use case, it starts to click so much better than me just trying to articulate on the phone. Because words are very dry and are open to too much interpretation."
Okta’s template library is essential during these customer interactions. As soon as Dan starts talking to a customer about their existing architecture, he also starts crafting a diagram. He doesn’t have to start from scratch—he simply finds a relevant template and customizes it according to the technical information the customer provides. That way, he can have an up-to-date diagram finished by the time the customer finishes talking.
The diagram acts as a virtual whiteboard—Dan and the customer can walk through the diagram in real time to ensure its accuracy without having to send versions back and forth.
“I use Lucidchart whenever words don't paint the picture, from architecture design to network topology to timelines,” he says. Dan creates wireframes to demonstrate how a third-party implementation will work. He builds a customer journey map to illustrate the end user experience. He builds timelines to set milestones for a requested launch date.

And he can deliver the diagrams in exactly the format customers prefer. He simply exports his diagrams as PNGs and adds them to existing Word or PowerPoint documentation.
Eric describes the difference these visuals can make in the sales process:
“Adding Lucidchart diagrams just gives our customers more confidence. A PowerPoint is often just perceived as marketing. So if you have something that looks like an official architecture diagram, it’s more authentic.”
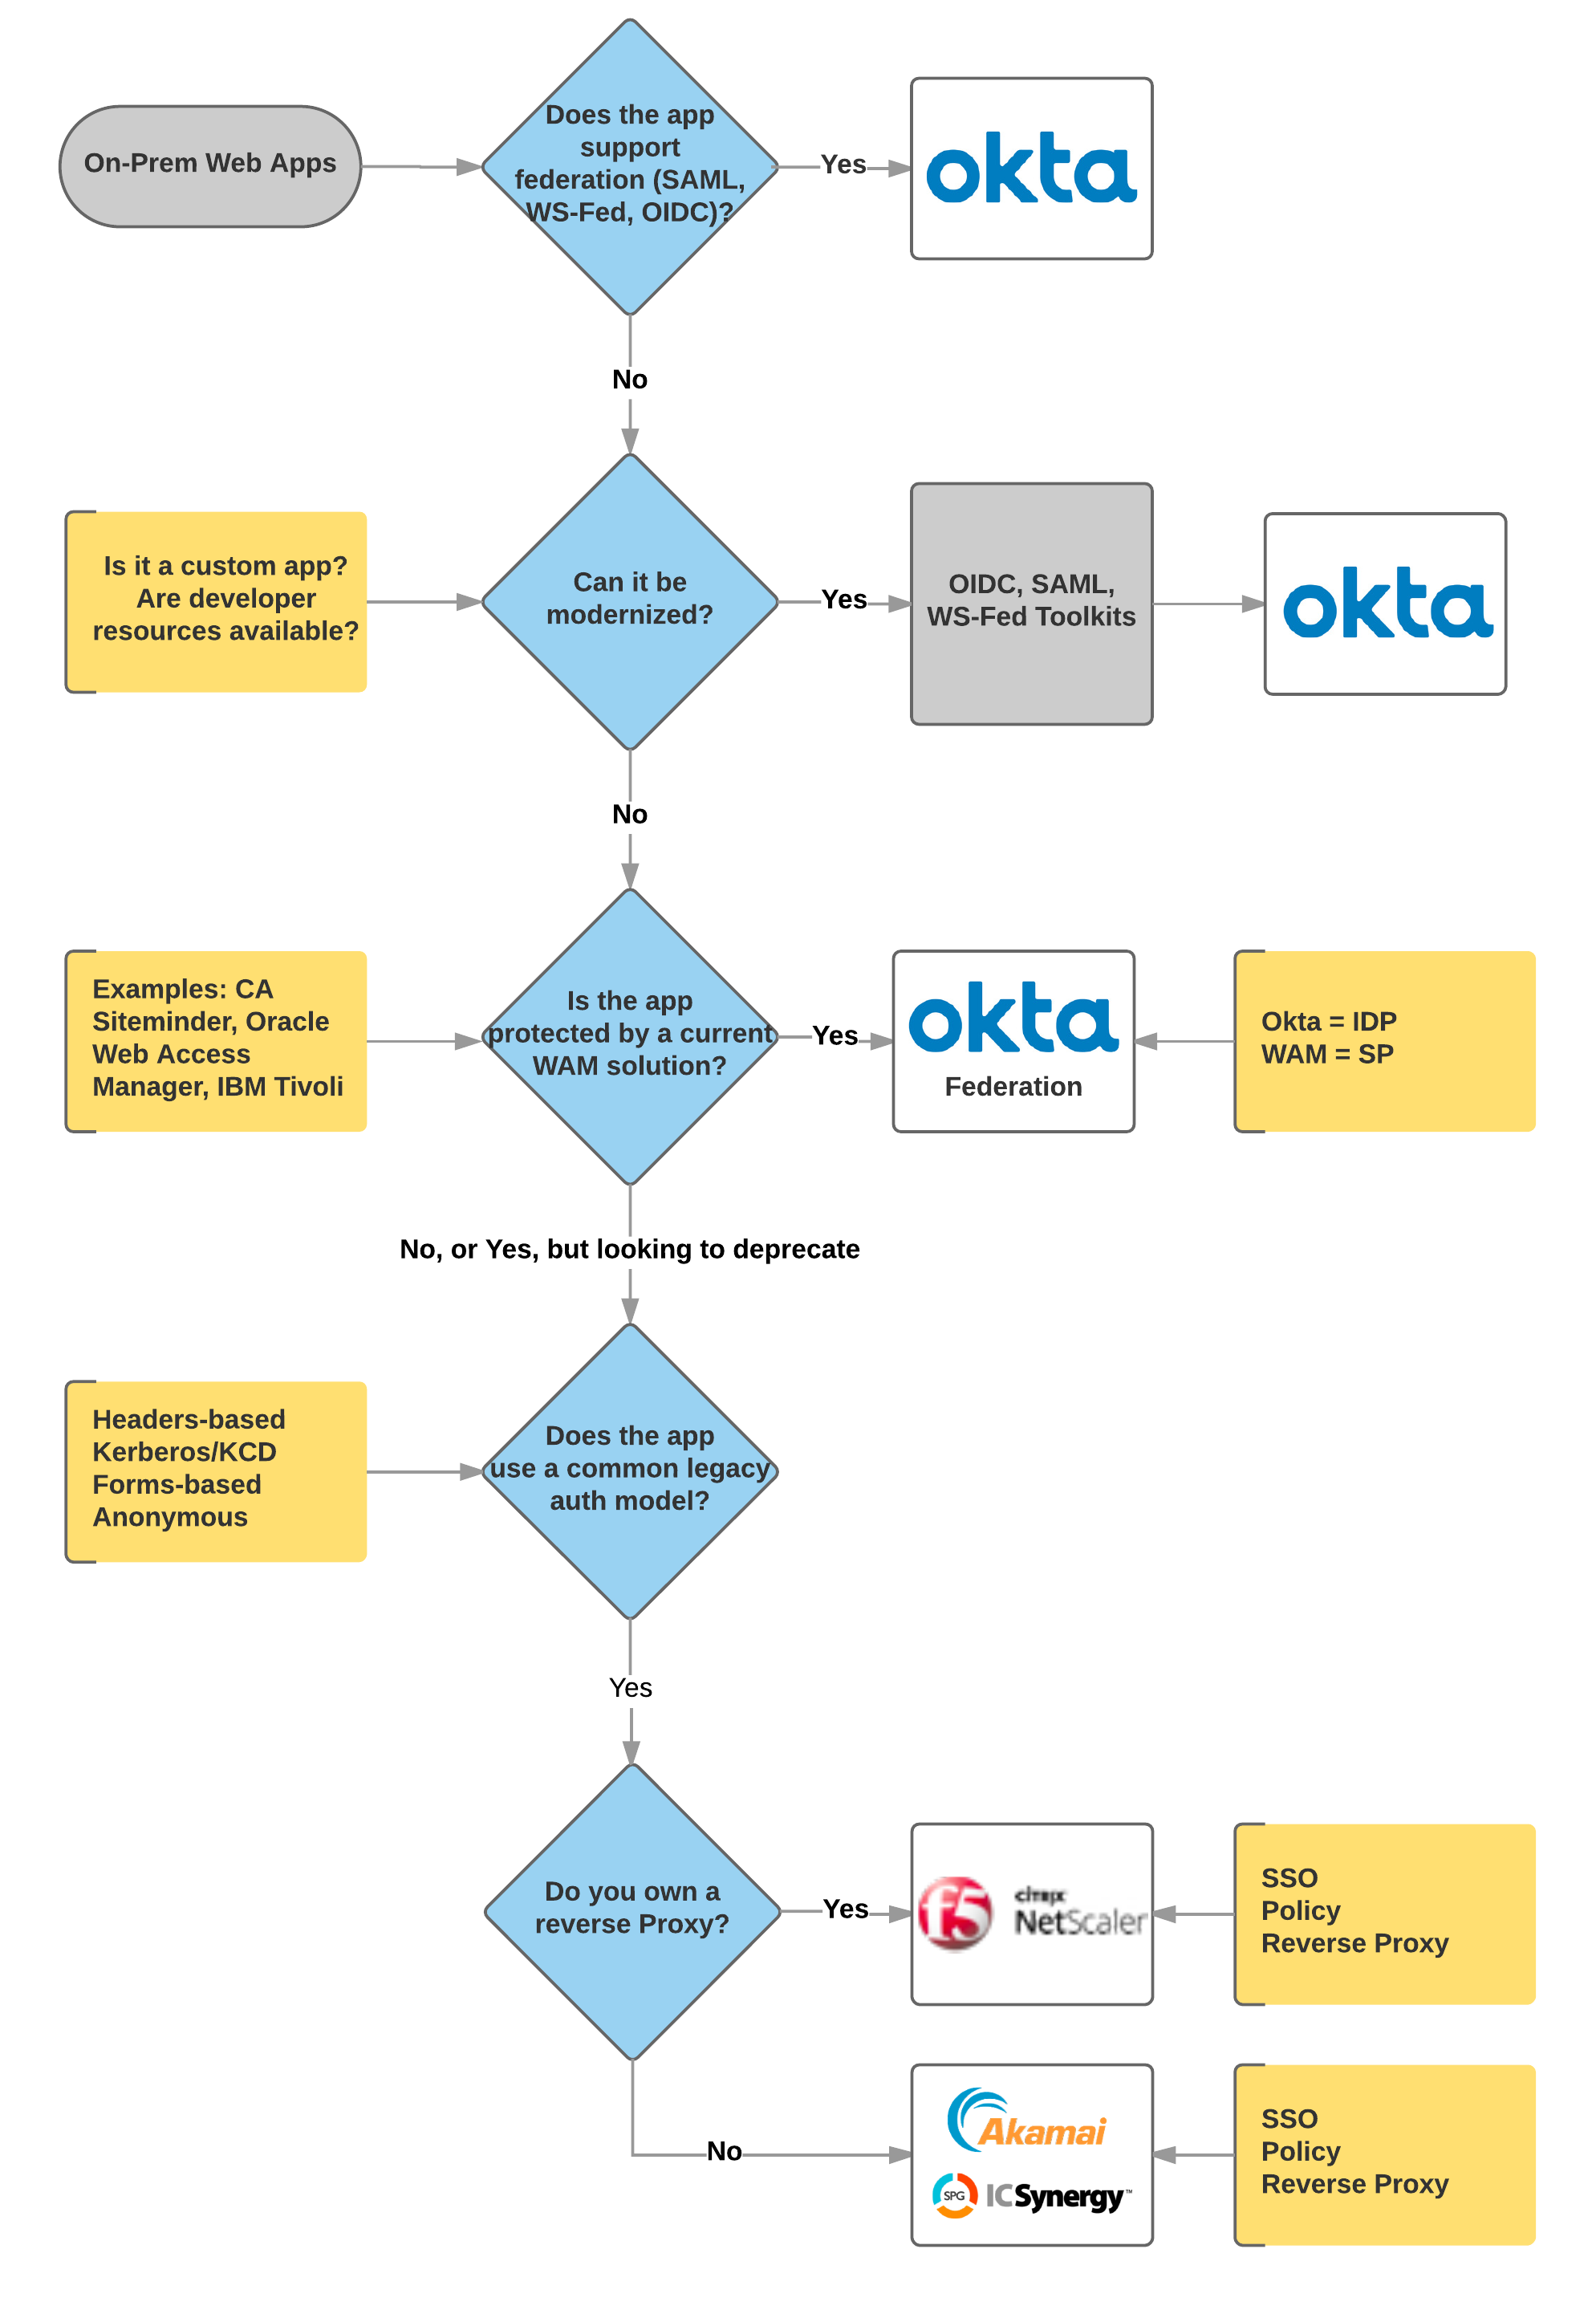
Every time someone makes a new diagram for a customer, the team scrapes the diagram and converts it into a template to add to the ever-growing library. Eric has even built a decision tree in Lucidchart to help reps determine if a lead is qualified and, if it is, which diagram would be best to present in that use case. Being able to refer to the decision tree helps reps feel confident while talking to customers.
It’s also crucial that everyone be able to access this technical information. “We were looking for ways to improve the collaboration and sharing of technical material,” Phil recalls. “Lucidchart enabled us to create shared customer folders that we could share amongst the consulting groups so we could leverage each other’s work. It also allowed us to create templates to share, which are accessible by other consultants and allow them to more quickly create an output.”
Lucidchart also helps these diagrams stay on brand and high quality across all of the consultants and architects producing these visuals. Okta even has an enterprise-wide shape library of Okta-specific shapes which the marketing team owns and keeps up to date.
Implementing for success
“Okta’s number-one company value is customer success. We want to make our customers successful, and we want to ensure that our customers maximize the value from their investment in our product. We want to do that as quickly as possible,” describes Phil.
Once a Lucidchart diagram has helped seal the deal, it becomes an instrument for implementation to help those on the professional services team get a solution up and running as quickly as possible. While the pre-sale diagram is more of a high-level view to help customers quickly gain understanding, the post-sale diagram that sales architects create is much more detailed and finalized in order to show exactly how Okta will integrate with the customer’s current architecture. It helps to validate the sales cycle.
When a final diagram is completed and approved by the customer, it is passed on to the technical consultant for implementation. It is also added to the existing documentation prepared for each customer, a 50 to 120-page masterpiece that includes details on the existing architecture, visuals, and code. Customers, architects, and designers all refer to the document.
Phil describes the biggest benefit of Lucidchart for his organization, stating:
“The collective benefit is we can create more diagrams. We can create higher quality diagrams, and we can create them faster. The more we can produce, the more detailed technical information the customer has presented to them and stored for the future. The documentation we provide can include triple the amount of diagrams now.”
According to Dan, without these Lucidchart visuals, he couldn’t build customer’s trust as quickly, especially virtually. Providing these professional diagrams puts customers at ease, helping them to gain confidence in Okta as they clearly identify the value their solutions provide.
That’s why, if you ask Dan what he uses Lucidchart for, he’ll tell you the better question is what doesn’t he use it for. The team at Okta simplifies the complex to grant customers confidence, one diagram at a time.