
Google Drawings vs. Lucidchart: Why Lucidchart wins
Reading time: about 5 min
Topics:
Imagine you’re creating a proposal in Google Docs, Sheets, or Slides. It lacks visual context, so you decide to add a diagram. Your next step is comparing Google Drawings vs. Lucidchart to choose the best diagramming tool for the job.
At first glance, Google Drawings seems like the obvious choice. After all, it’s right there in the Google menu bar (and, well, it’s made by Google).
But, as you start building your diagram, you realize you’ll need more advanced features to create a high-quality visual. That’s when Lucidchart emerges as the best choice. Keep reading to learn why.
Lucidchart integrates with Google Workspace
Google Drawings is native to Google, but Lucidchart integrates with Google Workspace, so it’s just as easy to add, edit, and update Lucidchart visuals within Google apps.
Simply create a Lucidchart document and embed it directly into Google Docs, Sheets, or Slides. When you update your visuals in Lucidchart, you can update them automatically in your embedded documents. If you prefer to build Lucidchart diagrams directly in Google Docs, you can install and use our free add-on.
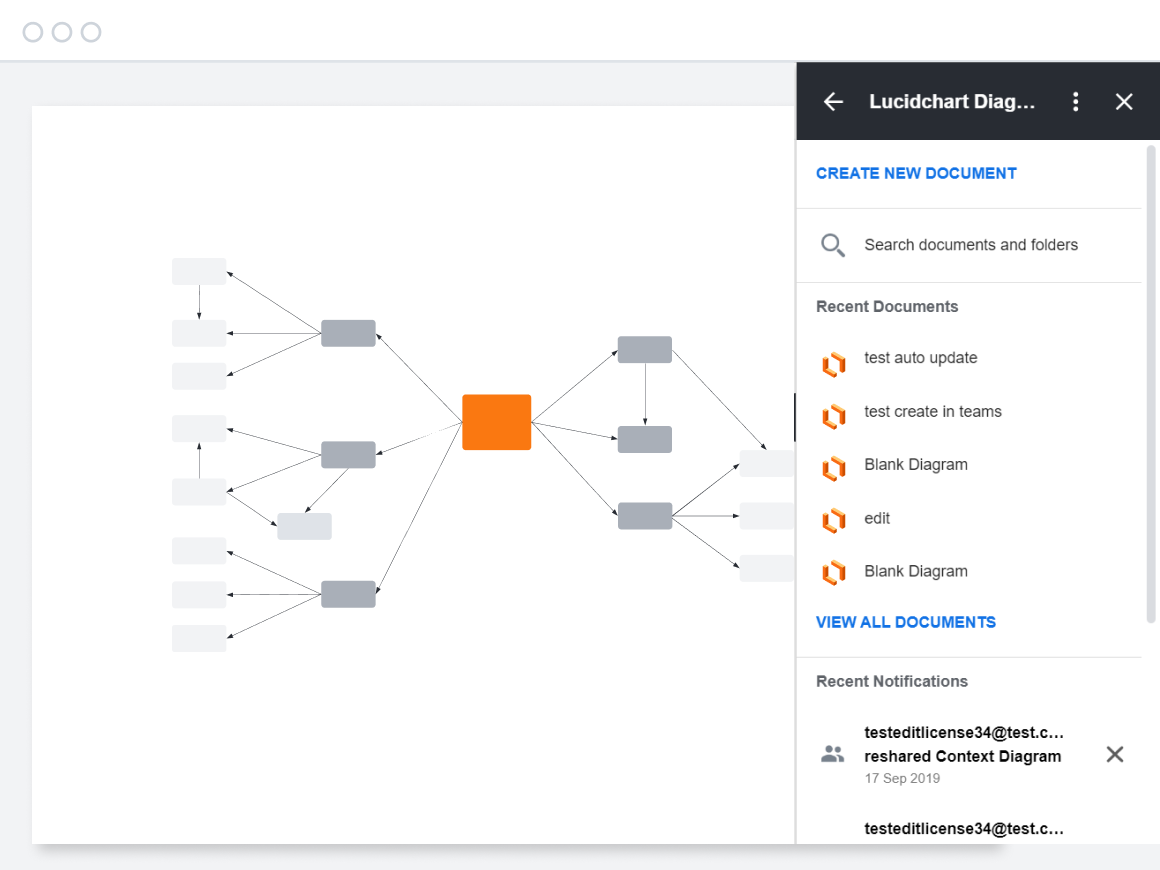
Lucid + Google integrations ensure the same connected experience as Google Drawings but with way more options.

Read about and install Lucid + Google integrations.
Learn moreLucidchart provides more options for more flexibility
Speaking of more options, Lucidchart gives you more ways to visualize any idea, system, or process. Here’s a quick overview of what you can do in Lucidchart.
Customize shapes, lines, and text
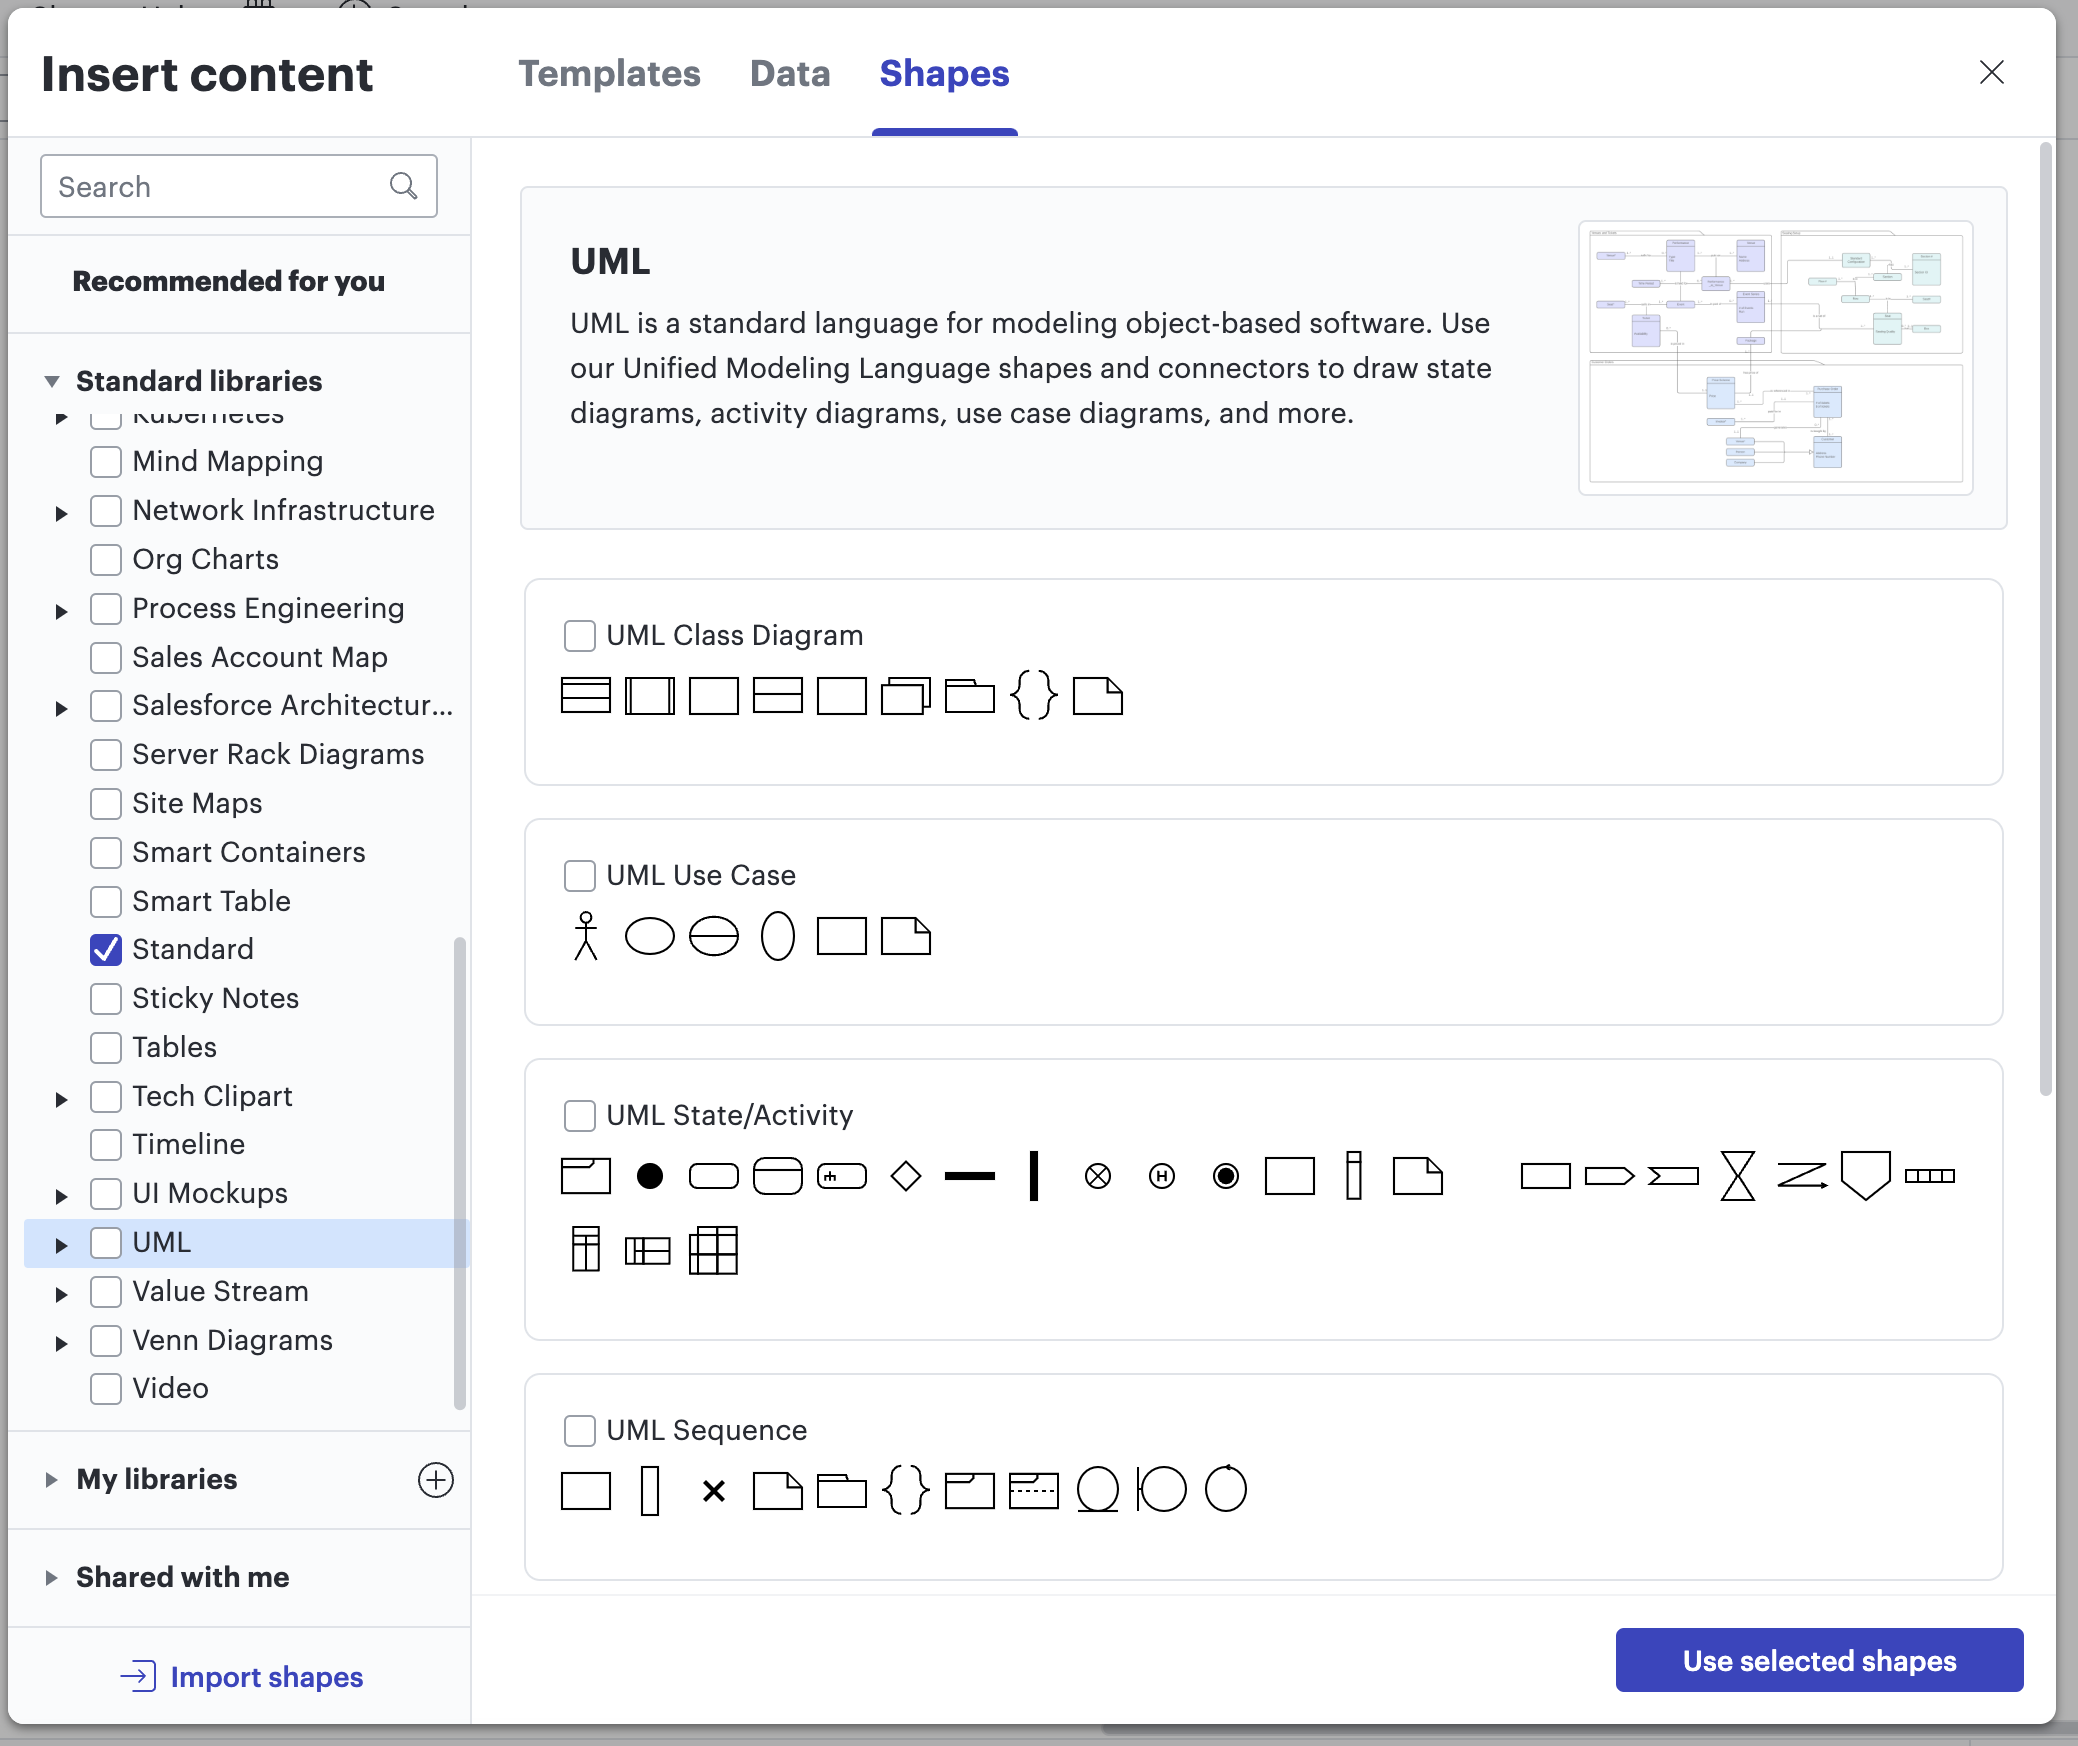
Browse a wide range of premade shape libraries—for everything from circuit diagrams to UML diagrams, ERDs, and site maps. If your use case is highly specialized or unique to your business, you can also create and share your own custom shape libraries.
When adding lines, you can choose a line shape (straight, curved, or elbow) and modify line color, width, and style (solid, double, jump, or text pill). You can also modify the line path or create Smart Lines that automatically adjust their connection points to form the most efficient path between two objects.
To ensure that all your visuals have the right labels and descriptions, you can add text to shapes, lines, images, or directly to the Lucidchart canvas using a text box. Choose from a variety of fonts in the formatting bar or upload your own. You can also customize the style, size, color, and alignment of your text.
In Google Drawings, your options for shapes, lines, and text are much more limited.
Leverage data and automation capabilities
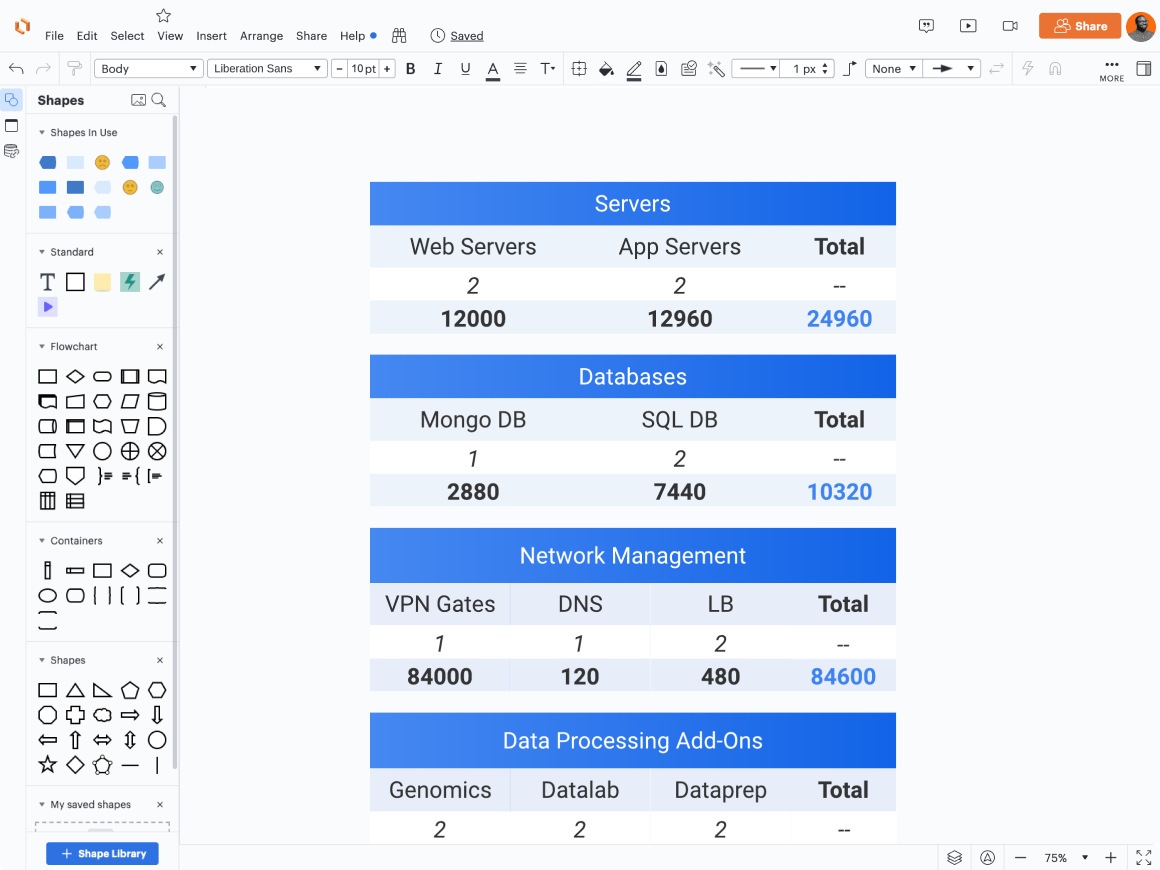
As an intelligent diagramming application, Lucidchart is a powerhouse of data and automation. For example, you can use data linking to connect visuals to live data in a Google Sheet. That way, your dynamic shapes update automatically when you edit your spreadsheet.
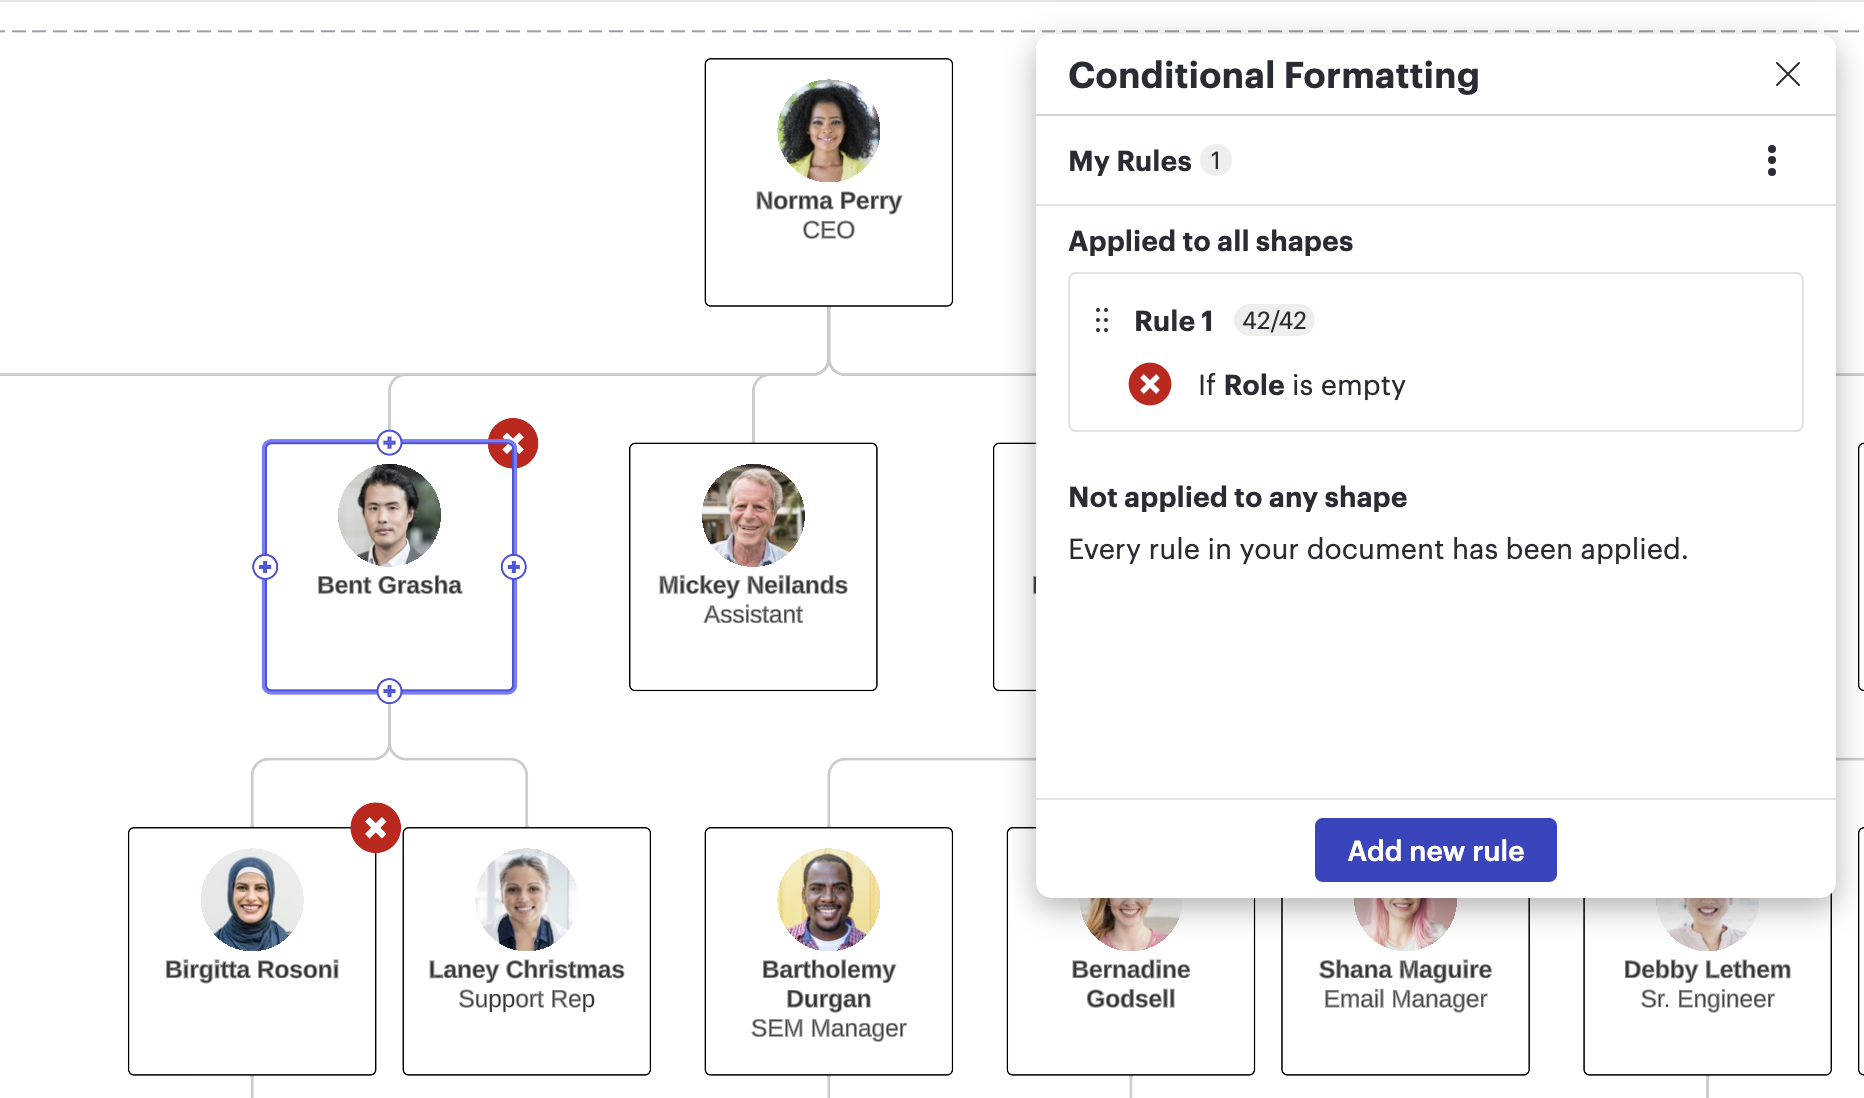
Other notable data-supported features include conditional formatting, which allows you to emphasize key aspects of your visuals by creating formatting rules based on certain factors or data. Additionally, you can use Smart Containers to visualize data by separating unique values from your dataset into groups. The best part: You can import data in Lucidchart to generate entire diagrams automatically.
In contrast, Google Drawings is all manual all the time. Copy and paste is about as advanced as it gets.
Lucidchart is intuitive and easy to use
You might think that Lucidchart’s advanced features would make it difficult to use, but the exact opposite is true.
Technical users enjoy Lucidchart because it allows them to map out complex workflows and build dynamic data visualizations. But even the most expert diagrammers appreciate the ease and speed at which they can add or customize shapes and text within documents.
The same goes for non-technical users: Anyone can drag and drop shapes onto a Lucidchart canvas and start building their vision solo or collaboratively with their whole team.
In Lucidchart, it’s not just about how much you can do but how efficiently you can do it. Features like Smart Lines, match size, copy shape style, shape distribution, change shape, and more make it easy to create professional diagrams without wasting time, effort, and brain power.

Learn about the top, time-saving Lucidchart shortcuts.
Read moreLucidchart makes it easy to update visuals
As mentioned above, data linking in Lucidchart helps ensure that your visuals are always in sync with your data source. If you make manual edits to a Lucidchart visual, you can refresh to see changes in Google Docs or Sheets by selecting “Update Images” from the Lucidchart add-on sidebar.
To edit visuals created with Google Drawings, you have to manually update each individual image.
Lucidchart offers 1,100+ templates
Sometimes the hardest part of starting a flowchart, process map, wireframe, or any visual is overcoming the blank page. That’s why Lucidchart offers more than 1,100 templates—so you don’t have to create every diagram from scratch.
Search the Lucidchart template gallery by keyword or browse by use case. You’ll find examples for visualizing technical systems, designing layouts, creating dashboards, and so much more.
Want to use a template in Google Drawings? You can, but first, you have to find an example you like and save it for when you’re ready.

Explore the Lucidchart template gallery and see the possibilities.
Get startedLucidchart is the best Google Drawings alternative
Going back to the diagram for your hypothetical proposal from the intro, let’s answer the big question: Which diagramming tool is best for the job—Google Drawings vs. Lucidchart?
If you read this blog post (or even skimmed the subheads), the verdict is clear. Google Drawings is a fine choice for creating diagrams in Google Docs, Sheets, or Slides with just a few shapes and lines.
But, if you need more—formatting options, data and automation capabilities, and a wide range of templates—Lucidchart works seamlessly with Google apps to provide a connected and robust diagramming experience. It’s the best choice in any scenario (real or hypothetical) that requires a professional-quality diagram.

Ready to add a real diagram to Google Docs, Sheets, or Slides?
Go to LucidchartLucidchart
Lucidchart, a cloud-based intelligent diagramming application, is a core component of Lucid Software's Visual Collaboration Suite. This intuitive, cloud-based solution empowers teams to collaborate in real-time to build flowcharts, mockups, UML diagrams, customer journey maps, and more. Lucidchart propels teams forward to build the future faster. Lucid is proud to serve top businesses around the world, including customers such as Google, GE, and NBC Universal, and 99% of the Fortune 500. Lucid partners with industry leaders, including Google, Atlassian, and Microsoft. Since its founding, Lucid has received numerous awards for its products, business, and workplace culture. For more information, visit lucidchart.com.
Related articles
 7 ways to maximize Google Workspace with Lucidchart integrations
Promote collaboration at every stage of the project lifecycle and accomplish more than ever with our integrations for Google Docs, Google Sheets, Google Slides, and Gmail.
 Make your diagrams dynamic with Lucidchart data linking [+course]
Keep your Lucidchart documents up to date and see data in context with data linking! You connect shapes and diagrams to live data stored in spreadsheets. Learn more!
 How to make a flowchart in Google Docs
Learn how to make a flowchart in Google Docs and help collaborators understand ideas, information, and processes quickly. We'll walk through the process of creating a flowchart with Google Drawings and with the Lucidchart add-on.
 How to make a flowchart in Google Sheets
Learn how to make flowcharts in Google Sheets and discover how to use Lucidchart in Google Sheets to quickly create diagrams and use more advanced capabilities.