What is BPMN?
Business Process Modeling Notation (BPMN) is a flow chart method that models the steps of a planned business process from end to end. A key to Business Process Management, it visually depicts a detailed sequence of business activities and information flows needed to complete a process.
Its purpose is to model ways to improve efficiency, account for new circumstances or gain competitive advantage. The method has been undergoing a standardization push in the past few years and is now often called by a slightly different name: Business Process Model and Notation, still using the BPMN acronym. It differs from Unified Modeling Language (UML) used in software design.
BPMN tutorial
- Understand key components of BPMN
- Understand how sequence flows work
- Add activities and tasks
- Direct flow with gateways
- Organize with pools and swimlanes
- Share your diagram with your team to start collaborating
BPMN Events
Events, represented with circles, describe something that happens during the course of a process. There are three main events within business process modeling: start events, intermediate events, and end events. These three types are also defined as either catching events (which react to a trigger) or throwing events (which the process triggers). Once you're familiar with BPMN, jump right into Lucidchart's intuitive editor to start making diagrams.
Start Events

Each process must begin with an initiating event, called the start event. All start events catch information (such as receiving an email), and you can add a line that proceeds from the start events to continue the process. Many start events contain an icon in the middle to define the event's trigger. For example, a start event that contains an envelope icon indicates that a message arrives and triggers the start of the process.
In Lucidchart, you can easily add a start event from the BPMN 2.0 shape library in Lucidchart. Once you drag shapes onto the canvas, you can click any shape to change its properties in the advanced shape menu at the top of the editor.
This simple shape represents how a process begins by receiving an email. After the user receives the email, the rest of the BPMN diagram may proceed.

Intermediate events

An intermediate event is any event that occurs between a start and an end event. The intermediate event circle has a double line, and the event can catch or throw information. Connecting objects indicate the directional flow, determining whether the event is catching or throwing.
Lucidchart users can find event types for intermediate events by using the advanced shape menu that appears when you add a new BPMN shape to the canvas.
The shape below shows a message received in the middle of a process. Notice that the event circle has a double line around it and that the mail icon is not filled in, indicating that it is a catching shape.

The following shape is similar to the previous example, except it is throwing a message, not catching one. Simply put, the message is sent as a step in the process, instead of a message being received.

End events

Finally, end events are styled with a single thick black line. End events are always thrown because there is no process to catch after the final event.
In the BPMN example below, the process is completed when a final message is thrown. After processing some system, it is likely that you will need to notify someone, so it's common to include a thrown message to end your flow.

BPMN Activity
BPMN Tasks
A task is the most granular level of a process. Lucidchart supports many types of symbols that signify the various task types.
Normal task
A normal task is a single action that occurs in a business process, i.e. mailing a letter.

The example below shows the process of writing a paper, and normal tasks are used to depict each of the activities.

Loop task
A loop task is a task that repeats over and over again in sequence.

If you want to incorporate a loop task into the previous example, you might change the editing paper task to a loop task. This loop task signals your intention to repeatedly edit the document before submitting the final draft. To explain the conditions of the loop task, you might also add an annotation saying that you will continue to edit the paper until the teacher says the current draft will get an A.

Multiple instance task
A multiple instance task is a task that happens multiple times. These instances can happen in parallel or sequentially.

Let's say that you were able to get several friends to look over your draft and give you feedback on possible changes. You would want to make it a multiple instance task instead of a loop task. This task type indicates that you gave a draft to three different people and that all three will get back to you at the same time. This example shows multiple edits happening simultaneously, but you could easily show the multiple edits happening sequentially by changing the activity type.

Compensation task
A compensation task is a specialized version of a task that only happens when another specific task occurs previously. Compensation tasks are often used to show the form and timeliness of payout given for the work done in the process.

Your friends probably won't work for free, so you can add a compensation task to show that you will pay them on the condition that they edit your paper.

Compensation loop task
A compensation loop task makes compensation a recurring event. In this example, if you only had one editor, you could show that you paid them each time they edited your work.

BPMN sub-processes
In BPMN, sub-processes are a subset of regular task types that favor simplicity. In a typical work environment, BPMN diagrams are used to communicate processes to stakeholders and developers alike. Stakeholders generally do not want the complexity that developers require, so sub-processes allow you to collapse and expand tasks to quickly convey information to both groups.

Loop
A loop indicates that a sub-process repeats itself in sequence. It is treated similarly to a loop task when in a collapsed view.

Multi-instance
This sub-process can run concurrently with other identical sub-processes. It is treated similarly to a multi-instance task when in a collapsed view.

Compensation
A compensation sub-process is typically reserved for a group of tasks that describe some part of the compensation method, either accounts receivable or accounts payable.

Ad hoc
An ad hoc sub-process is a group of tasks that exist for the sole purpose of completing a piece of a process. For example, an ad hoc sub-process might deal with one particular vendor who has a unique payment system.

Transactions
A transaction activity is a specialized sub-process symbol that represents payment processes. All transaction activities are contained by a double line. Transactions must verify that all participants have completed their parts of the transaction before the sub-process can be completed.

Event sub-process
Event sub-processes are used to describe events that happen within the boundary of a sub-process. Event sub-processes are triggered by a start event, and they differ from other sub-processes because they are not part of the regular flow. They’re self-contained and occur within the context of a sub-process.
There are two main types of event sub-processes: interrupting and non-interrupting. An interrupting event sub-process interrupts the normal business flow, while a non-interrupting event sub-process does not. For example, if an order on a website is canceled, the process is interrupted, and all website activity is terminated. But if the customer simply checks the shopping cart to see which items are reserved for purchase, the process is non-interrupting.

Call activity
A call activity is a global process that is used whenever a certain process needs to be implemented. Whenever the call activity notation is used, control of the process is pushed to the global predefined process.

BPMN task types
BPMN task types represent executable tasks. While they are not used much in practice, they are particularly important when modeling the requirements for an engineering project.
Business rule task type
Business rules, added with BPMN 2.0, are specific types of services maintained by a business group, rather than an IT group. The rule shape is used to represent the implementation of a business rule.

Manual task type
A manual task type is used whenever an activity must be executed manually. It can be executed without any outside help or application (e.g. loading a truck with product).

Receive task type
A receive task indicates that the process is relying on an incoming message from a third party. Upon receiving a message, the task has been performed.

Script task type
Script tasks are executed by a business process engine. The script is written in a language that the engine can parse, which, in many instances, is JavaScript.

Send task type
A send task sends a message to another process or lane. The task is completed once the message is sent.

Service task type
A service task is any task that uses an automated application or web service to complete the task.

User task type
The user task type indicates that the task is being performed by a person and cannot be easily broken down into simpler tasks.

BPMN Artifact Types
In business process modeling, artifacts allow you to visually represent objects outside of the actual process. Artifacts can represent data or notes that describe the process, or they can be used to organize tasks or processes. There are three main types of artifacts: data objects, annotations, and groups.
You can easily access all of the shapes discussed below in Lucidchart. First, enable the BPMN 2.0 shape library—click on the “Shapes” button in the upper-left corner of your window and check the BPMN 2.0 box in the window that appears. Then, drag and drop shapes from the shape library to the left onto the canvas. To assign shapes to specific classes, click on the shape and then on the desired class as found in the advanced shape menu above the canvas.

Data objects
Data objects can represent data placed to the process, data resulting from the process, data that needs to be collected, or data that needs to be stored.
Data input

Tasks are often data-dependent, meaning the task cannot proceed until certain data has been collected. Data inputs represent those data requirements of the business process.
Data output

If a process generates data, a data output represents the information produced as a result. For instance, a BPMN diagram that represents the survey collection process would output result data and require a data output shape.
Data collection

Data collection is denoted differently than a one-time data requirement. For example, in the survey collection process, the act of surveying would be represented by the data collection shape.
Data storage

Data storage provides the ability to store or access data that is associated with a business model. If your process outputs any data, it will become necessary to store that data. In a BPMN diagram, you can determine where you will store data to keep track of your data and increase your organization and efficiency.
Annotations

Annotations allow you to describe the business process and flow objects in more detail. Add annotations to make your BPMN more readable and further increase understanding of your process.
Groups

Groups organize tasks or processes that have significance in the overall process. Use groups to better arrange your BPMN diagram and increase its usefulness to your organization.
Tips for business process modeling
- Clearly define the scope of the process with a beginning and end.
- You might first map the current business process to highlight inefficiencies before modeling a better way with BPMN.
- Aim for BPMN diagrams that fit on one page, even if the page is poster-sized, as some are.
- Lay out sequence flows horizontally. Show associations and data flows vertically.
- You can create different versions of the diagram for different stakeholders, depending on the level of detail needed for their role.
- BPMN is not appropriate for modeling organizational structures, functional breakdowns, or data flow models. Although BPMN depicts some information flows in business processes, it’s not a Data Flow Diagram (DFD.)
BPMN purpose and benefits
At a high level, BPMN is targeted at participants and other stakeholders in a business process to gain understanding through an easy-to-understand visual representation of the steps. At a more involved level, it’s targeted at the people who will implement the process, giving sufficient detail to enable precise implementation. It provides a standard, common language for all stakeholders, whether technical or non-technical: business analysts, process participants, managers and technical developers, as well as external teams and consultants. Ideally, it bridges the gap between process intention and implementation by providing sufficient detail and clarity into the sequence of business activities.
The diagramming can be far easier to understand than narrative text would be. It allows for easier communication and collaboration to reach the goal of an efficient process that produces a high-quality result. It also helps with communication leading to XML (Extensible Markup Language) documents needed to execute various processes. One main XML standard is called BPEL or BEPEL4WS, standing for Business Process Execution Language for Web Services.
Business Process Modeling can range from simple, hand-drawn diagrams to more involved ones with expandable elements to provide sufficient implementation detail. At its most sophisticated, BPMN is conducted by credentialed analysts. The Object Management Group (OMG) provides five certifications in BPMN 2.0 called OCEB 2, which stands for OMG-Certified Expert in BPM 2.0. One track is business-oriented, and the other is technical. OMG intends for BPMN 2.0 to standardize business process modeling in the same way that Unified Modeling Language (UML) standardized software modeling.
BPMN requires a commitment of time and energy, but the payoff in understanding and improvement can be huge. Version 2.0 builds on previous versions by providing a richer standard set of symbols and notations, allowing more detail for those who need it.
The idea behind Business Process Management is to create a life cycle of continuous improvement. The steps are model, implement, execute, monitor and optimize. BPMN diagrams play a key role in that.
BPMN 2.0 elements and symbols
BPMN depicts these four element types for business process diagrams:
- Flow objects: events, activities, gateways
- Connecting objects: sequence flow, message flow, association
- Swimlanes: pool or lane
- Artifacts: data object, group, annotation
These are the individual elements and how they are used to define a business process:
Events
A trigger that starts, modifies or completes a process. Event types include message, timer, error, compensation, signal, cancel, escalation, link and others. They are shown by circles containing other symbols based on event type. They are classified as either “throwing” or “catching,” depending on their function.
Activity
A particular activity or task performed by a person or system. It’s shown by a rectangle with rounded corners. They can become more detailed with sub-processes, loops, compensations and multiple instances.
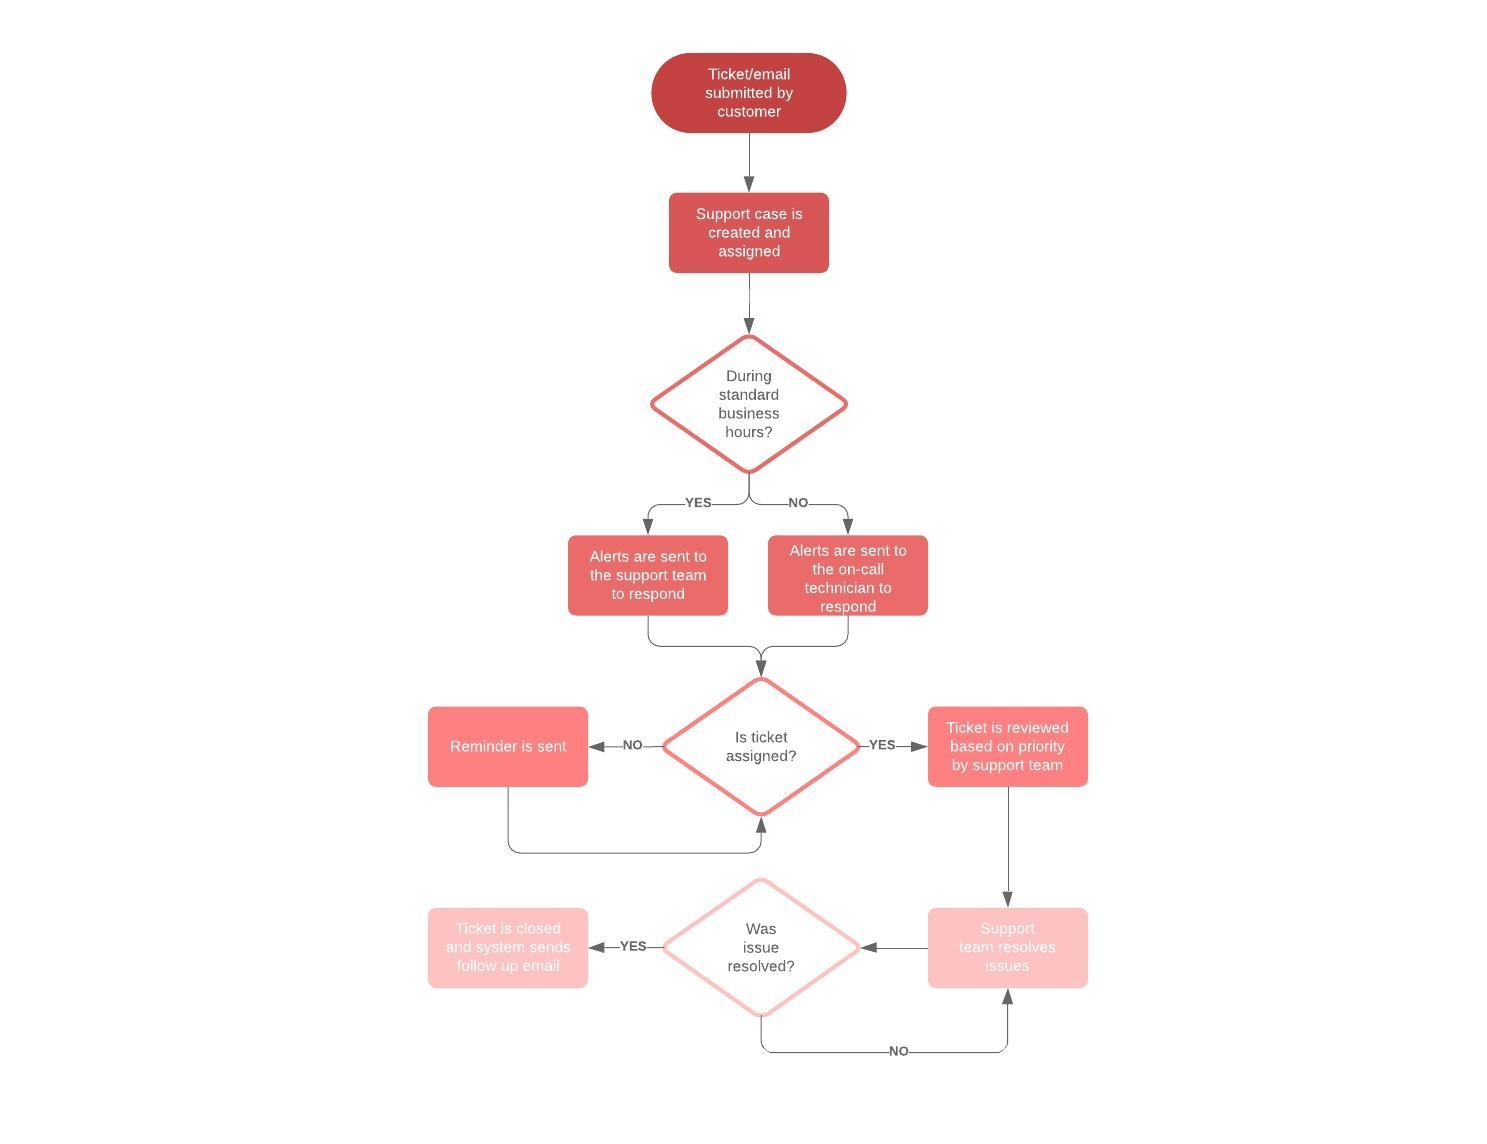
Gateway
Decision point that can adjust the path based on conditions or events. They are shown as diamonds. They can be exclusive or inclusive, parallel, complex, or based on data or events.
Sequence flow
Shows the order of activities to be performed. It is shown as a straight line with an arrow. It might show a conditional flow, or a default flow.
Message flow
Depicts messages that flow across “pools,” or organization boundaries such as departments. It shouldn’t connect events or activities within a pool. It is represented by a dashed line with a circle at the start and an arrow at the end.
Association
Shown with a dotted line, it associates an artifact or text to an event, activity or gateway.
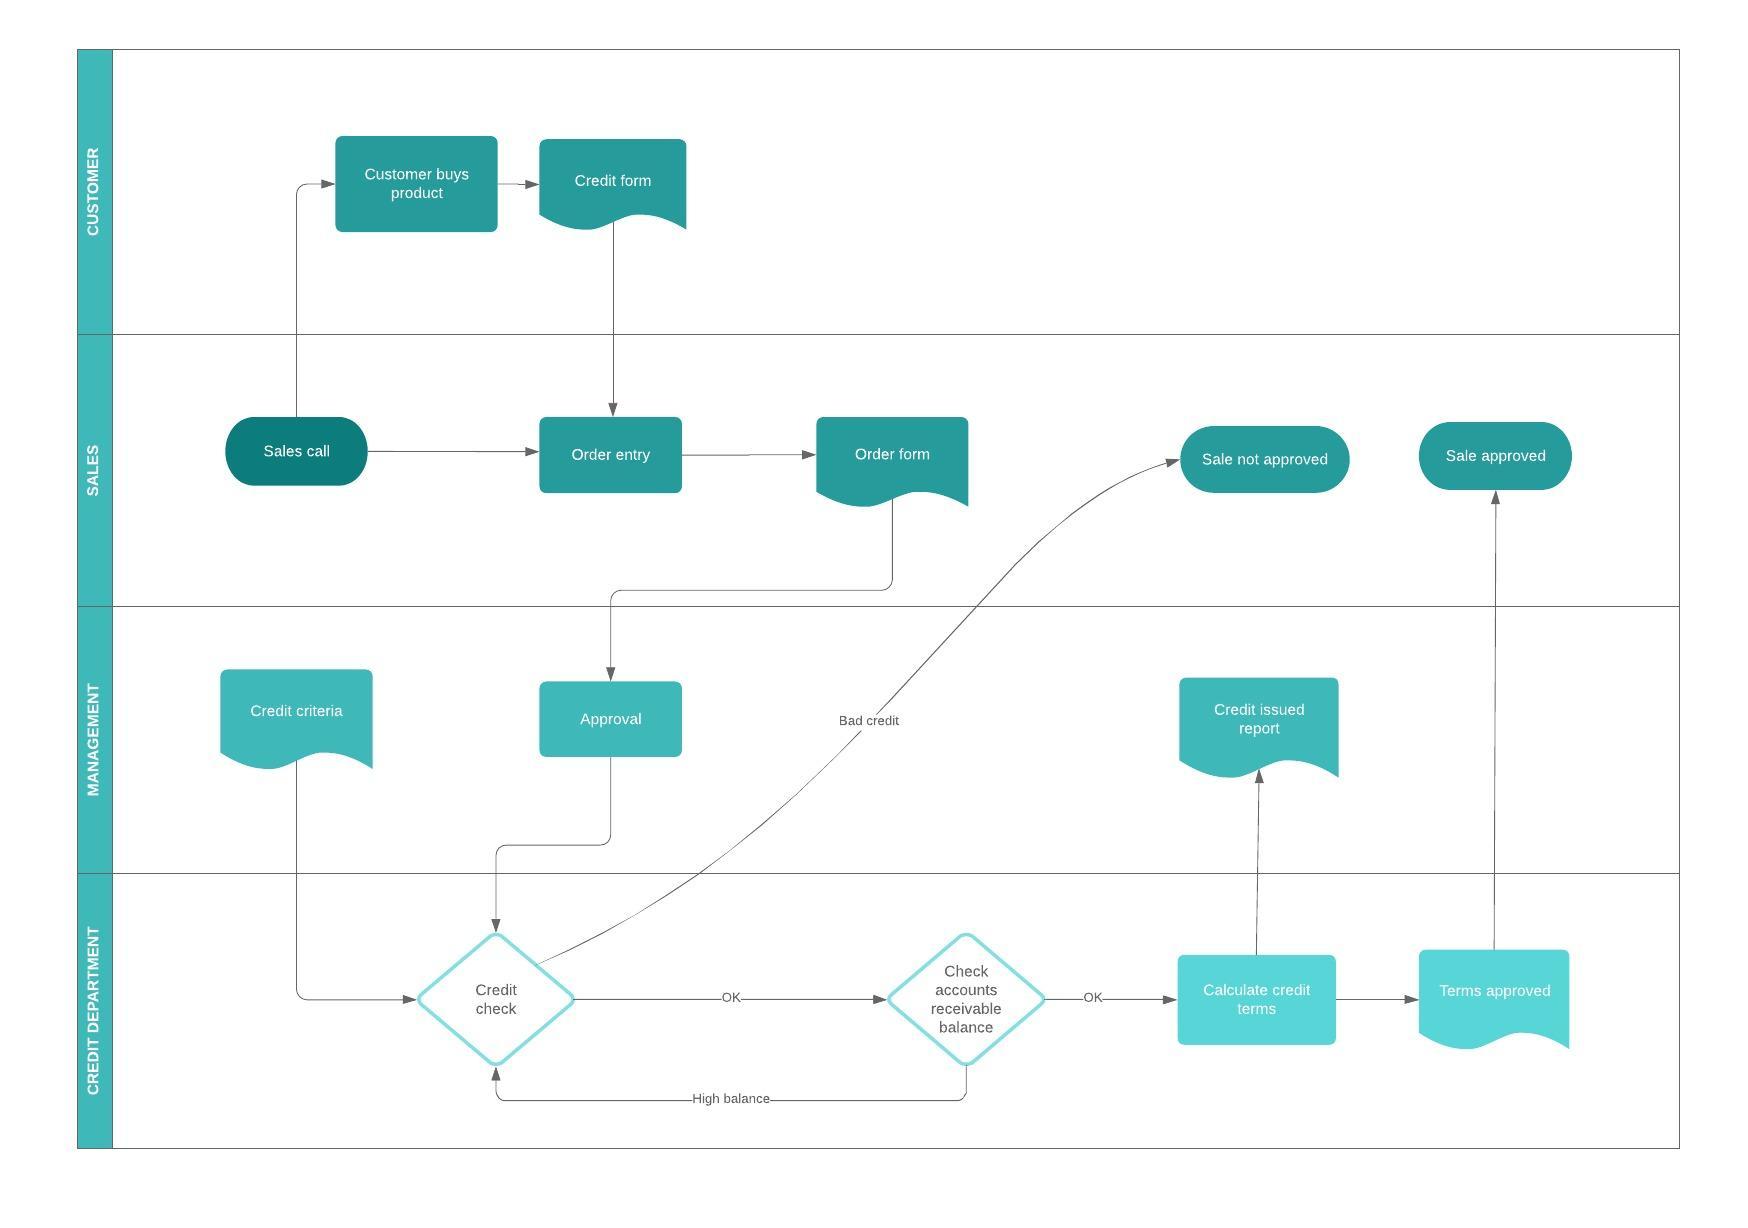
Pool and swimlane
A pool represents major participants in a process. A different pool may be in a different company or department but still involved in the process. Swimlanes within a pool show the activities and flow for a certain role or participant, defining who is accountable for what parts of the process.
Artifact
Additional information that developers add to bring a necessary level of detail to the diagram. There are three types of artifacts: data object, group or annotation. A data object shows what data is necessary for an activity. A group shows a logical grouping of activities but doesn’t change the diagram’s flow. An annotation provides further explanation to a part of the diagram.
How to do business process modeling with Lucidchart
It's easy to make business process models with Lucidchart. After signing up, simply log in, then create a blank document or start with a template. Be sure to open the BPMN shapes library, then drag and drop shapes onto the canvas as needed.
You can also stylize lines, format text, and reposition elements to get the look you need. Afterwards, share, download, or export your diagram however you like.
BPMN history and origins
Business Process Modeling Notation was developed by the Business Process Management Initiative (BPMI) and has gone through a series of revisions. In 2005, that group merged with the Object Management Group (OMG), which took over the initiative. In 2011, OMG released BPMN 2.0 and changed the method’s name to Business Process Model and Notation. It created a more detailed standard for business process modeling, using a richer set of symbols and notations for Business Process Diagrams. Since 2014, BPMN has also been complemented by a decision flow chart method called the Decision Model and Notation standard, since BPMN doesn’t naturally lend itself to decision flows.
Sub-models within a BPMN diagram
The diagrams are used to communicate with diverse audiences, both non-technical and technical. Sub-models allow the diverse viewers to easily differentiate between sections of the diagram, finding what’s most applicable to them. The types of sub-models are:
- Private business processes. These are internal to a specific organization and don’t cross pools, or organizational boundaries.
- Abstract business processes. These occur between a private/internal process and another participant or process. The abstract process shows the outside world the sequence of messages needed to interact with the private process. It doesn’t show the private/internal process itself.
- Collaboration business processes. These show the interactions between two or more business entities.