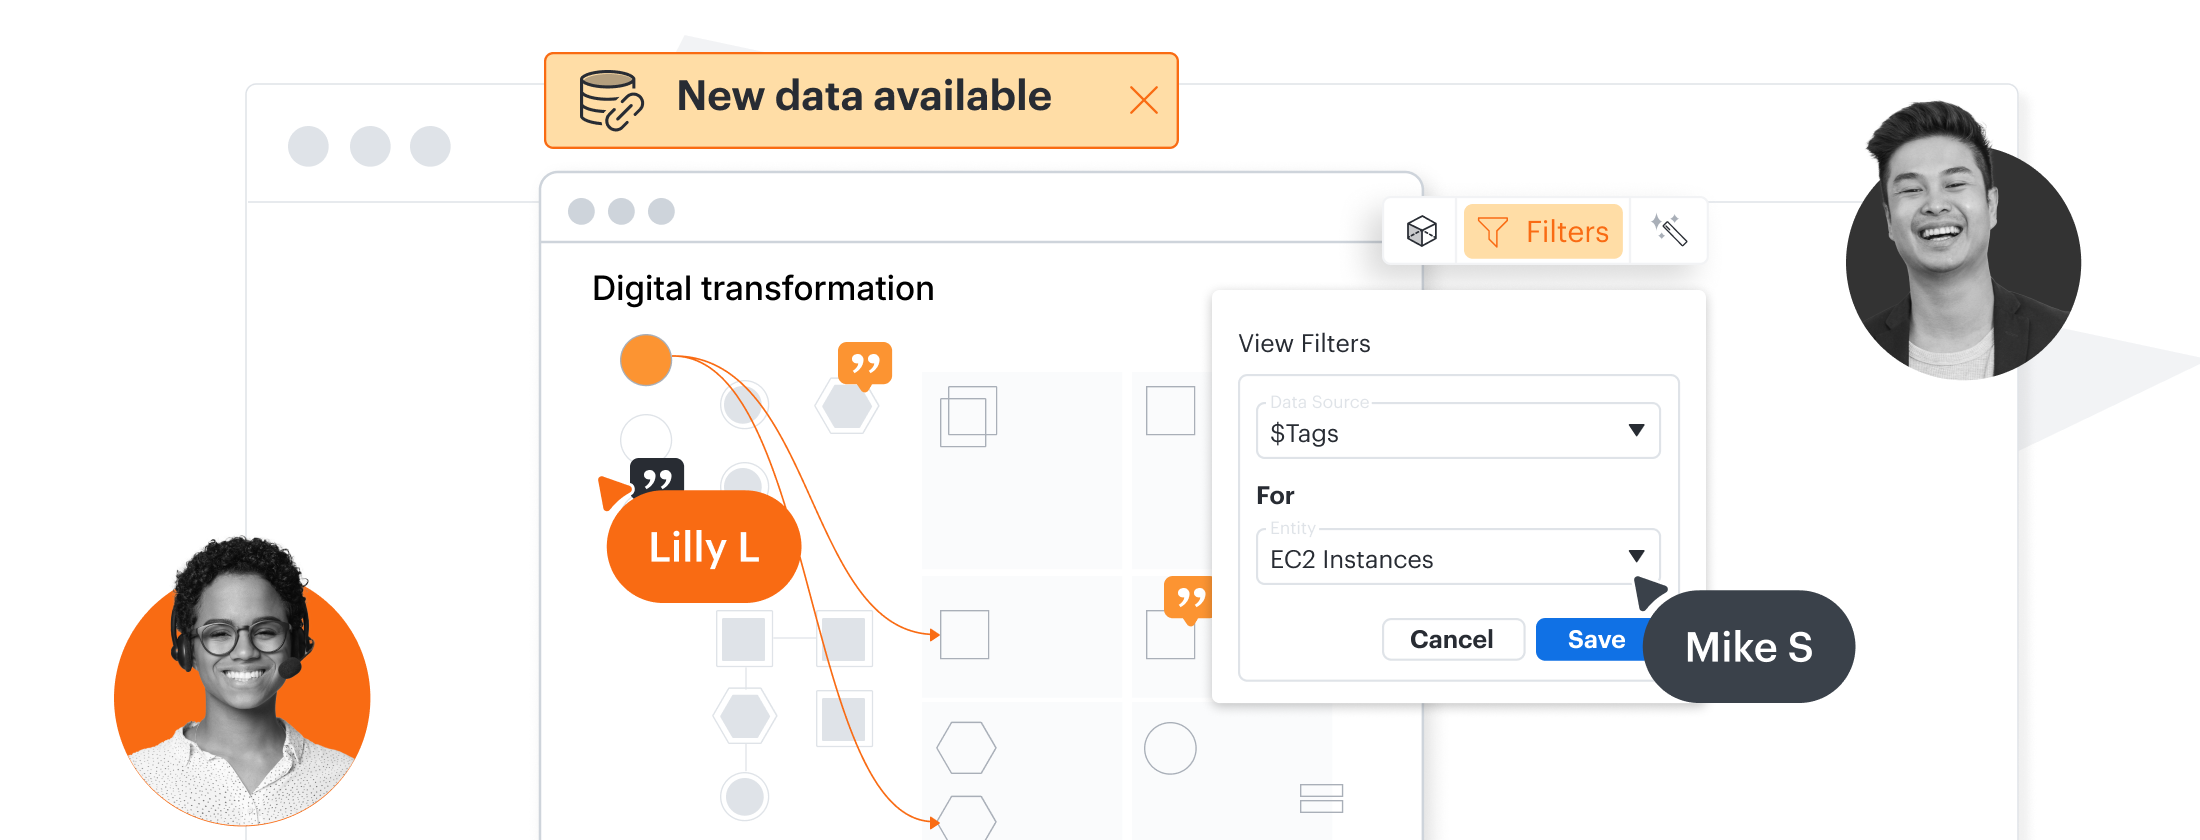
Create process maps and flowcharts
Build collaboratively with your team. Use Lucidchart to document complex systems and processes, define next steps, and create a single source of truth.
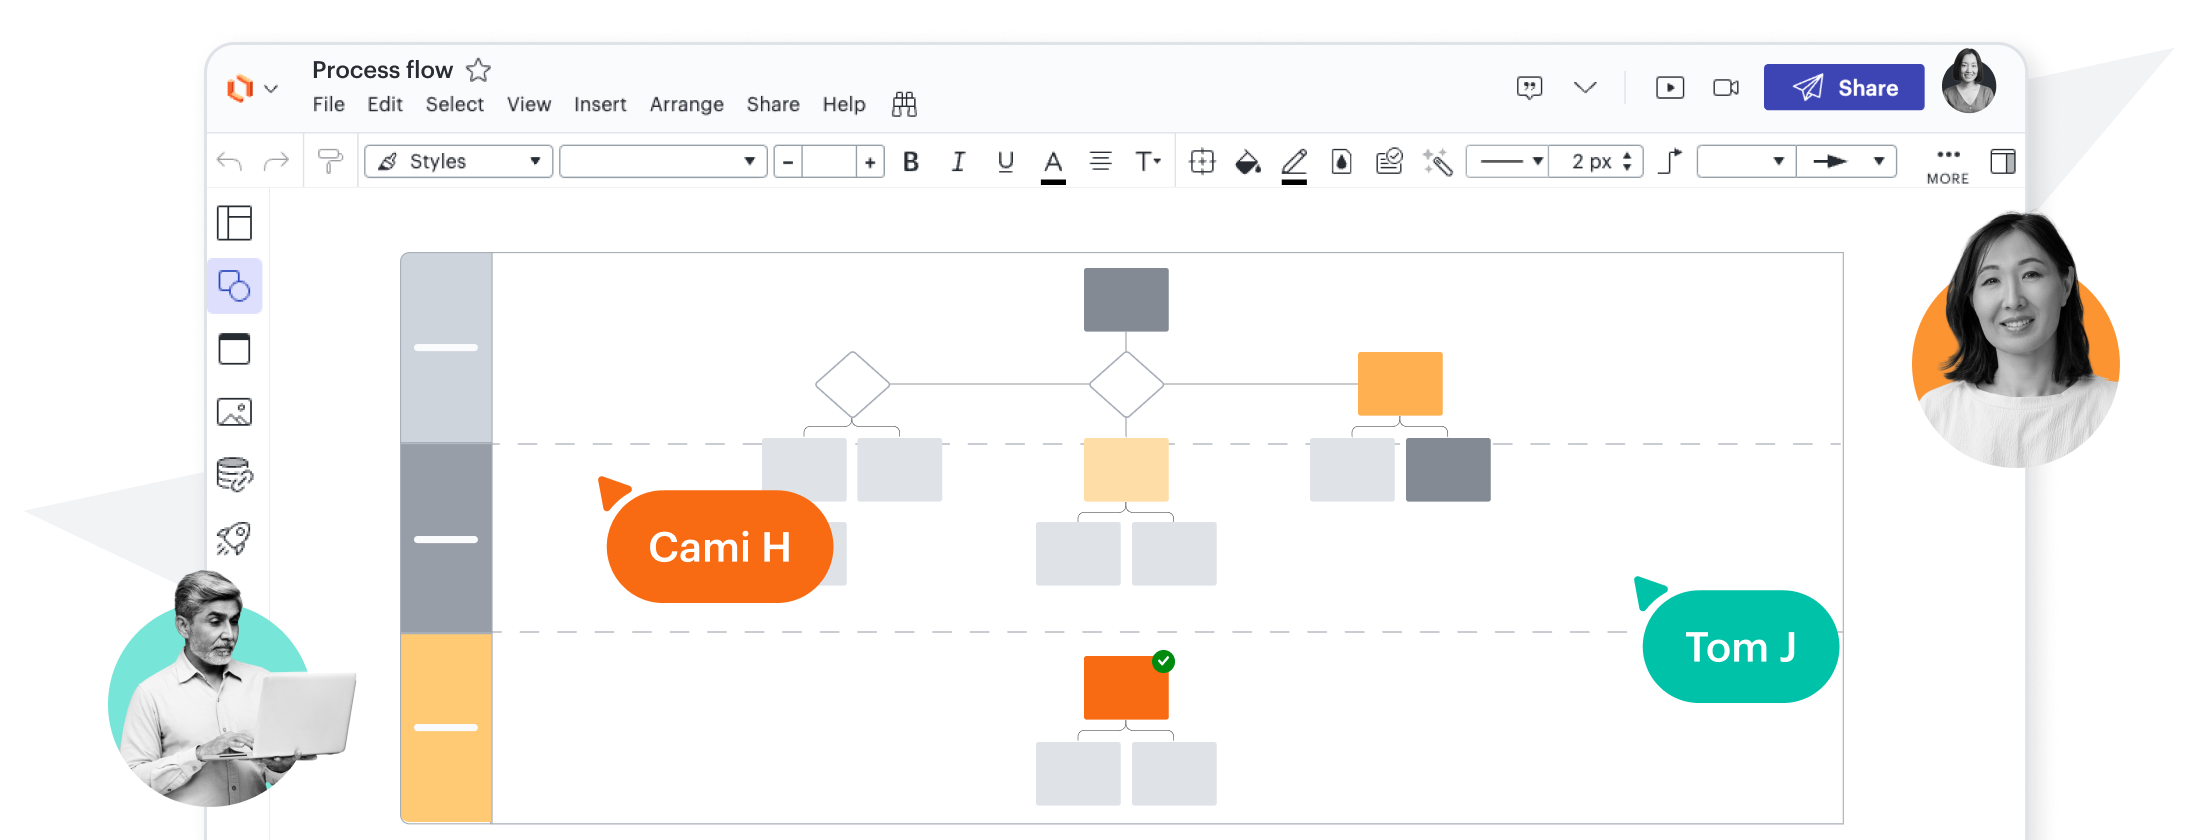
Document complex systems and processes
Improve your team’s shared understanding by creating visual documentation that’s easy to follow.
The perfect toolkit for visualizing your business
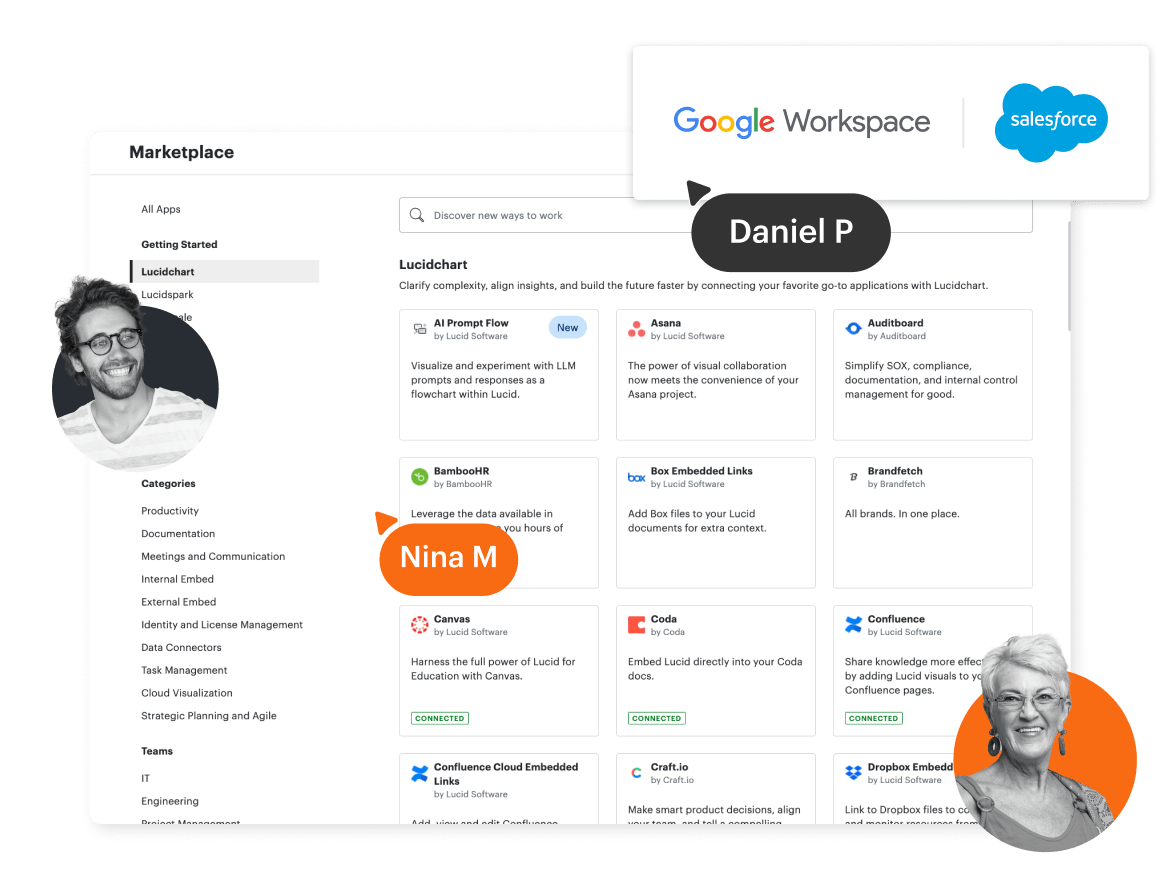
Simplify process design
Create and collaborate on diagrams within a user-friendly interface. Streamline workflows by enabling integrations with leading apps like Google Workspace and Salesforce.
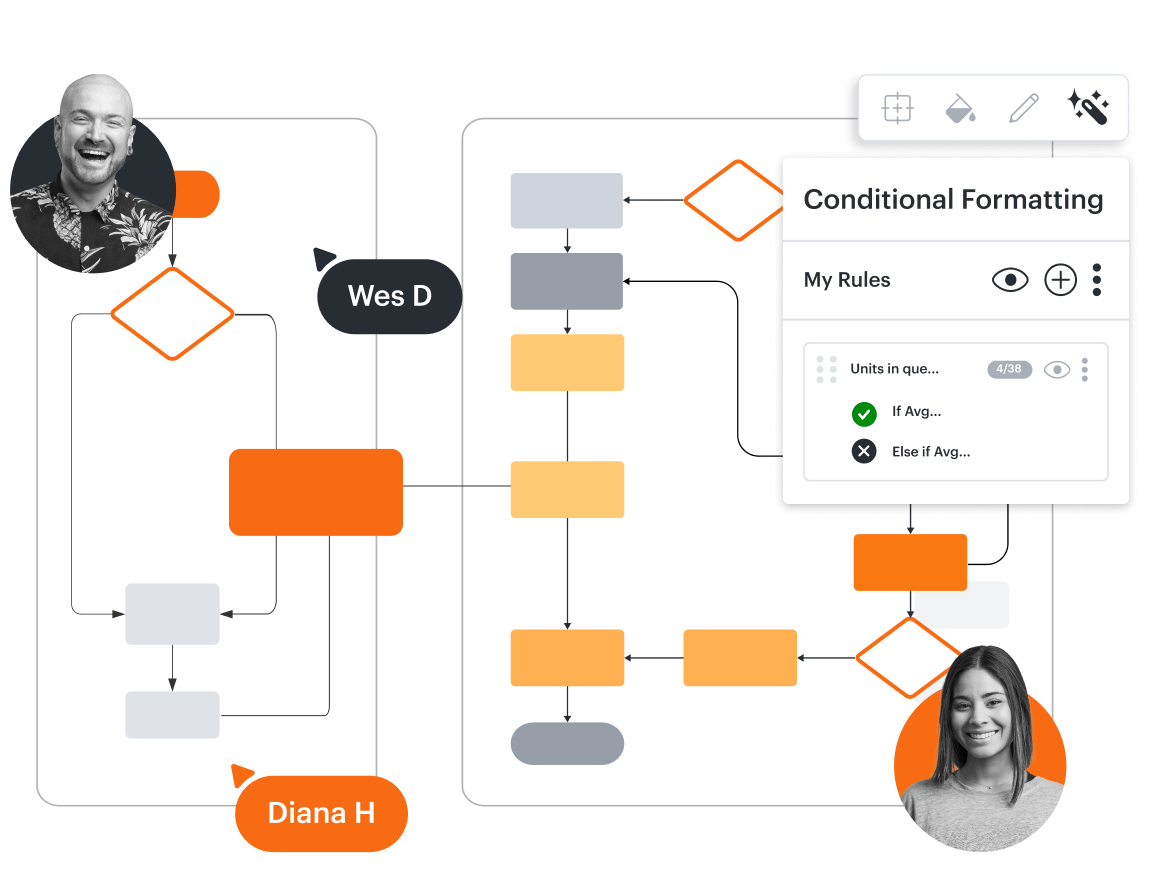
Optimize every process
Bring your team together for collaborative decision-making focused on strategic improvements. Leverage conditional formatting and specialized shape libraries for process optimization.
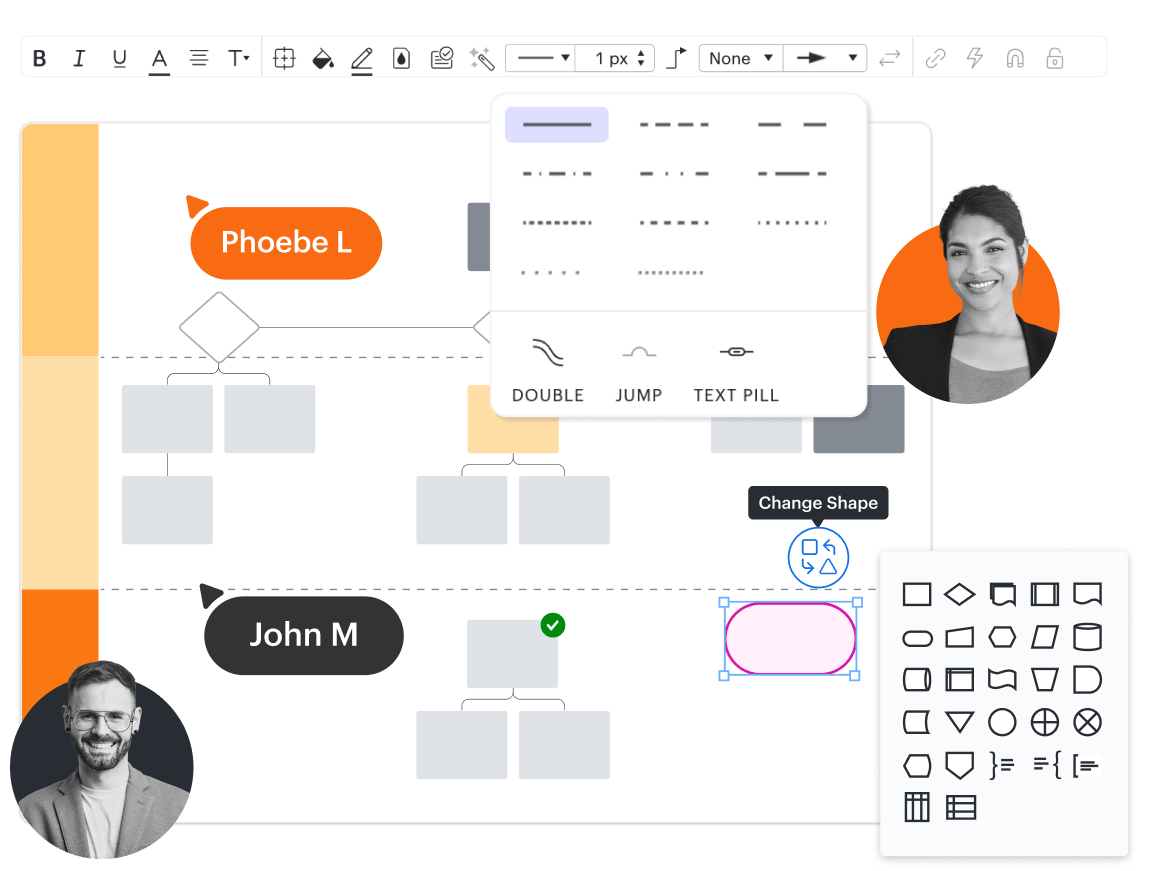
Diagram with ease
Use Lucidchart’s intuitive styles to create personalized, visually appealing charts that enhance team understanding and clarity—regardless of your chart-making experience.
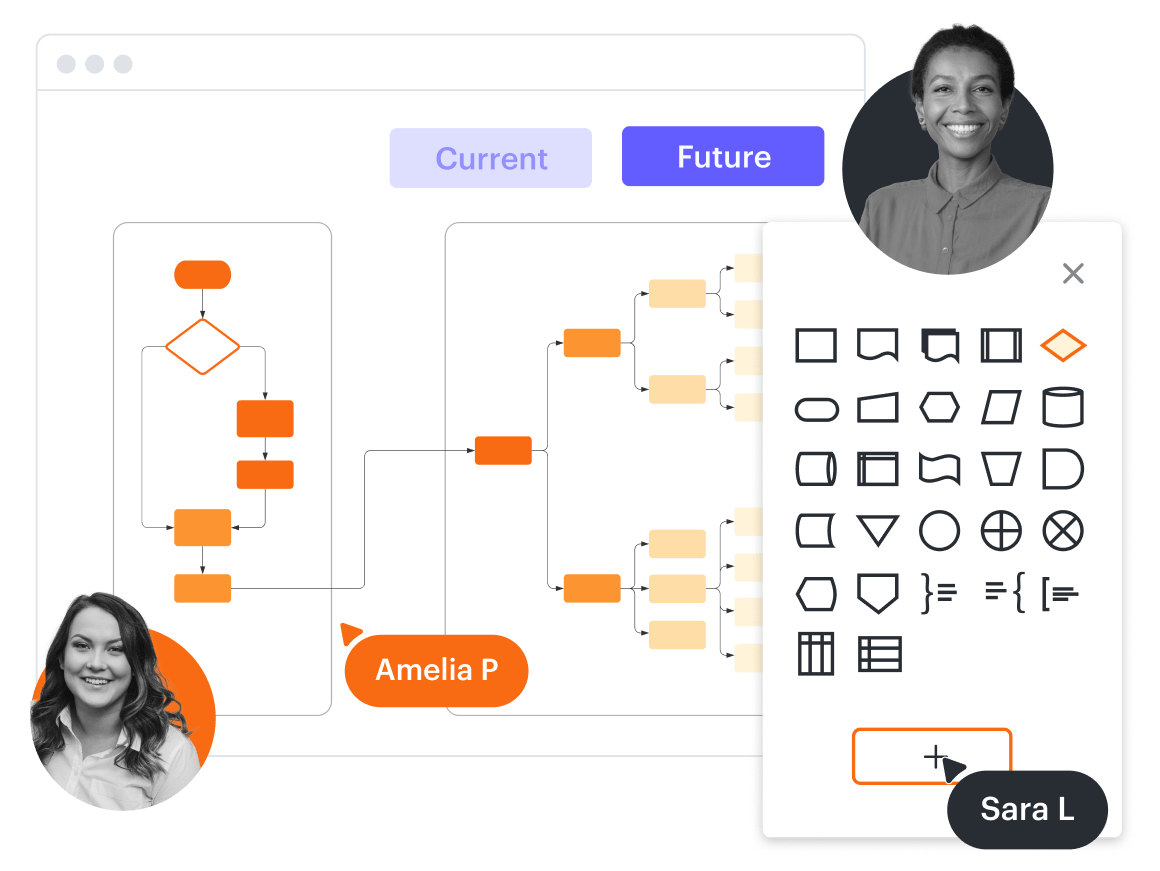
Adjust on the fly
Edit diagrams in Lucidchart without leaving the canvas. Drag and drop shapes into your flowcharts, and quickly format and modify shapes with one click.

Create AI-powered flowcharts
Use AI within Lucidchart to effortlessly transform text-based prompts into flowcharts. Increase visual clarity and refine your workflows while saving time in the process.
Learn more about AI in LucidchartFeatures for creating process maps and flowcharts
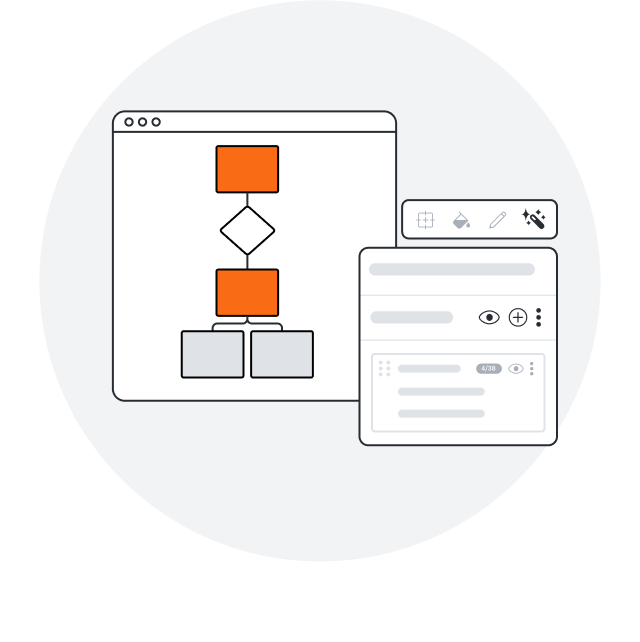
Conditional formatting
Transform data by visually highlighting patterns and insights for quick comprehension at a glance.
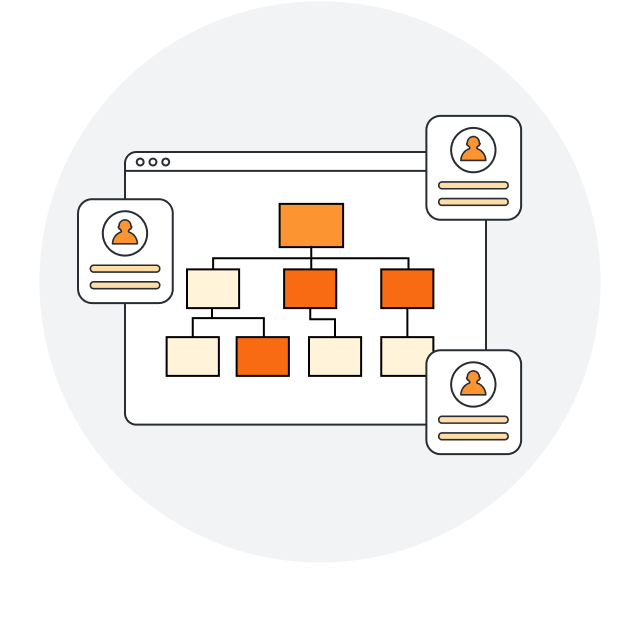
Real-time collaboration
Streamline work by enabling multiple collaborators to create and edit the same diagram at once.
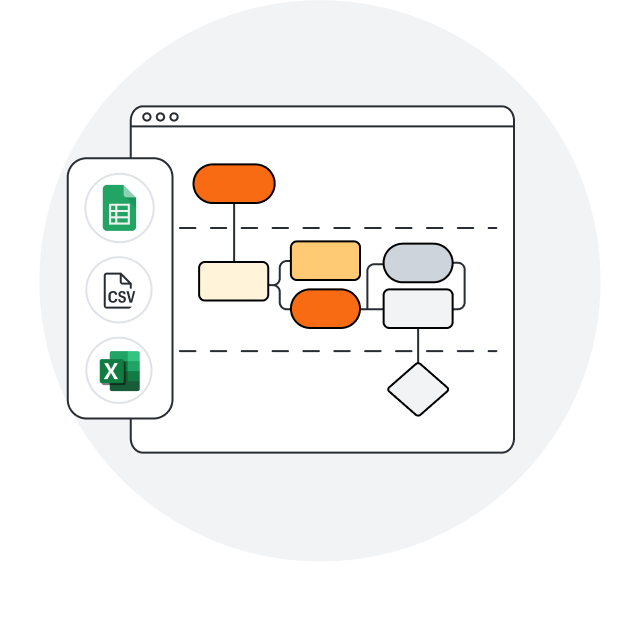
Data linking
Create accurate diagrams faster by linking shapes to data from Google Sheets, Excel, or CSV files.
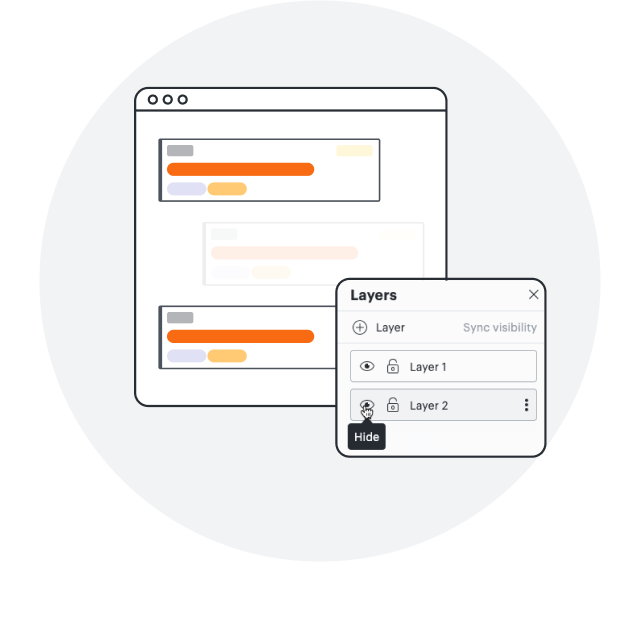
Layers
Add layers to visualizations for multiple levels, distinct visibility controls, and streamlined editing.
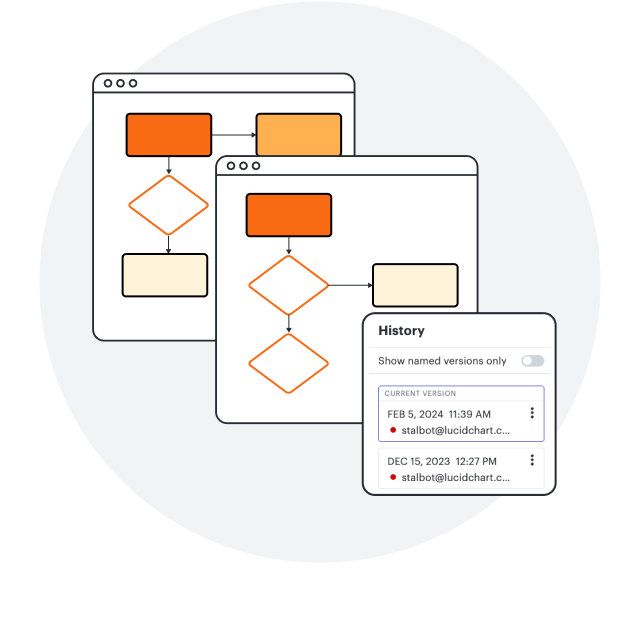
Revision history
Collaborate confidently—view changes, revert to prior versions, and ensure diagrams are up to date.
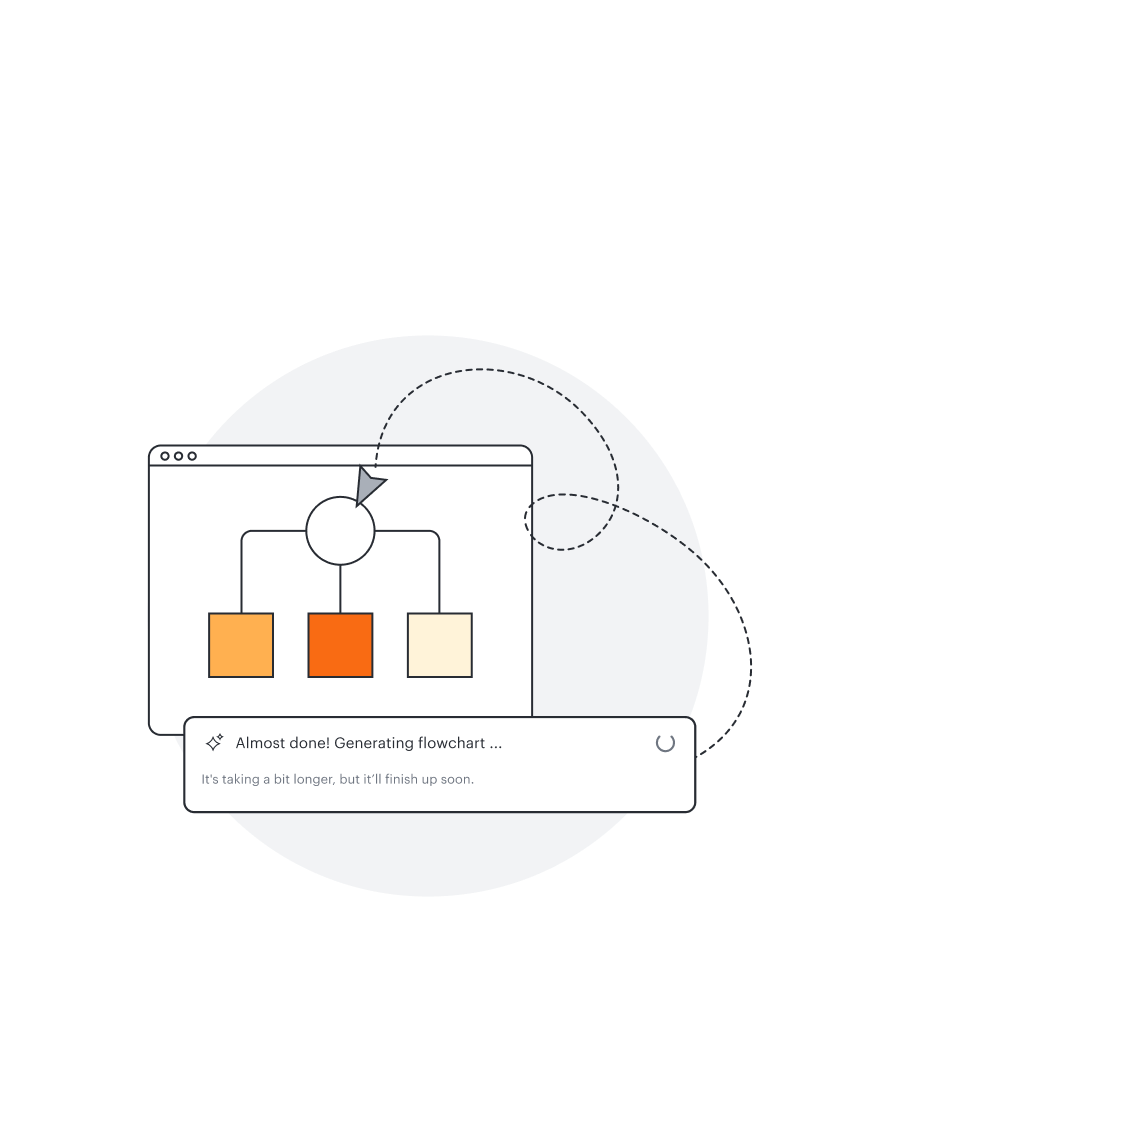
Diagram as code
Save time and eliminate errors by producing a custom process map or flowchart with Mermaid coding.
Assisted layout
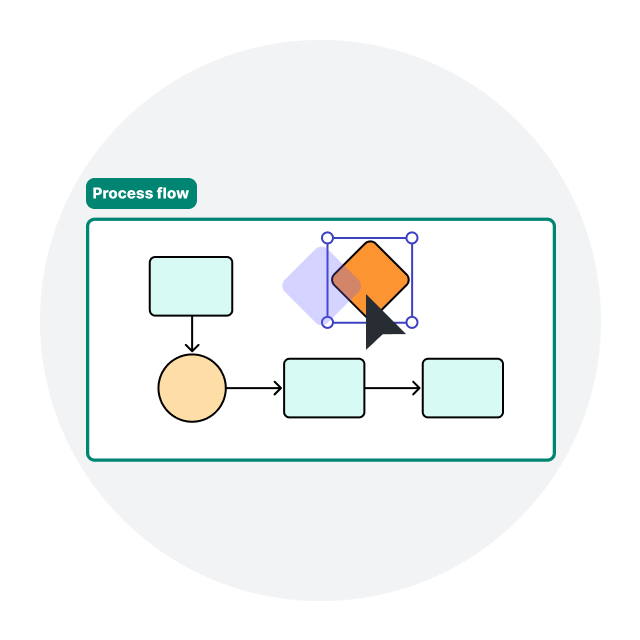
Organize content into Containers, Frames, and swimlanes with one click. Align objects automatically.
Integrations with leading apps
Streamline your team’s workflows by connecting Lucidchart with these featured apps—and many more.

Jira
Embed diagrams and other visual documentation in Jira tasks, projects, or issues to keep everyone aligned.
Learn more
Notion
Create a single source of truth by embedding Lucidchart documents in your Notion pages.
Learn more
Salesforce
Use Lucidchart’s exclusive Salesforce shapes and templates to standardize documentation.
Learn moreAdditional resources
Collaborating with intelligence
Understand the importance of intelligent features for visual collaboration.
Intelligent Diagramming badge
Learn how to create dynamic, data-backed diagrams to visualize anything.
Creating a single source of truth
Build a central repository for your teams’ documents, data, and information.
