Create technical diagrams to clarify complexity
Visualize the details of your work. Use Lucidchart to document complex processes by creating visuals that increase clarity and efficiency.


Build with data
Bring in data from outside sources to build diagrams, and gain insights by putting data into a visual context.
The perfect toolkit for technical diagramming
Create robust entity relationship diagrams

Customize your technical documentation

Standardize documentation across teams
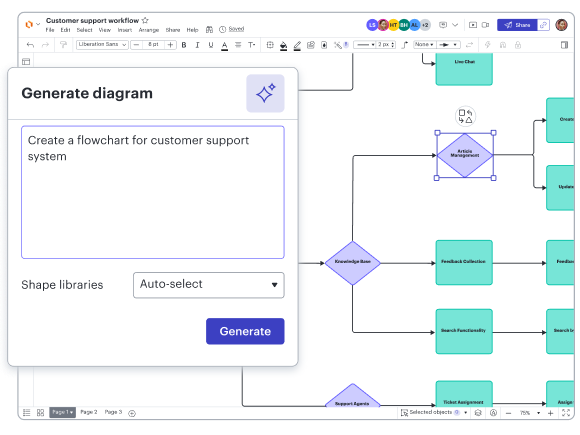
Create AI-powered flowcharts
Features for visualizing systems and structures

Custom templates
Create predefined templates to increase alignment, consistency, and scalability across projects.

Shape libraries
Use existing shape libraries for Salesforce, enterprise architecture, and more—or customize your own.

Exports
Export diagrams in SQL or Quickbase formats for easy collaboration between design and development teams.

Imports
Import a database or Salesforce schema and visualize changes before implementing them.

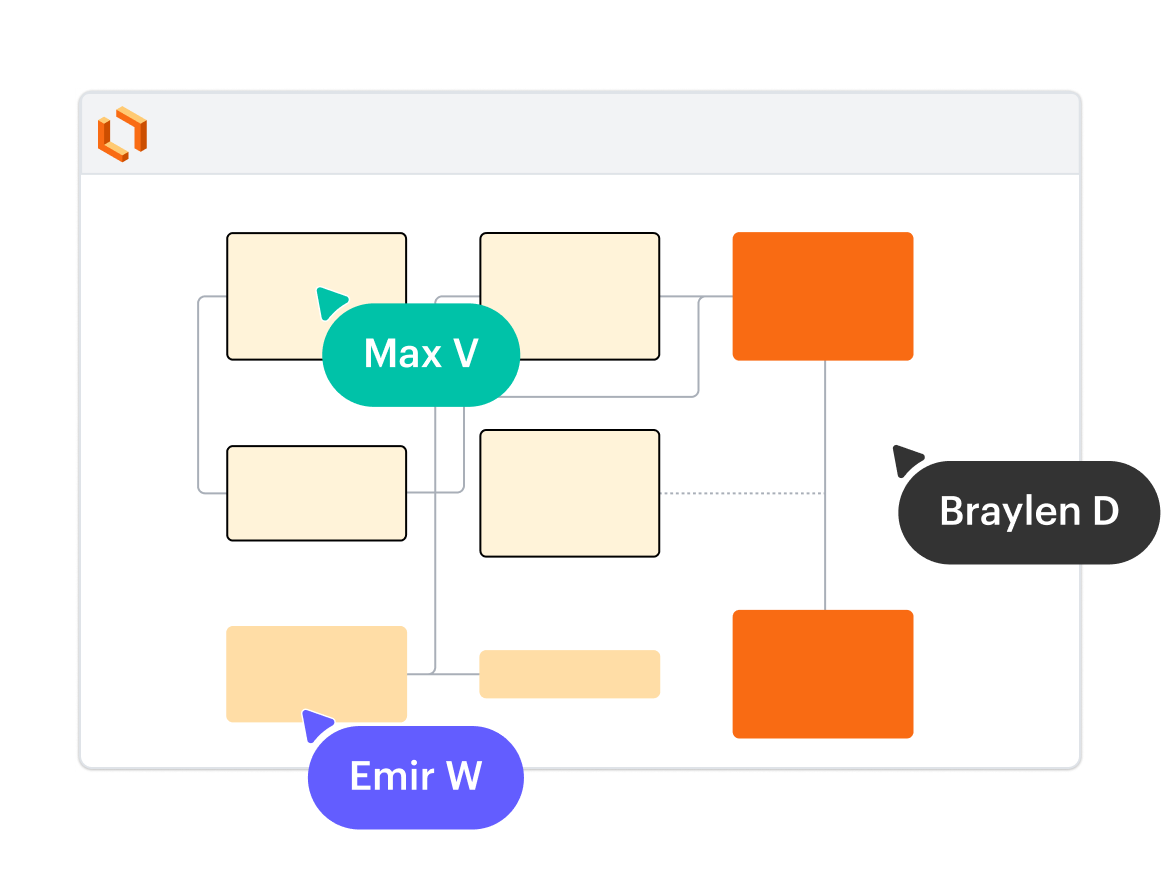
Real-time editing
Streamline work by enabling multiple collaborators to create and edit the same diagram at once.

Conditional formatting
Transform data by visually highlighting patterns and insights for quick comprehension at a glance.
Integrations with leading apps
Streamline your team’s workflows by connecting Lucidchart with these featured apps—and many more.

Confluence
Enrich Confluence spaces and pages with Lucidchart documents to improve context, clarity, and collaboration.

ServiceNow
Visualize your portfolio by generating Lucidchart diagrams from your ServiceNow APM data.

Jira
Embed diagrams and other visual documentation in Jira tasks, projects, or issues to keep everyone aligned.