Visualize your organization and Agile teams
Get a visual understanding of how your organization operates. Use Lucidchart to create dynamic org charts, organize Agile teams, and evaluate team resources.
Get started![A conceptual image showing an org chart created in Lucidchart with employee profile pics](https://corporate-assets.lucid.co/chart/4f2d134c-3515-4f9e-b599-70c558bccbdd.png)
Visualize your org
Add images and filters to easily see, understand, and manage your entire organizational structure.
1 of 3
The perfect toolkit for visualizing your org
![A conceptual image showing an org chart and team budgets generated in Lucidchart from imported data](https://corporate-assets.lucid.co/chart/f67040f6-106d-4ee9-915c-71e64e394f5d.png)
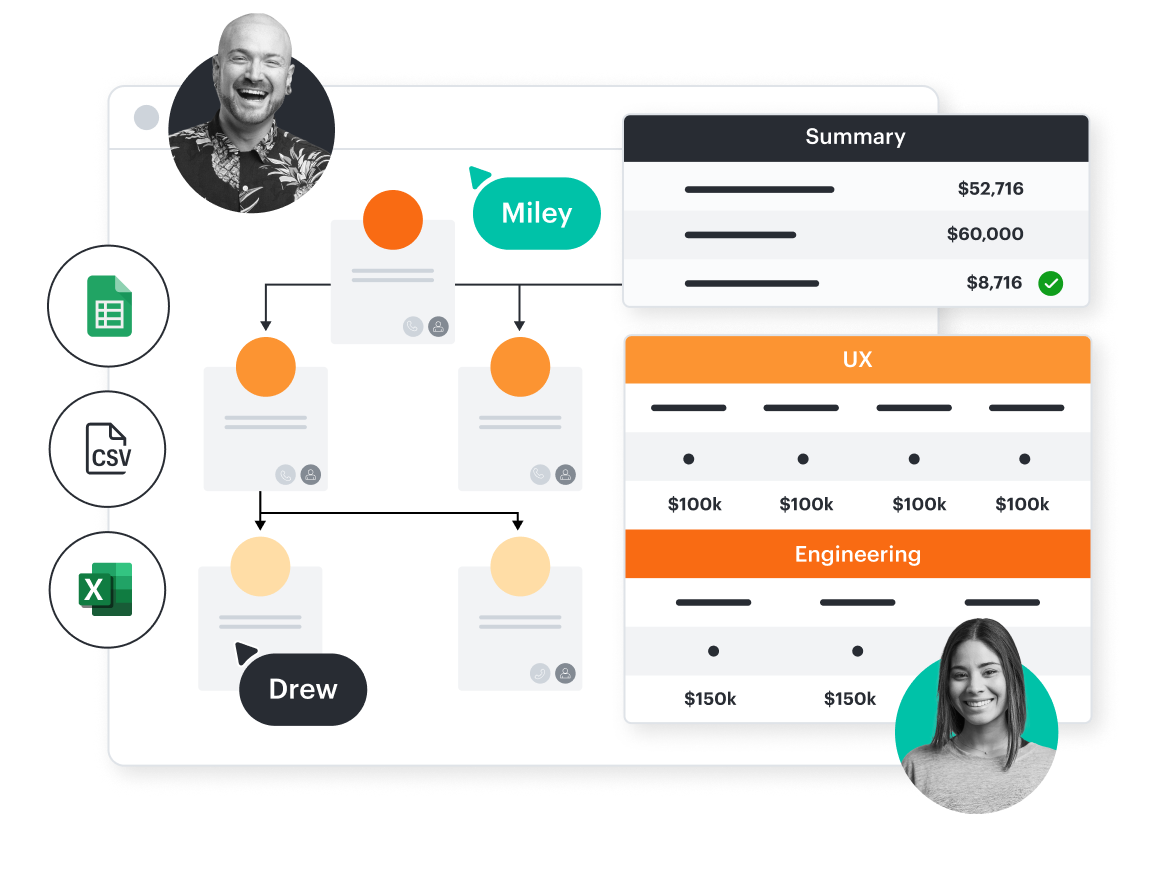
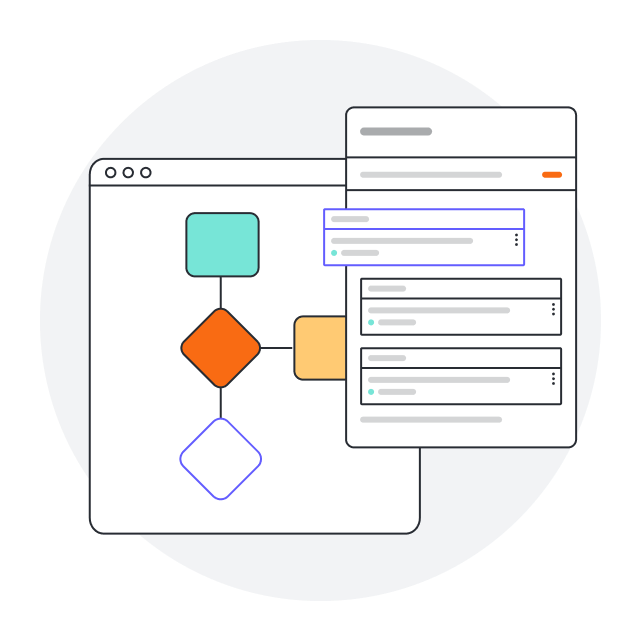
Build with data and automation
Generate org charts automatically from CSV imports, use a customizable template, or build from scratch. Improve transparency and decision-making with data overlays.
![A conceptual image showing an org chart with the shapes menu open on the Lucidchart canvas](https://corporate-assets.lucid.co/chart/cec5de89-f4c1-4e94-bebb-9ef5af9cbf79.png)
Optimize your org structure
Streamline team reorganization by easily dragging, dropping, testing, and sharing new structures. Elevate optimization with collaboration and versioning.
![A conceptual image showing Visual Activities, a diagram with swimlanes, and commenting in Lucidchart](https://corporate-assets.lucid.co/chart/e72e6f9f-e4dd-415c-b8d2-57c5c6e1e730.png)
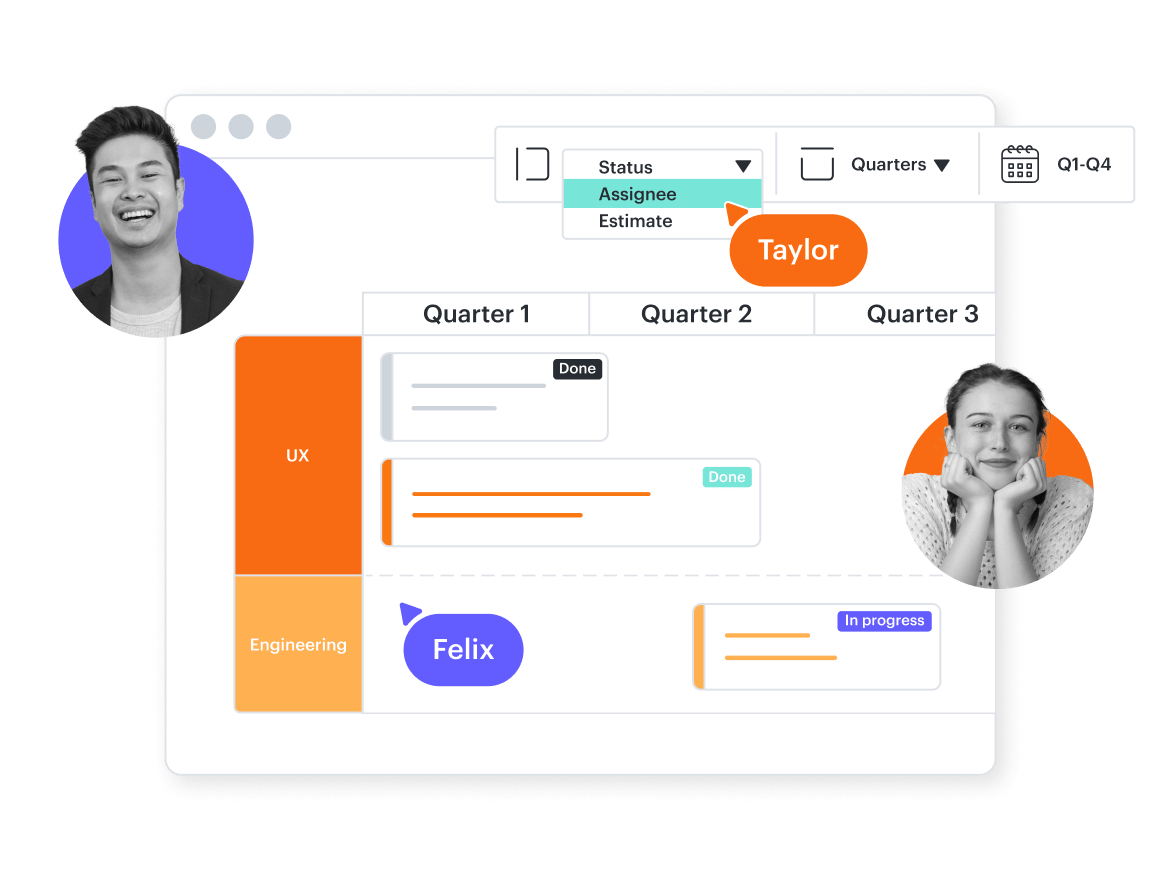
Align Agile teams with strategic initiatives
Optimize Scrum team dynamics. Use Visual Activities and more to align roles, prep for sprints, and empower teams for seamless transitions within Agile frameworks.
![A conceptual image showing project planning being organized by quarter and by team in Lucidchart](https://corporate-assets.lucid.co/chart/6157fba6-bd80-4679-b0c9-47c9784b8dc1.png)
Gain organizational clarity
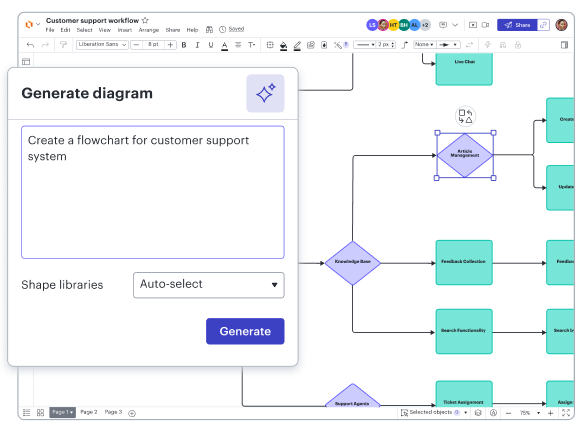
Create a dynamic blueprint of your business structure, then use data overlays to envision the future by identifying skills gaps, implementing talent development programs, and more.
Features for visualizing org structures
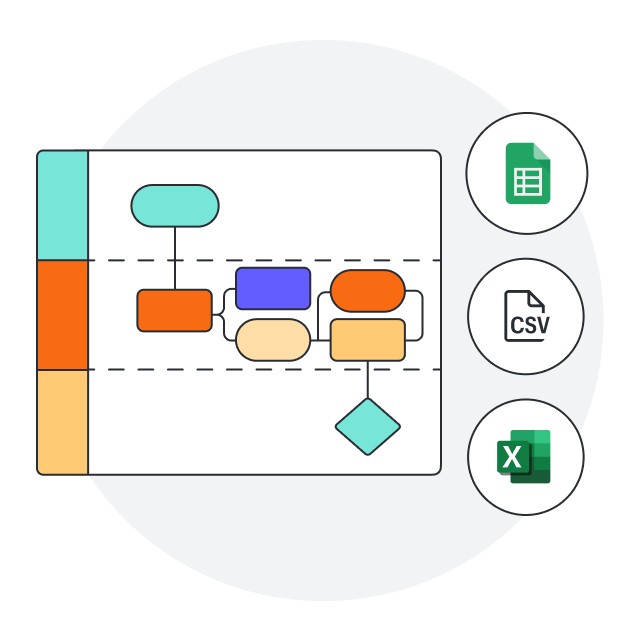
![](https://corporate-assets.lucid.co/chart/4cfa1ac5-1d40-4621-8e01-01ca781d96c7.png)
Data linking
Enhance accuracy by linking visualizations to data within Google Sheets, Excel, or CSV files.
![](https://corporate-assets.lucid.co/chart/924f3cea-89f2-42c4-b5a4-7a0230ca1f90.png)
Revision history
Collaborate confidently—view changes, revert to prior versions, and ensure charts are up to date.
![](https://corporate-assets.lucid.co/chart/421c81cc-80cc-4eee-9dd6-9456c914f3d8.png)
Group view
Use group view to visualize employees within Scrum teams without impacting reporting structures.
![](https://corporate-assets.lucid.co/chart/9b0f2e67-ca1c-4432-bceb-3f90e5852a71.png)
Security
Set passcodes and expiration links to ensure documents are protected. Monitor who accesses docs and when.
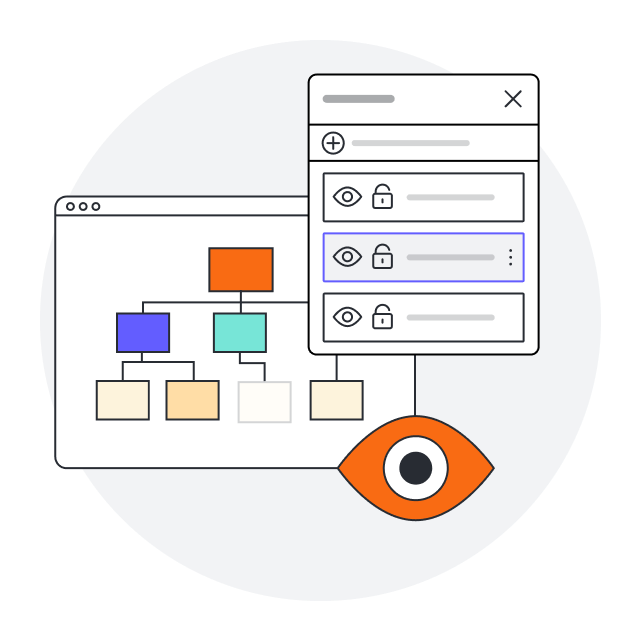
![](https://corporate-assets.lucid.co/chart/0872f4da-23f9-4e32-b4c0-4ef1f53c1bc5.png)
Layers
Add layers to visualizations for multiple levels, distinct visibility controls, and hierarchy management.
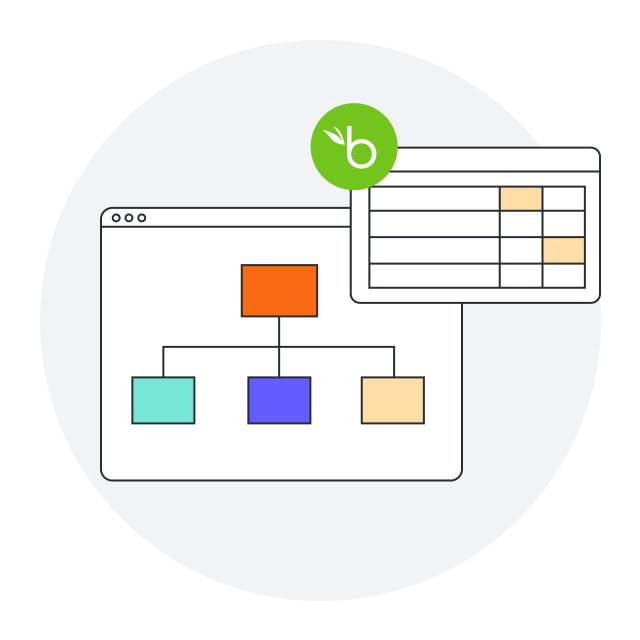
![](https://corporate-assets.lucid.co/chart/32eb50d1-b7d2-48f5-8f04-47402f6973ab.png)
Data imports
Generate org charts automatically by importing HR data from integrated apps like BambooHR.
Additional resources
How Lucid’s HR teams use Lucid
Find out how Lucid evolves its organization with data-driven visuals.
Managing Scrum teams in Lucidchart
Learn six steps for taking an Agile approach to organizational teams.