Online FAST diagram
Lucidchart is a visual workspace that combines diagramming, data visualization, and collaboration to accelerate understanding and drive innovation.
FAST diagramming software to understand product function
Visualise the logical relationships within an element or system
The acronym FAST (Functional Analysis Systems Technique) denotes a method used to develop a visual depiction of the logical relationships between the various functions of a project, product, process or service. It enables people from different technical backgrounds to communicate effectively and solve problems requiring multidisciplinary considerations. Lucidchart’s creative tools, templates, and open canvas are ideal for creating FASTdiagrams that identify and convey how functions are linked and work together
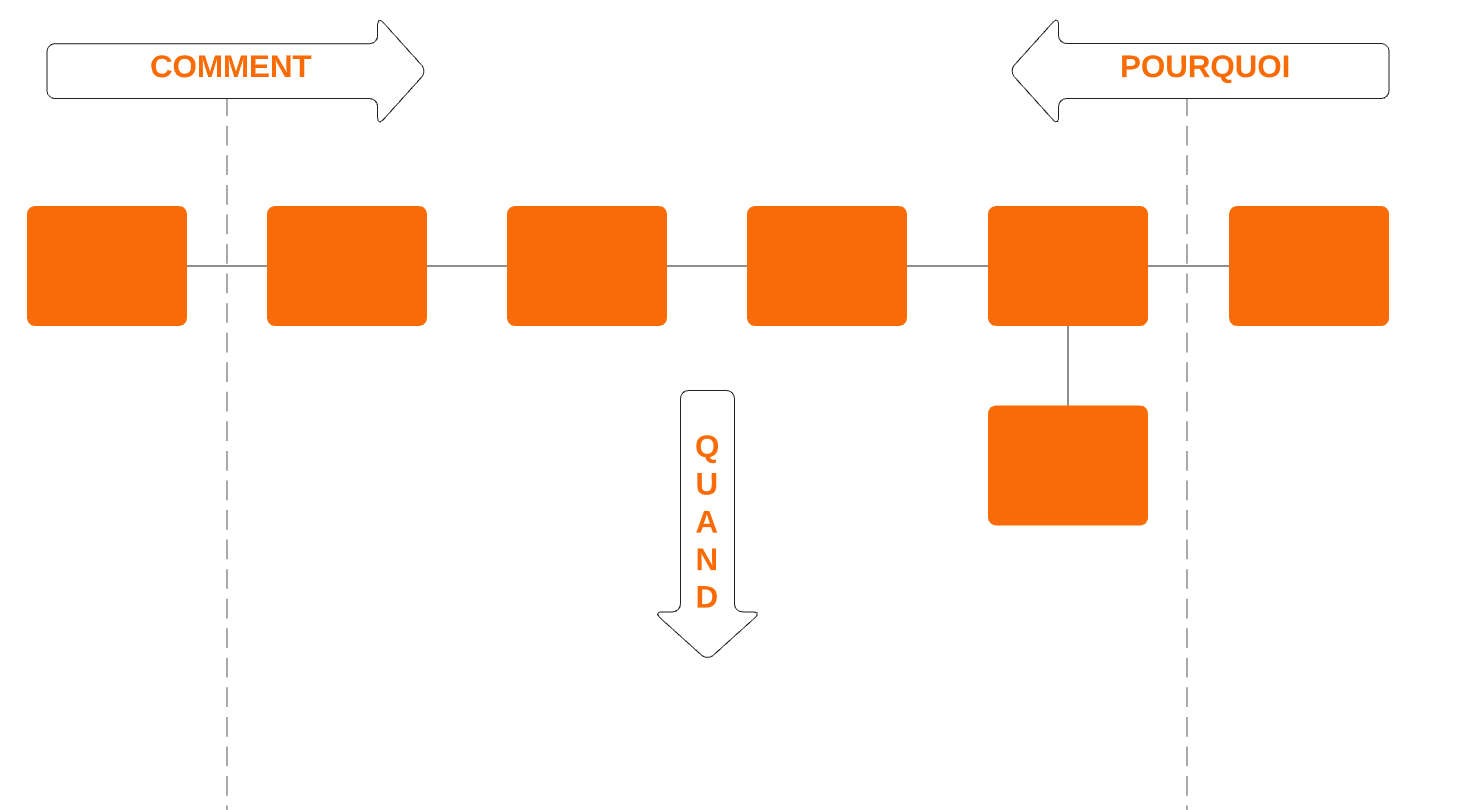
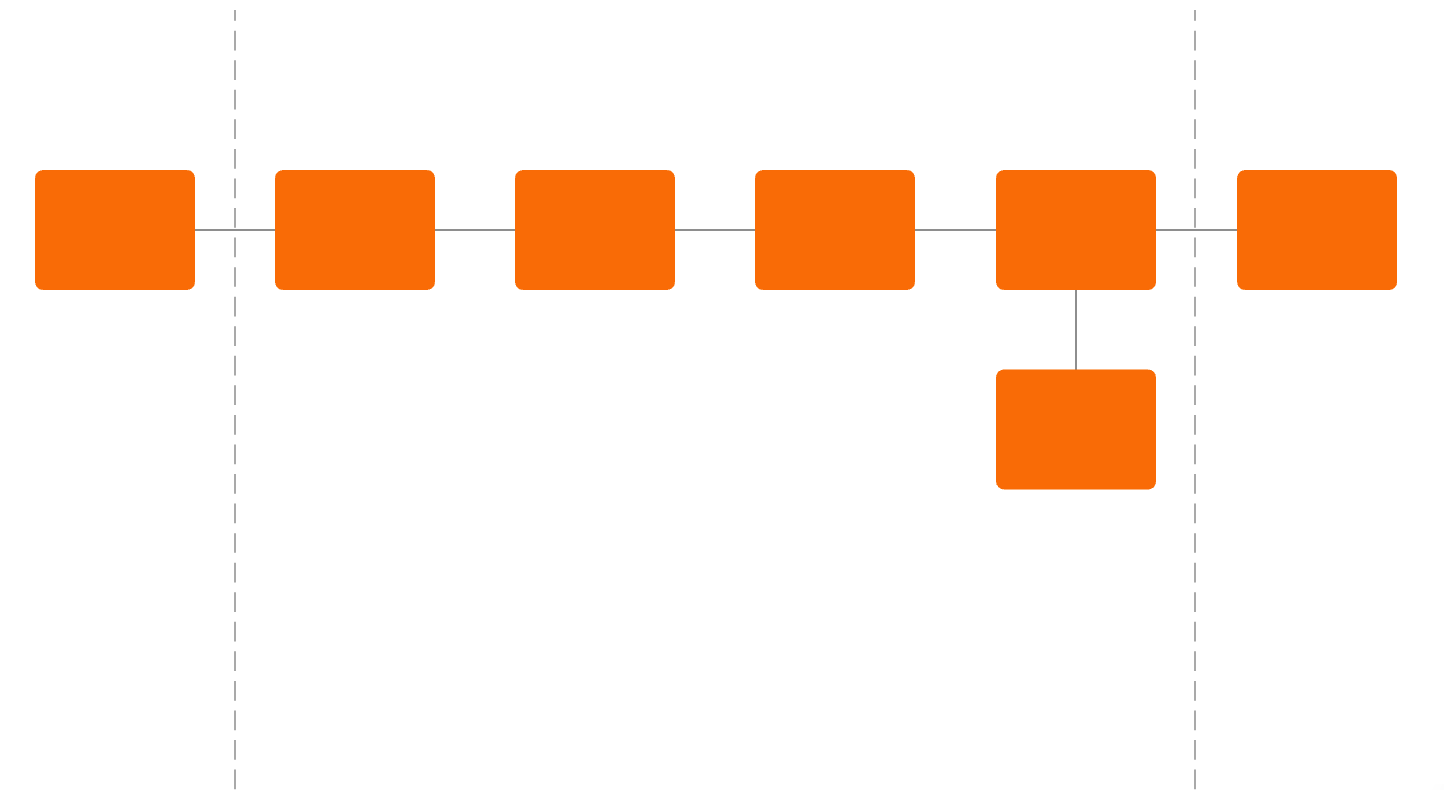
Create a FAST diagram online to answer the questions “how” and “why”
To create a FAST diagram, ask the questions “how” and “why” concerning the structures and functions of your system. Starting with one function, add shapes and arrows to your canvas to depict how this function is performed, from left to right. Then, map out each function’s “why” from right to left. Once you’ve identified your primary and secondary paths, functions can be arranged from top to bottom on your canvas according to “when” functions take place.
Communicate effectively with multidisciplinary teams
The FAST diagram makes it easy to work effectively within multi-disciplinary teams. With your FAST diagram easily available to your entire team, you can identify problems based on clear-cut visuals. Organise even the most complicated relationships so that your entire team can understand each function at a glance. Our user-friendly tools and formatting options highlight both core functions and missing functions within your product, so you can get to work on creating solutions.
How an online FAST diagram improves creativity
Developing a FAST diagram online can help any team develop a common understanding of a product or project while defining and clarifying the problem at hand. Use your FAST diagram to give your cross-functional team tools to understand relationships between functions, so you can improve communication and build consensus moving forward. With your function analysis clearly mapped out, you can stimulate creativity as you brainstorm solutions to any deficiencies or problems.
- Develop a common understanding of the project
- Define, simplify, and clarify the problem
- Identify the core function of the system and any missing functions
- Organise and understand the relationships between functions
- Improve communication and build consensus
- Stimulate creativity
Modify and customise your FAST diagram online in real time with your team
Simplify teamwork with an online FAST diagram with real-time updates, @ mention commenting, and chat features built into the Lucidchart editor. If you want to send your FAST diagram to others once you’ve refined it, simply share your visual via a published URL, embed it in a wiki, or use presentation mode to create professional presentations. Insert your online FAST diagrams into Google Slides, Confluence, or Slack to give your entire team easy access to your function analysis.
How do I create a FAST diagram online with Lucidchart?
Start from scratch or select a FAST diagram template
Begin your diagram by dragging and dropping individual shapes into a work area, or select and customise a FAST diagram template from our template gallery.
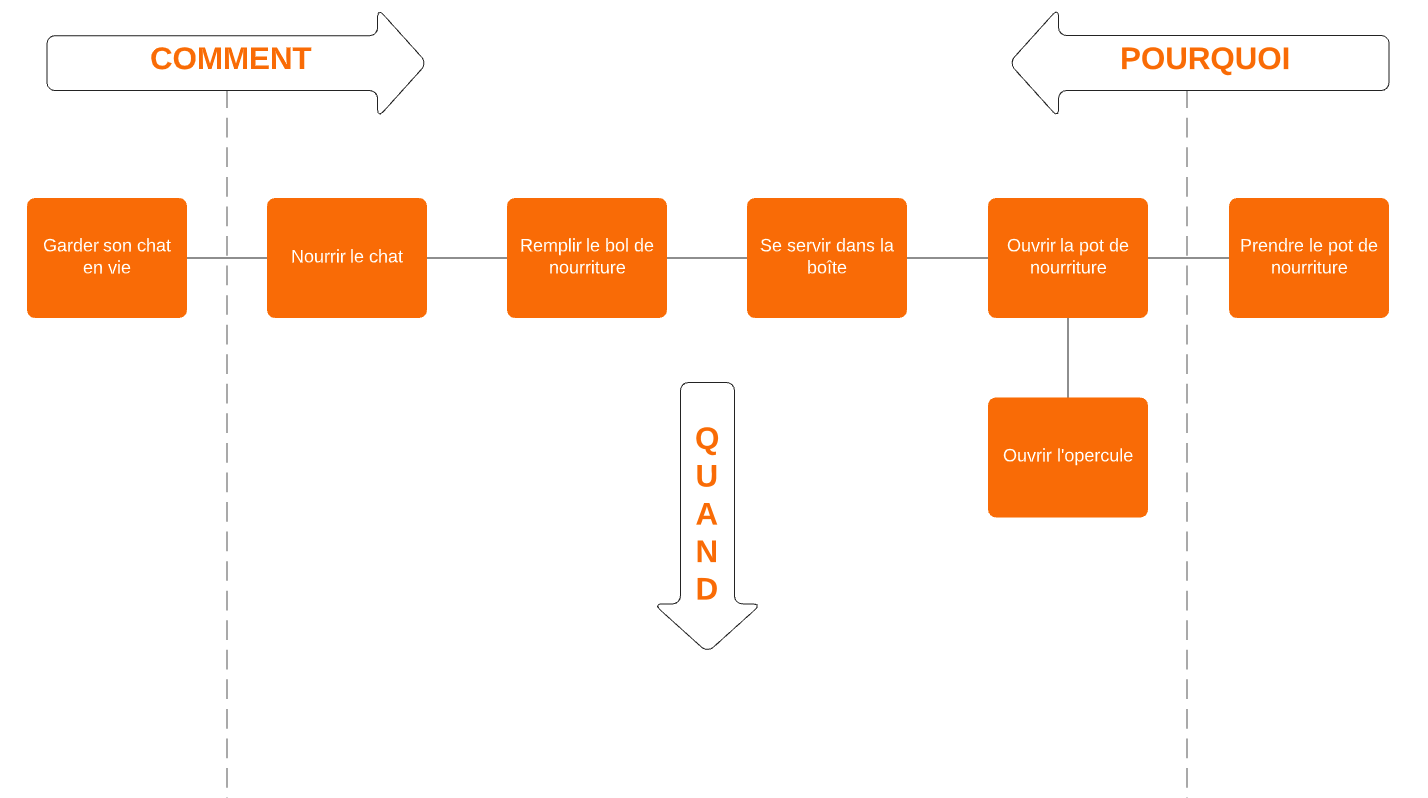
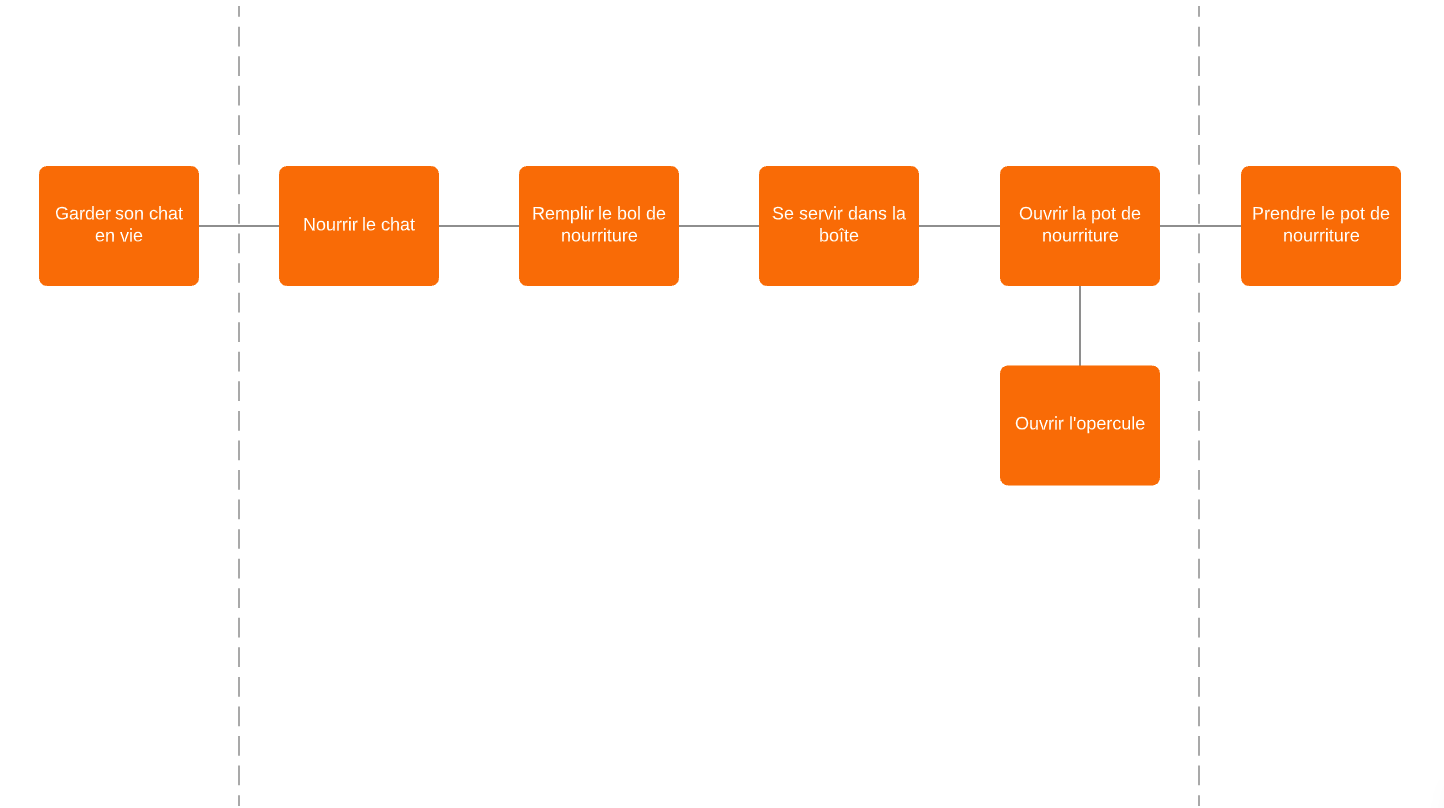
Develop functions by asking “how” and “why”
Answer the question “how is the function performed?” by placing the answer on the right in the form of an active verb and a quantifiable noun. Repeat the same logic with “why,” from right to left, by asking yourself “why is this function used?”
Identify missing or redundant functions
When the logic doesn’t work, identify missing or redundant functions or change the order until it begins to make sense.
Identify functions that occur at the same time
To identify functions that occur at the same time, ask yourself when the function is performed and what the function does or brings about.
Customise and modify your FAST diagram online in real time
Easily customise, modify, and share your diagrams, anytime and with anyone. Work with your colleagues on the same document at the same time, thanks to real-time updates.
Frequently Asked Questions about creating a FAST diagram online
How can I share the final version of my FAST diagram online as a professional presentation?
Can I add my FAST diagram to other applications?
How long does the free trial last?
Get off to a good start with our online diagram tool
Used by millions across the globe
"It’s the best online diagramming software on the market. The competition is trailing".

4.5/5 stars 650+ reviews


