
Online Graph Maker
Use Lucidchart to create beautiful charts online. Get started with templates, link data, and share your graphs with relevant stakeholders to get everybody on board.


By registering, you agree to our Terms of Service and you acknowledge that you have read and understand our Privacy Policy.


Turn data into visualizations that drive the right decisions
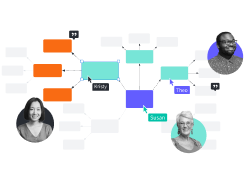
Working visually can help your team to better understand your goals and strategies as a group and help you brainstorm ideas that will help you move forward together.

Versatile tools

Data linking

Get a head start with templates

Ease of use

Built for collaboration

Ratings
See Lucidchart in action
master the basics of Lucidchart in 5 minutes
- Create your first online flowchart from a template or blank canvas or import a document.
- Add data to your visualizations.
- Use custom styling to make sure your graphs are on-brand.
- Get your team on board and start collaborating.
- Share with relevant stakeholders in any format you desire.
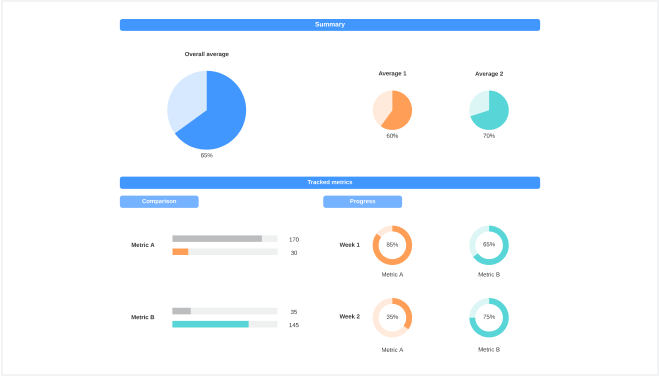
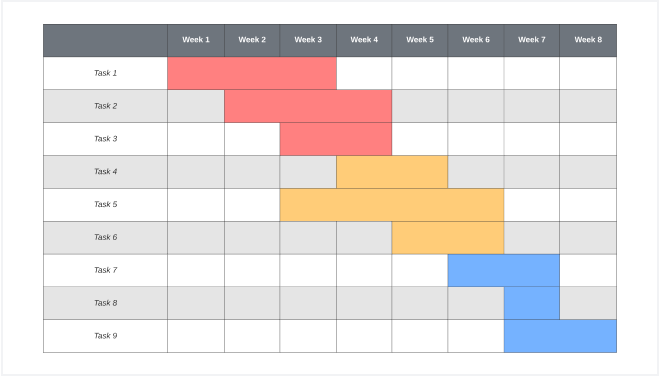
Graph and chart templates
Creating a graph online is simple with ready-to-use templates.
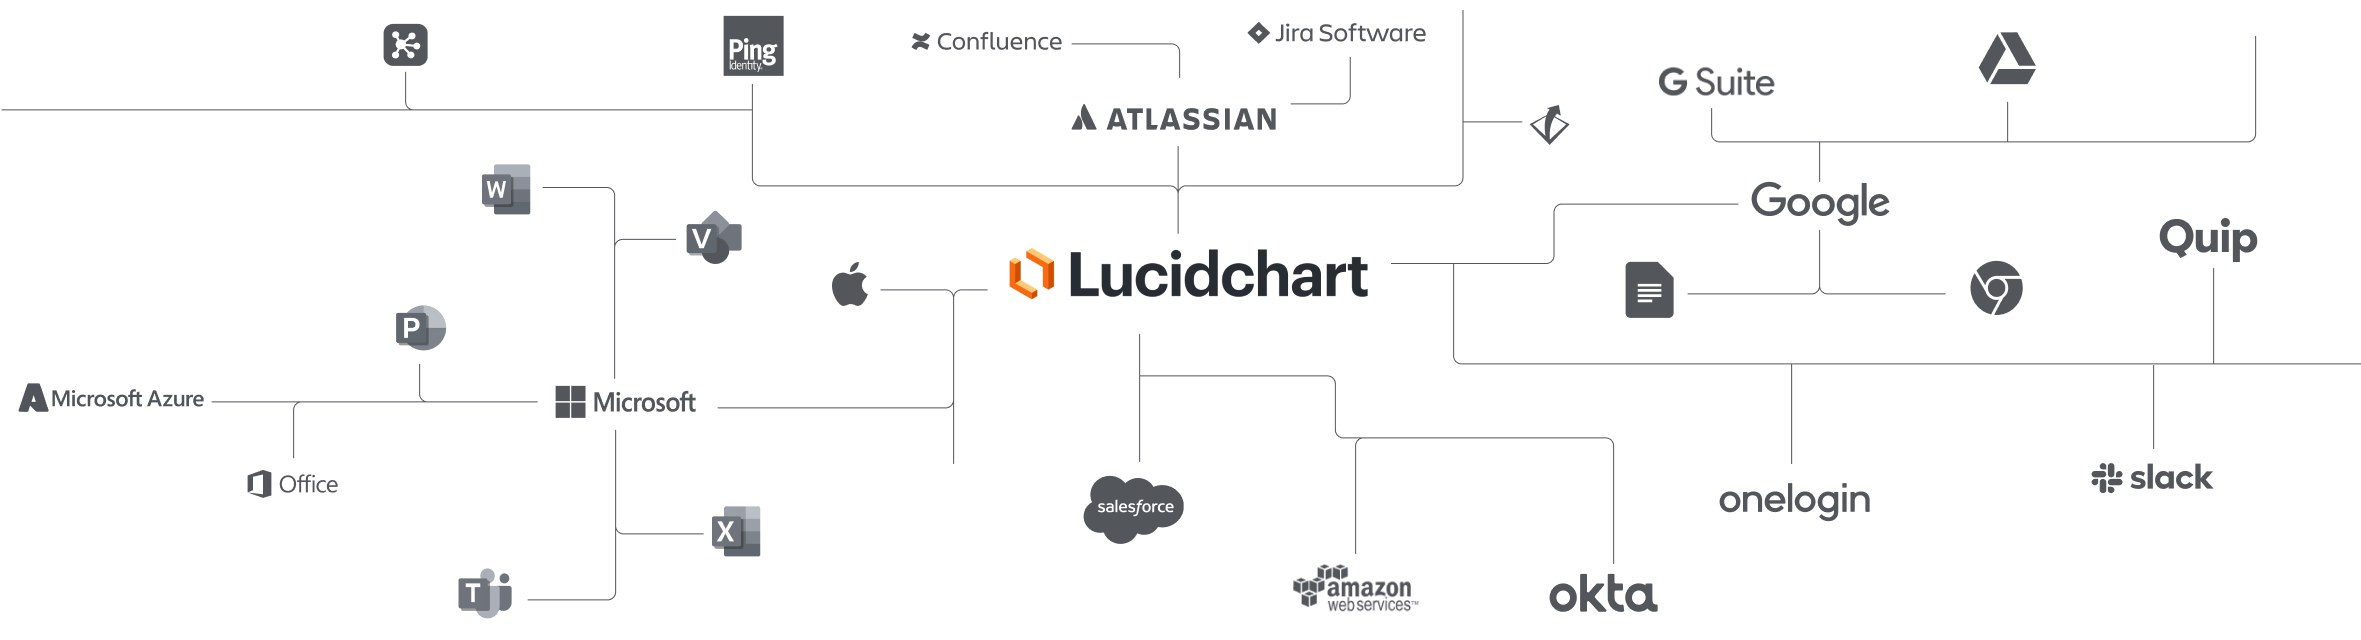
Lucidchart integrations
Connect Lucidchart to your favorite industry-leading apps.
See why teams use Lucidchart
Diagram, visualize data, and collaborate all in one platform.
Collaboration
Clarity
Alignment

Better together
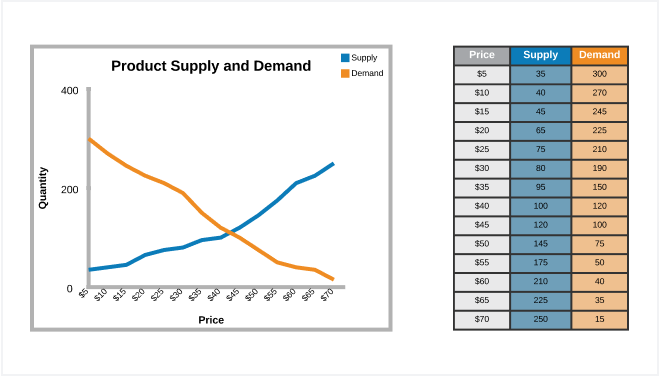
What is a graph?
A graph is a visual mathematical representation of two or more datasets. Graph types include line charts, pie charts, Gantt charts, Venn diagrams, and many more. Graphs are frequently used together with other diagrams to help stakeholders make data-driven strategic decisions and stay aligned on what is happening in the business.
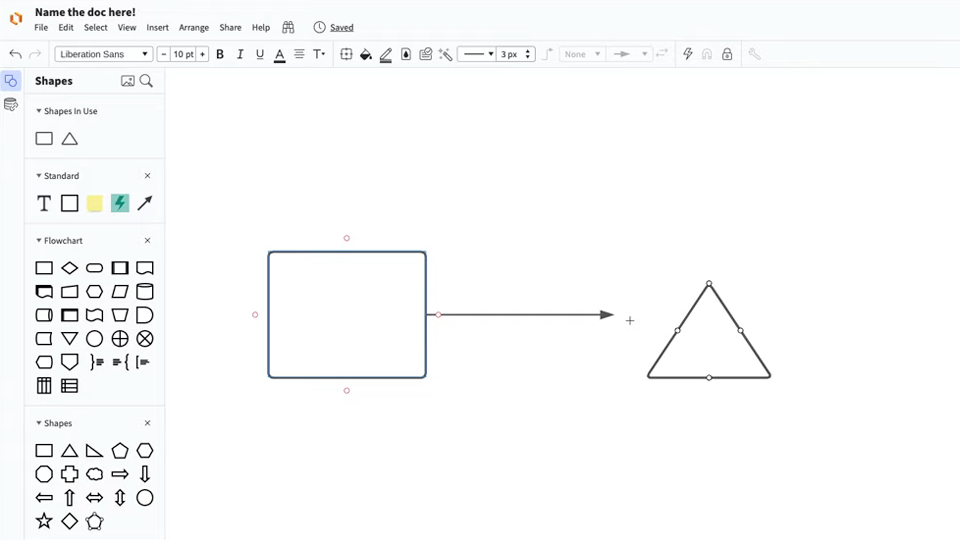
How to make a graph in Lucidchart
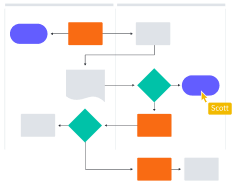
Pick your visual
Decide which visuals will best tell the story of your data based on your specific use case.
Templates
Select one of our many graph templates to get a head start as you create a graph—or start your visual from scratch using Lucidchart’s drag-and-drop interface.
Link data
Add live data to your graph online using our data linking feature.
Add custom styling
Customize your graph to include specific colors, images, and more that accurately reflect your business.
Collaborate
Get your team and other significant stakeholders on board and work together to take your graphs to the next level.
Share
Add other diagrams such as process maps or flowcharts to complete your narrative. Once your work is ready, share your narrative with anyone who needs to understand it.