
Lucidchart is the visual diagramming solution for teams. Collaborate in real time to get aligned, boost productivity, and bring your big ideas to life. Check out these tips and tricks for making your work easier as you build, share, and present diagrams.
If you'd like to dive deeper into these features and follow along with one of our product pros, visit our Lucid Learning Campus to explore our free courses.
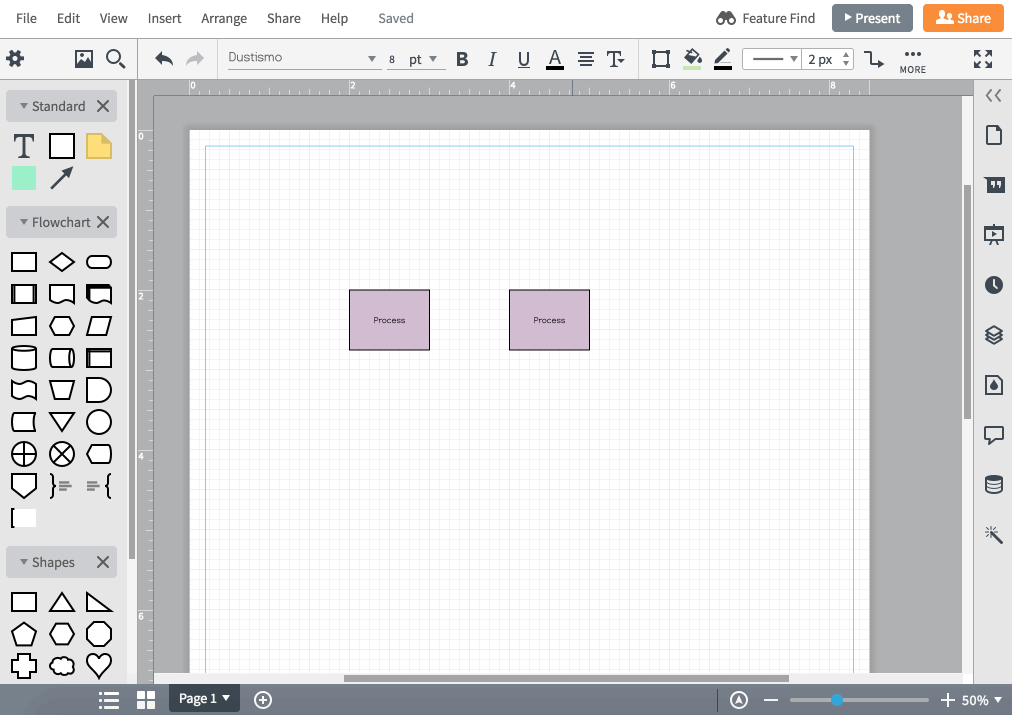
1. Easily style shapes
When creating a diagram, chances are you have specific fonts and colors you want to use throughout. You could go back and update these preferences manually, but there's a better, more efficient way.
Before you drag any shapes onto the canvas, choose the font, font size, font color, and line style from the Properties bar at the top of the editor. After doing so, your chosen styling is automatically applied to every shape you drag and drop onto the canvas.
Similarly, if you want to change the formatting on a Lucidchart template or if you get halfway through your diagram before you decide that you hate the font, simply click Select > All shapes, and then style your entire diagram the way you want.

2. Create clean diagrams
You may notice that as you drag shapes around, sometimes the connecting lines have a mind of their own. There's an easy hack for getting lines to make the most efficient connections between shapes: smart lines.
To create a smart line, rather than dragging and dropping a line directly to the edge of the next shape, pull the line just past the edge until the shape gets the blue “halo” effect. Release your mouse, and you’ve got yourself a smart line that will make smart connections.
3. Work faster with keyboard shortcuts
Make life easier with our nifty keyboard shortcuts. We’ve got quite a few, and you can view them all in the editor by clicking F1 or selecting Help > Hotkey Reference. Here are two of our favorites:
- To easily zoom in and out of your diagram, hold down the space bar and scroll up and down with your mouse—this is especially helpful when you’re dealing with large diagrams.
- To make more precise adjustments to your shapes, select the desired shape, hold down the Shift key, and use the arrow key for subtle movements that get your shape just the way you want it.
Ready for more? Watch this quick video of our top 5 keyboard shortcuts.
4. Expand your canvas
If you're creating a large diagram, things can start to feel pretty cramped on your canvas. But there’s a one-click solution for expanding your canvas. Select the Fullscreen button in the bottom right corner—all the panels in the editor will disappear, leaving you with an enlarged canvas for fleshing out all those ideas. Anytime you need to access the Toolbox, Properties bar, or any other feature, you can activate it by hovering over where it would normally appear in the editor.
5. Organize your diagrams with containers
Diagrams can get very complex as they involve more steps and people. An easy trick for keeping these diagrams organized and easy to read is to use containers or swimlanes. In the example below, each swimlane represents a different person and their responsibilities. Instead of making your diagram a color-coded rainbow to indicate who owns which step, you can simply place your shapes in the appropriate swimlane container.
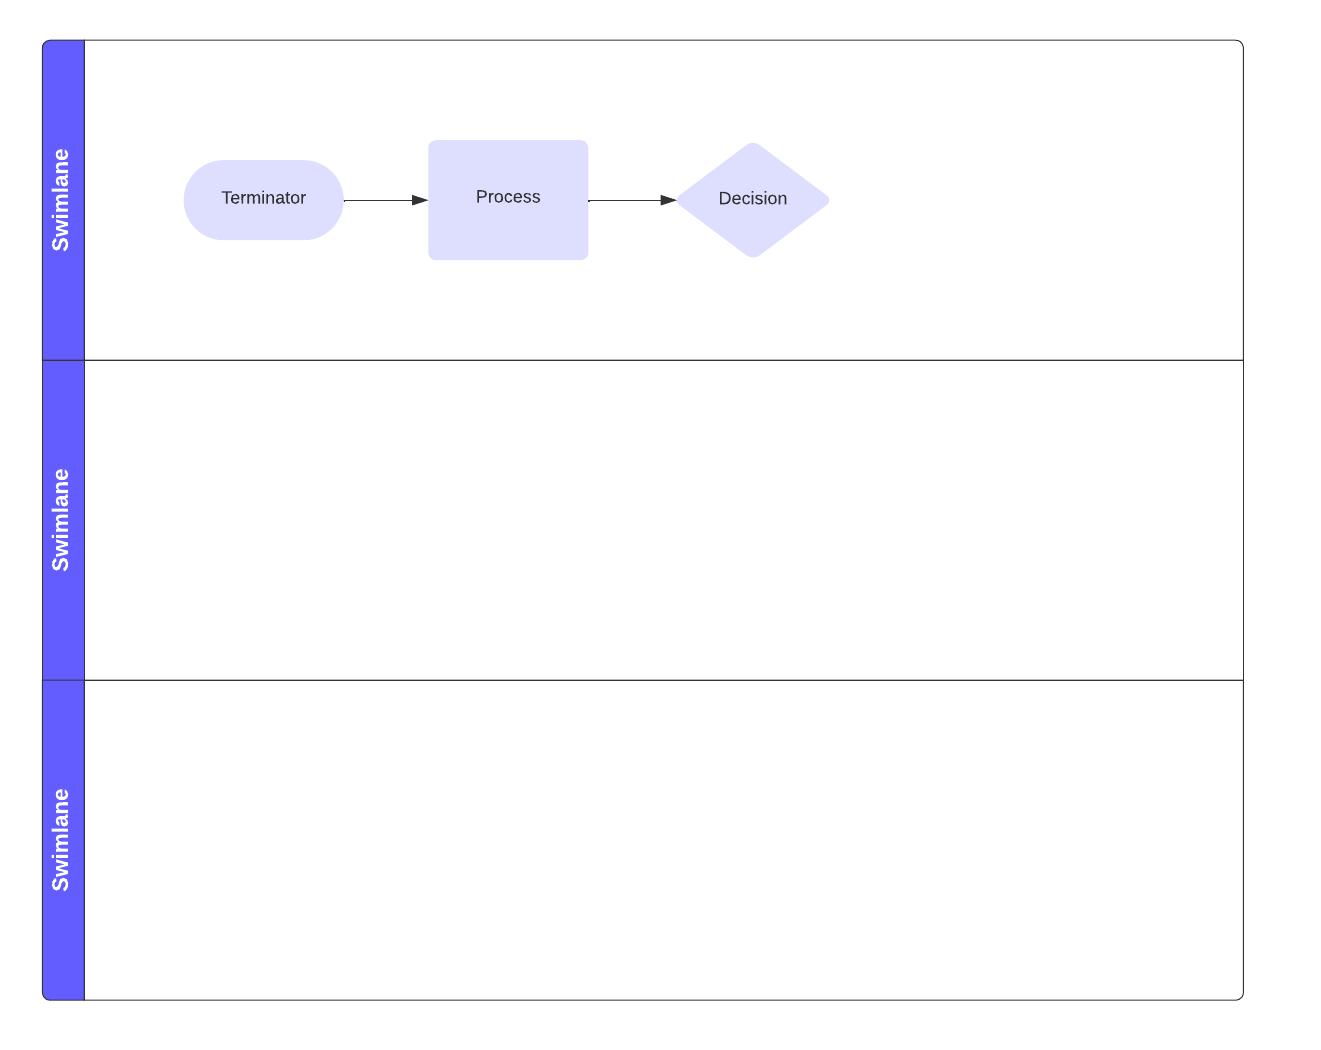
To access containers, click Shapes on the left side of the editor, and check the containers shape library under Flowchart. Containers are smart shapes, which means that when you drag and drop one onto the canvas, a gear icon appears in the top-right corner of the shape. Click the icon to increase the number of lanes or adjust the orientation of the shapes and labels.
6. Include links and layers for easy-to-read diagrams
There’s always additional detail you could add to a diagram. But what’s the point of creating a visual if you stuff it full of text? Provide all the necessary info while still keeping your diagram clean and easy to read using shape actions.
Select a shape, click the lightning icon in the Properties bar, and select an action for the shape. You can toggle, show, or hide layers, add conditional formatting, or link to an email.
Selecting the link icon (to the left of the lightning bolt) will give you the option to link to an external website, a specific page, or another Lucid document.

7. Collaborate without leaving Lucidchart
Once you’ve got a diagram built, you’ll want to gather feedback from others. Avoid giant email threads that lose or construe information by having these conversations directly in your Lucidchart document.
With our commenting feature, you can leave comments on specific shapes or the document as a whole. To make a shape-specific comment, select a shape, choose “Comment” from the right-hand Dock, and select the “+” symbol. You can even @mention in your comment to alert certain people that feedback or review is needed. To find the location of a comment, click the pin icon in the top left corner. You can also use our chat feature to hold conversations inside your document.
8. Add necessary context
When you have thoughts or feedback that need to stay permanently attached to a particular shape, use the notes function in Lucidchart. Right-click a shape, choose “Add note,” and include whatever information is needed. A grey notebook icon indicates that a shape has a note.
9. Present your diagram
Once you’ve received feedback and finalized your diagram, it’s time to present the system or process and get the buy-in you need to move forward. Instead of presenting the diagram all at once, use Presentation Builder to break your diagram up into a polished slide presentation.
Add more slides to your presentation by selecting “+ Add new slide” within Presentation Builder. A purple box will appear on the canvas—anything within that box will be included in that slide. Click “Present slides” to view your presentation. Presentation Builder lets you craft the story around a diagram and leaves you in control of your presentation.
10. Publish your diagram
Make your diagrams public by clicking the share button and choosing “Publish.” If you choose "Full document URL", you can generate a view-only link that allows anyone with the link to view your document. They can’t edit the diagram, which means you can make it available to as many people as you’d like while still having control over your document.
Explore more ways to share your Lucidchart documents.
Read moreAnd that’s a wrap. Ten Lucidchart features to instantly make your work easier and more productive. As you explore these features, share them with your team so you can boost efficiency and alignment.

Try out these Lucidchart features for yourself.
Let's goAbout Lucidchart
Lucidchart, a cloud-based intelligent diagramming application, is a core component of Lucid Software's Visual Collaboration Suite. This intuitive, cloud-based solution empowers teams to collaborate in real-time to build flowcharts, mockups, UML diagrams, customer journey maps, and more. Lucidchart propels teams forward to build the future faster. Lucid is proud to serve top businesses around the world, including customers such as Google, GE, and NBC Universal, and 99% of the Fortune 500. Lucid partners with industry leaders, including Google, Atlassian, and Microsoft. Since its founding, Lucid has received numerous awards for its products, business, and workplace culture. For more information, visit lucidchart.com.
Related articles
 3 Tips for Wow-Worthy Diagrams
Want to create diagrams that leave viewers in awe? In Lucidchart, it's simple to touch up your diagrams and make them wow-worthy. Just follow our tips involving the three C's: clarity, consistency, and contrast. Learn more!
 Top Lucidchart shortcuts
Let’s dive into some popular Lucidchart keyboard shortcuts to help you diagram with ease. Even if you’re a Lucid pro, you might be surprised at what you’ll learn.
 Customizing your Lucidchart diagrams (+ free course!)
Access the full course in Lucid Training Labs to view video training and other tools for customizing your diagrams.