Tree diagram maker
Visualize possible outcomes by creating a decision tree diagram in Lucidchart. Start with a template or build on a blank canvas.


By registering, you agree to our Terms of Service and you acknowledge that you have read and understand our Privacy Policy.


See what’s possible with our decision tree maker
Use visuals to simplify complex information. Make informed decisions by comparing the outcomes of related choices.

Conduct a decision tree analysis

Collaborate in real time

Get an easy-to-use decision tree tool with templates
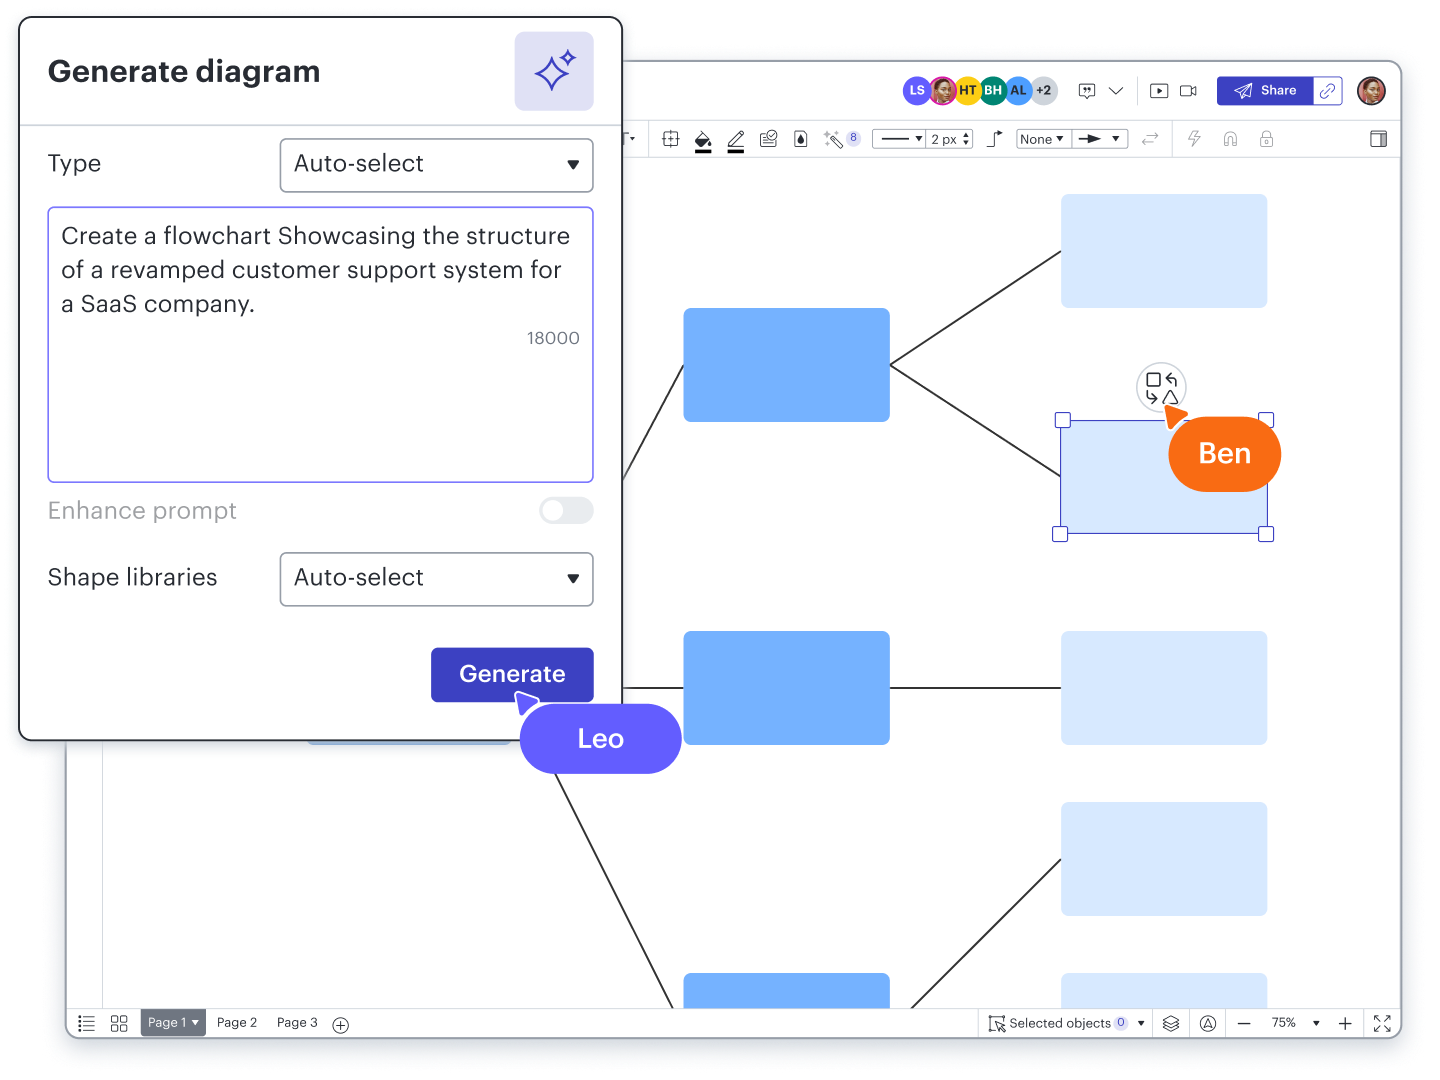
Generate diagrams faster with AI

Boost productivity with 100+ integrations
Decision tree software feature highlights
Real-time collaboration
Real-time collaboration
Data linking
Data linking
Conditional formatting
Conditional formatting
Layers
Layers
Revision history
Revision history
Shape libraries
Shape libraries
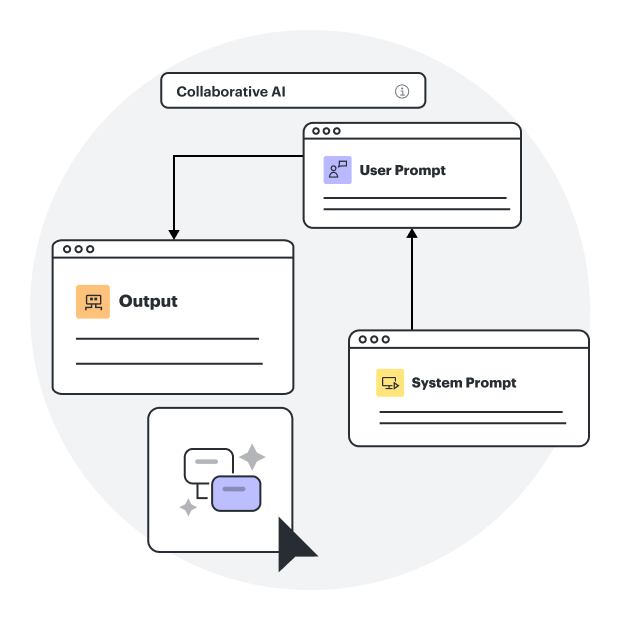
AI prompt flow
AI prompt flow


Decision tree software feature highlights
Streamline work by enabling multiple collaborators to create and edit the same diagram at once.
Decision tree diagram templates
Get inspired and create decision tree diagrams faster with free, customizable templates.

Getting started in Lucidchart
Follow along with this video tutorial and learn how to make any type of diagram in Lucidchart.
Why teams choose Lucidchart
As an intelligent diagramming application, Lucidchart provides simple yet powerful capabilities for visualizing information.

Collaboration. Bring teams together side by side on a shared canvas from anywhere in the world.
Alignment. Build transparency and shared understanding of how a team or company works.
Large-scale change. Increase visibility, standardization, and knowledge sharing across your entire org.
End-to-end workflows. Upgrade to the Lucid Suite for a complete, connected visual collaboration solution.


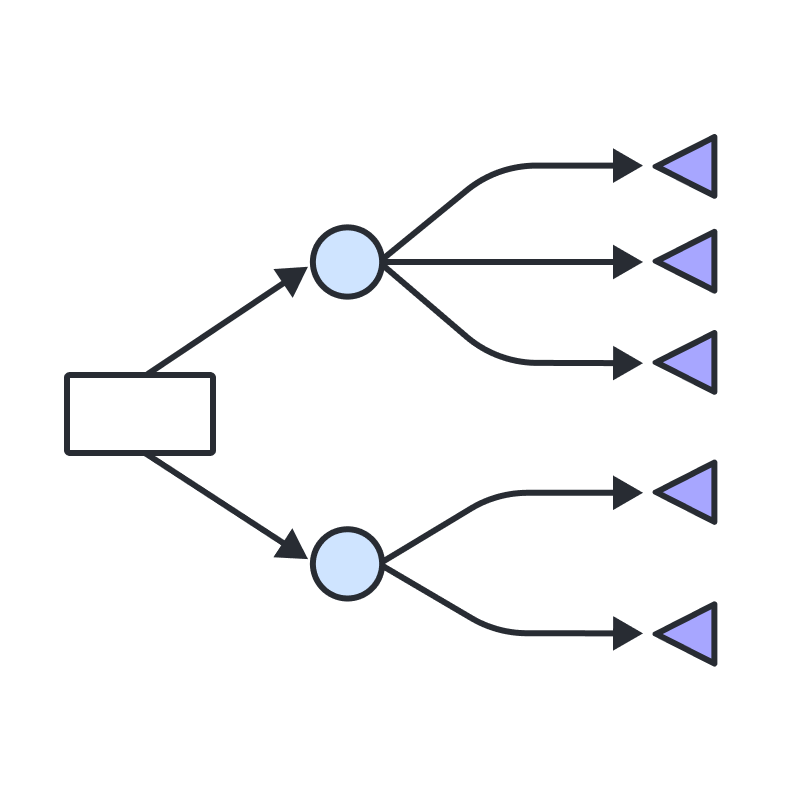
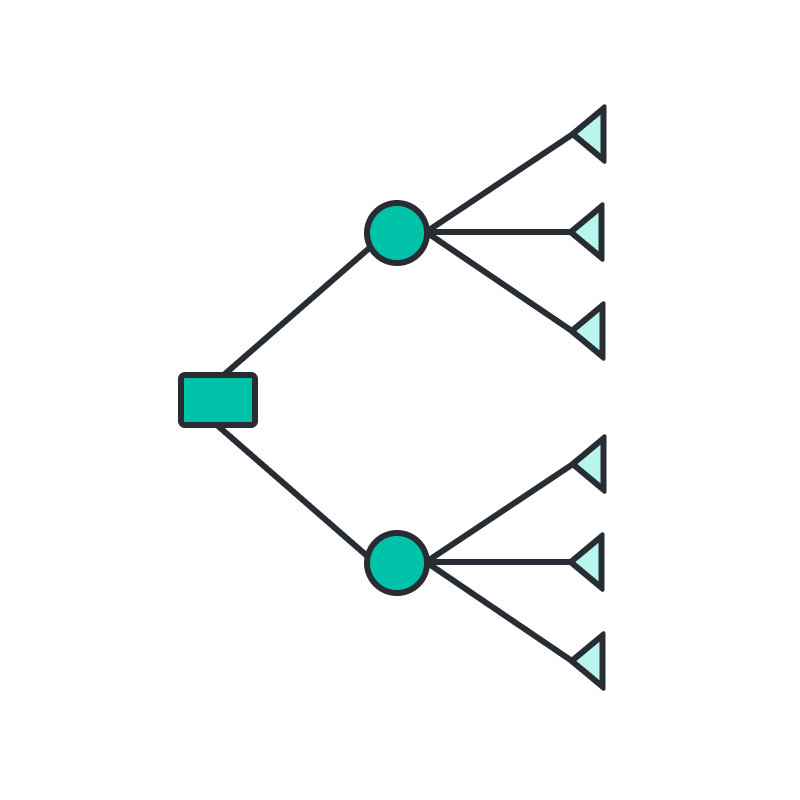
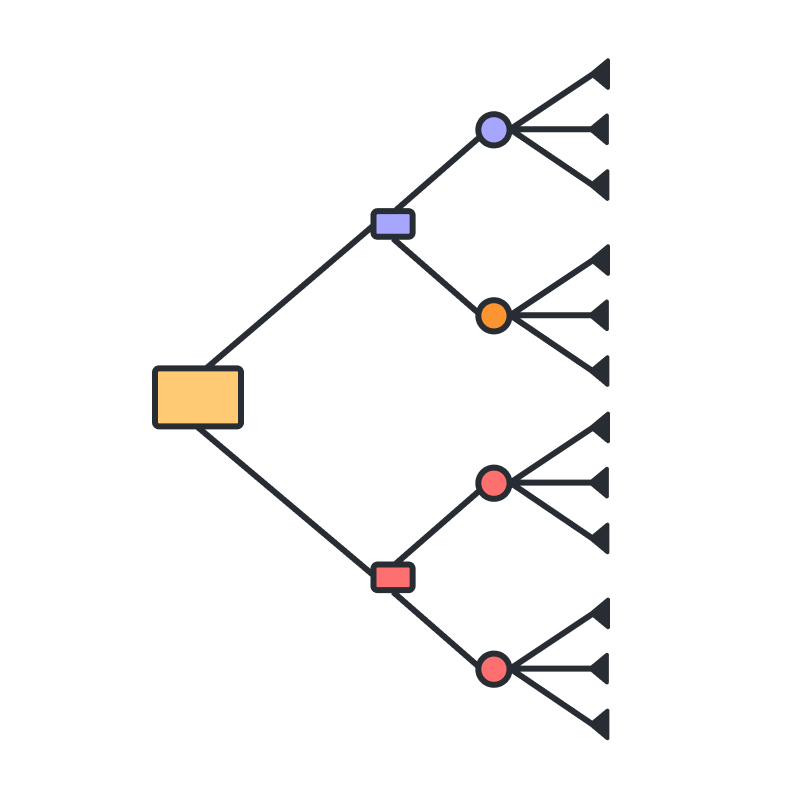
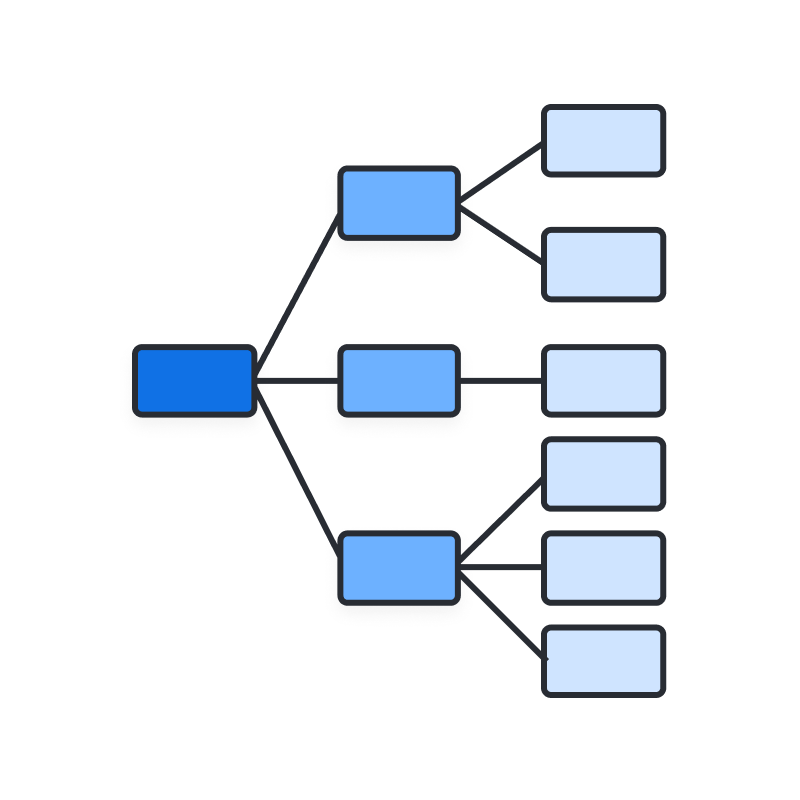
What is a tree diagram?
A tree diagram (or decision tree diagram) is a map of possible outcomes in a series of related choices. It’s a tool for weighing decisions about future actions based on cost, probability, and benefit. The two main types of tree diagrams include classification trees and regression trees. Use a classification tree to evaluate yes or no answers and a regression tree to predict numeric values based on data.
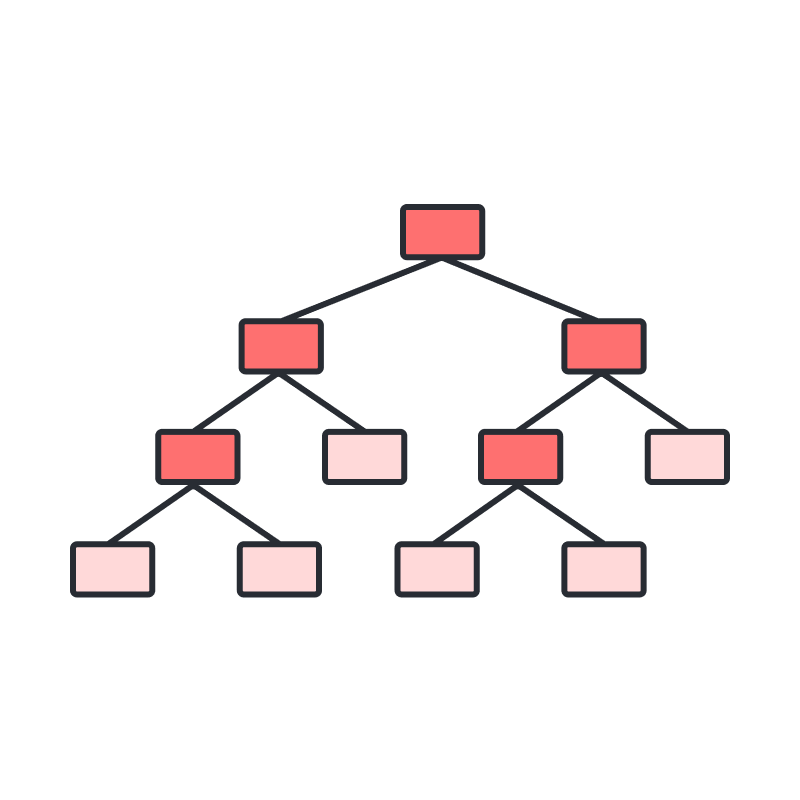
How to make a tree diagram
Open our tree diagram generator
Define and add the root node
Add child nodes
Label the nodes
Connect nodes with lines
Keep it organized
Additional resources

Lucid Training Labs
Learn visual collaboration skills in free, self-serve courses and live training workshops.

Lucid Community
Connect with other users to share tips and insights. Provide feedback to Lucid’s product team.

Help center
Find detailed articles with step-by-step instructions for using specific Lucid features.

Lucidchart tutorials
Go to the Lucidchart tutorials playlist on YouTube for video training on various topics.
AI diagramming hub
Get an overview of Lucidchart’s AI flowchart generator capabilities and find additional resources.

Lucidchart blog
Read about diagramming trends, and explore tips for creating diagrams in Lucidchart.

Lucidchart pricing
Create a free account and compare options for paid Individual, Team, or Enterprise plans.
Frequently asked questions about decision tree diagrams
How much does Lucidchart cost?
Where can I learn more about decision tree diagrams?
Can I import files into Lucidchart?
Can I import data from Excel into a tree diagram?
How can I show multiple outcomes when a decision is made?
Everything you need to make a tree diagram
In addition to our tree diagram maker, Lucidchart offers support and training resources to help you branch out to any type of diagram.
Get support