
Fishbone diagram maker
Lucidchart is an intelligent diagramming application that makes creating a fishbone diagram easy with drag-and-drop shapes, ready-to-use templates, and more.


By registering, you agree to our Terms of Service and you acknowledge that you have read and understand our Privacy Policy.


Analyze cause and effect with our fishbone diagram creator
Find the cause of any business problem with effective visuals
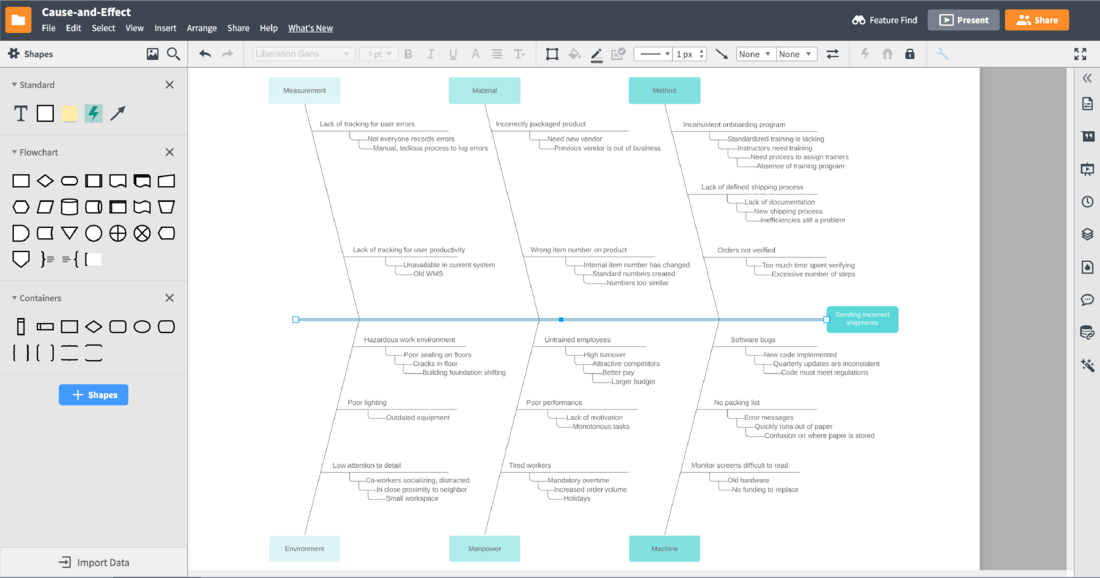
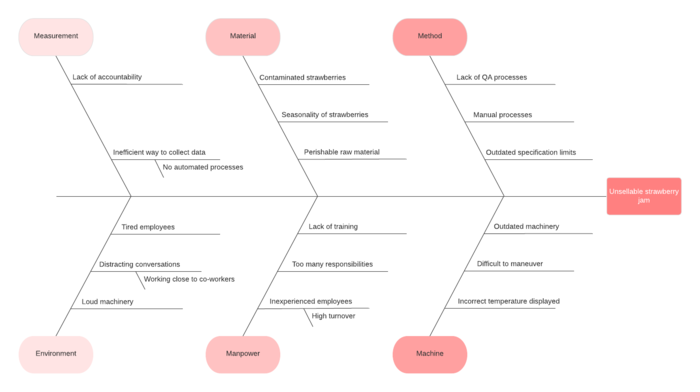
A fishbone diagram can not only help your team collaborate to identify problems, but it can also help you save time and resources as you reduce recurring issues and prioritize solutions. Commonly referred to as an Ishikawa diagram, these visuals allow for efficient analysis, pinpointing the root causes of business problems in order to better understand solutions.
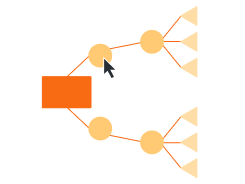
Turn problems into organized solutions
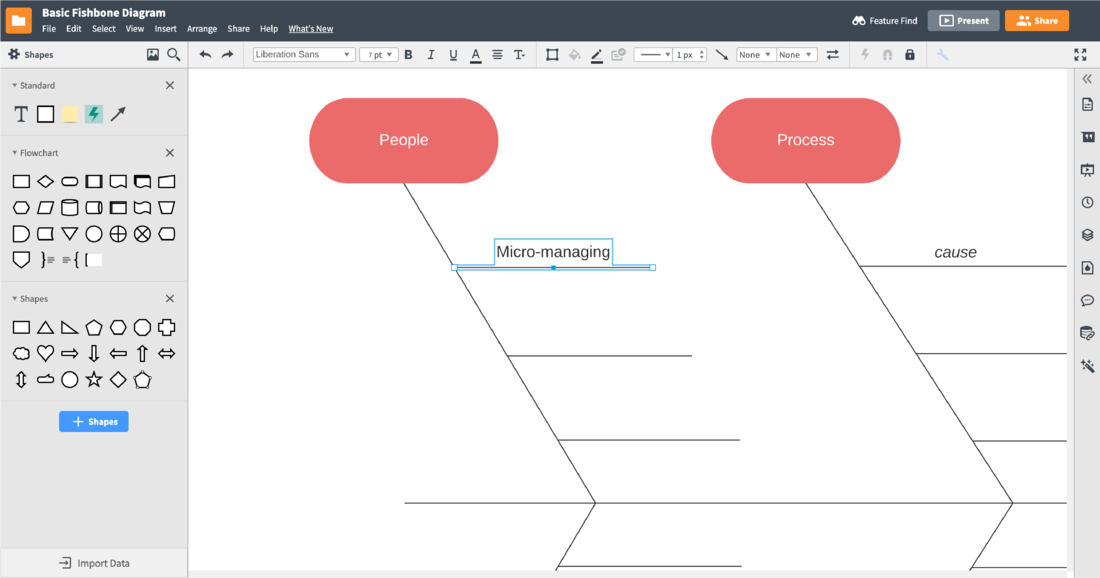
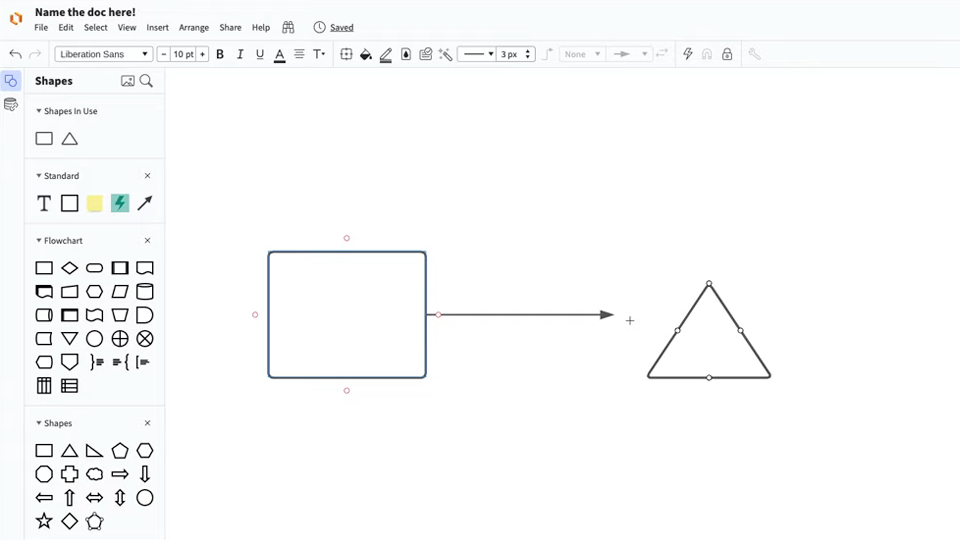
Lucidchart allows you the freedom to add as many lines and as much text as you need to identify all possible root causes. Our intuitive fishbone diagram creator makes it easy to add to, group, and format any part of your diagram to keep it clutter-free and professional.
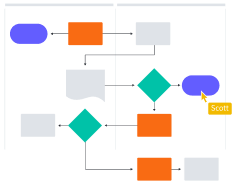
Choose a template to jump-start your brainstorming session
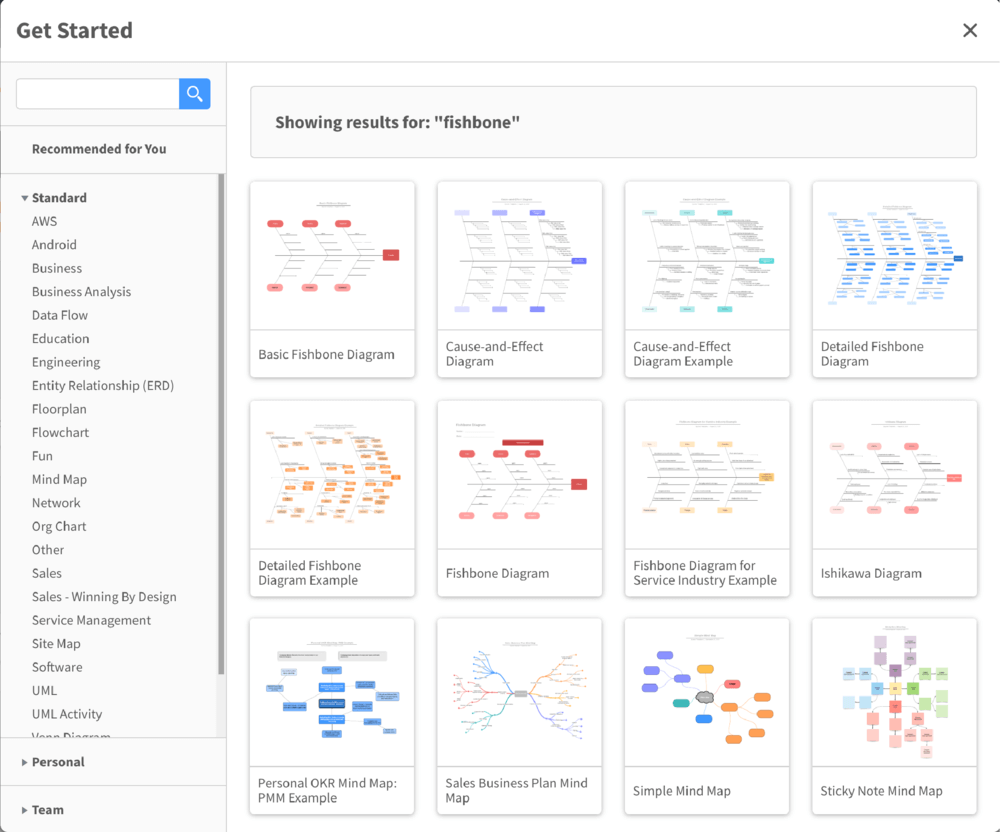
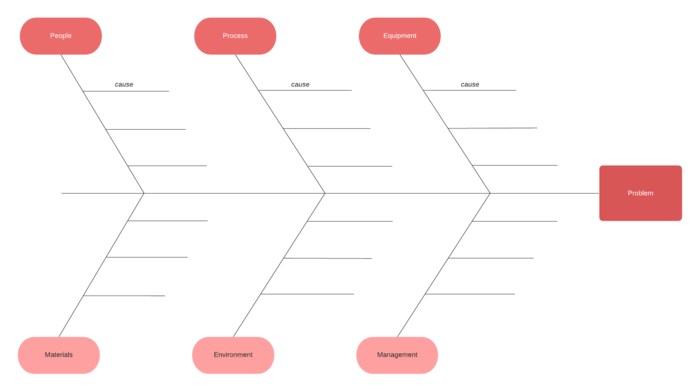
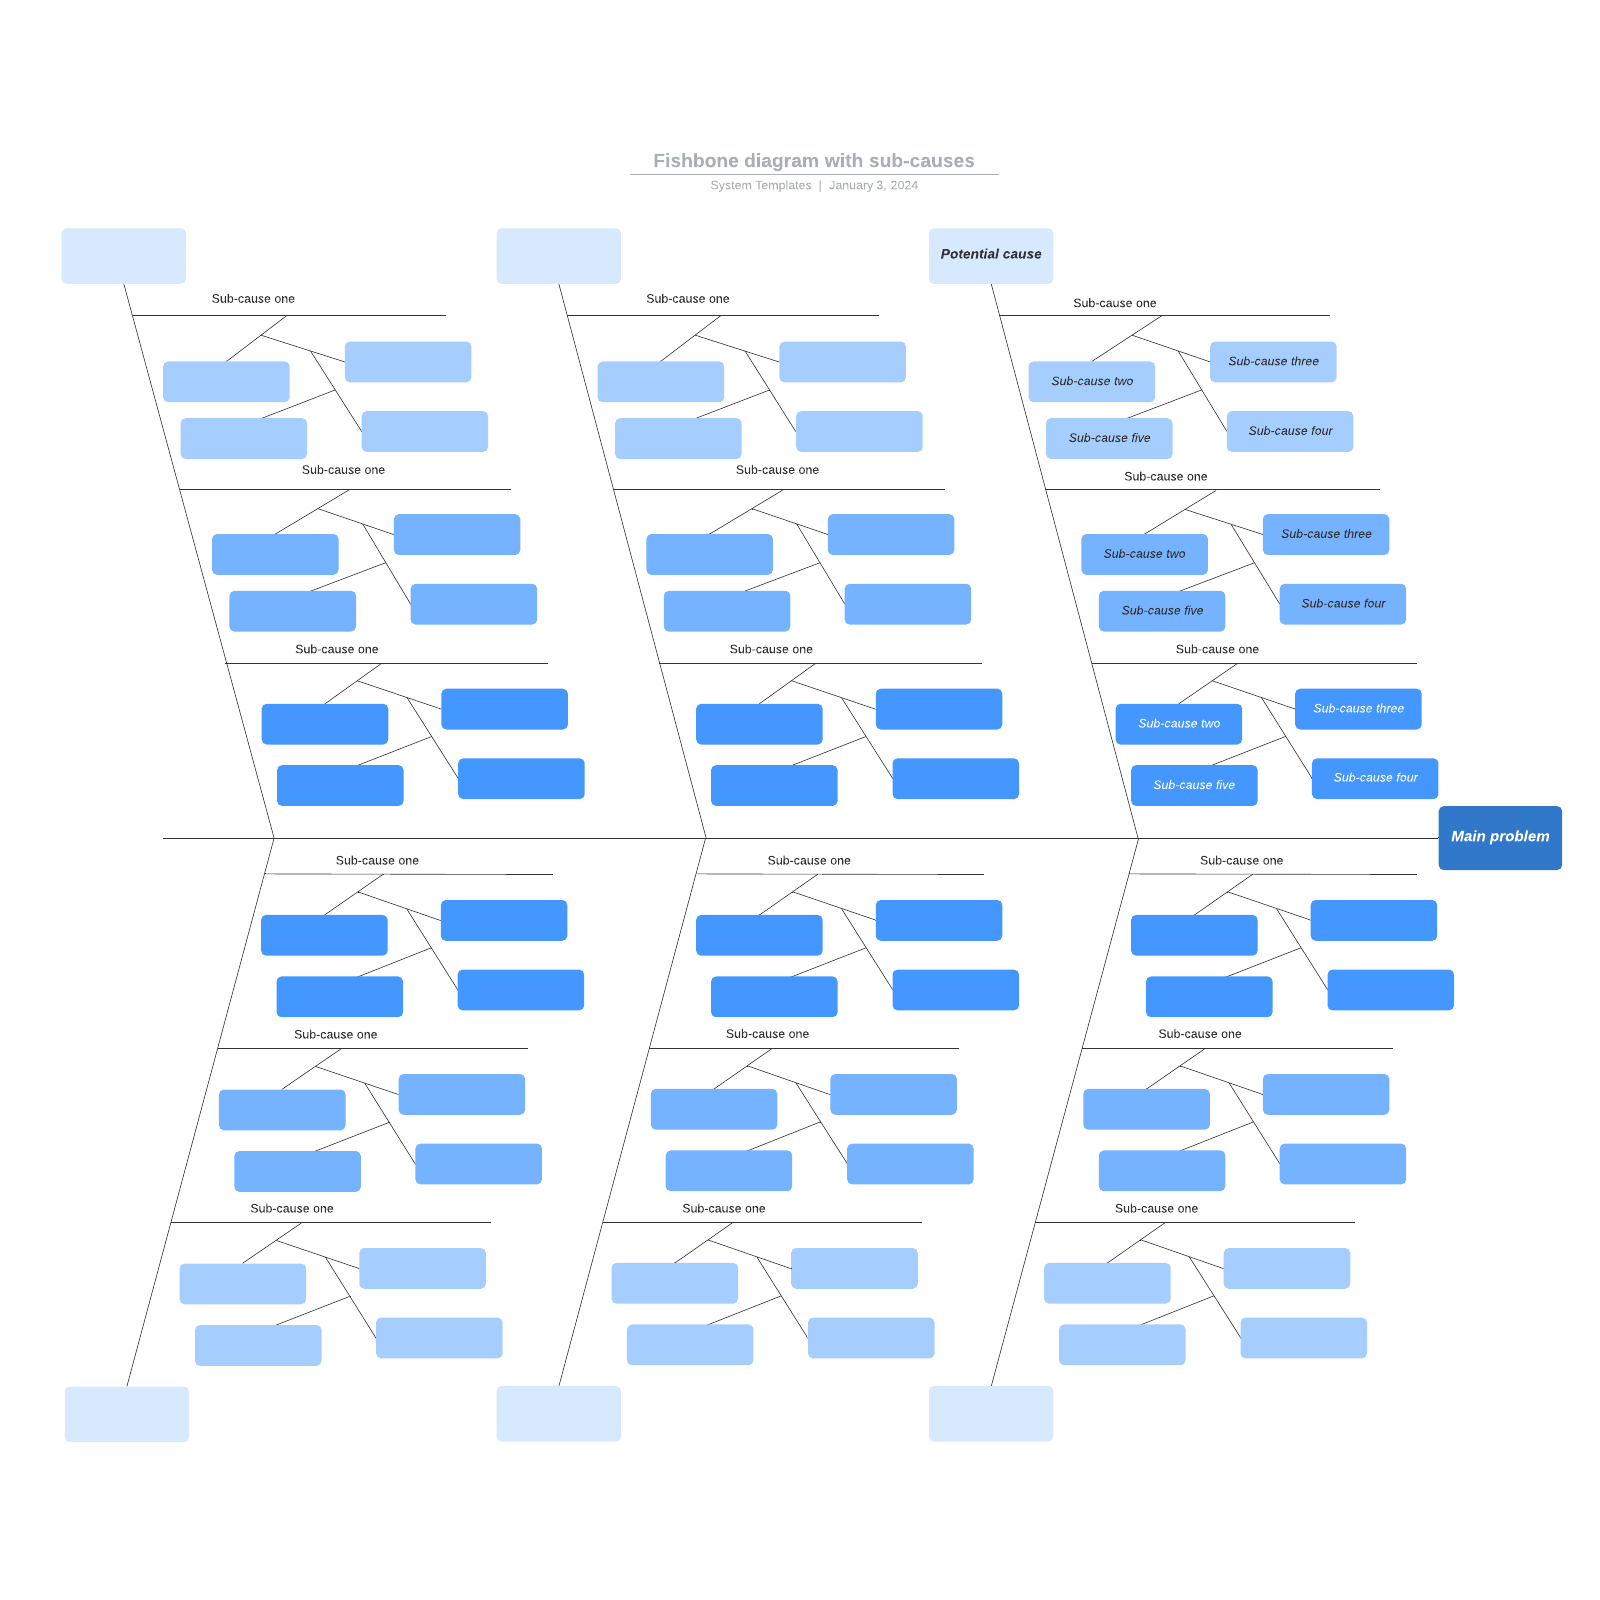
Begin your work in our fishbone diagram maker with inspiration from one of our many fishbone diagram templates. Our templates can help you find an appropriate starting point, provide a framework for your analysis, and highlight possible solutions for your problem.
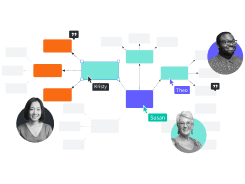
Brainstorm causes as a group in real time
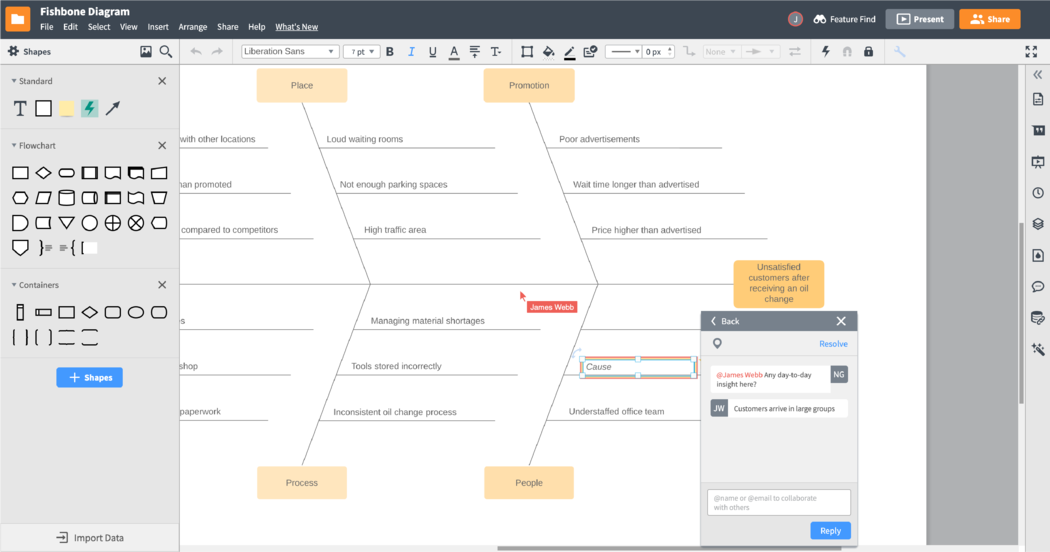
With real-time collaboration, @mention commenting, and in-editor chat functionality built into your Lucidchart canvas, you can analyze and brainstorm with your team without worrying about delays or version control. No matter where your collaborators are located or what device they’re using, you can make sure that your team’s ideas are seamlessly incorporated into your analysis.
Master the basics of Lucidchart in 3 minutes
master the basics of Lucidchart in 5 minutes
- Create your first fishbone diagram from a template or blank canvas or import a document.
- Add text, shapes, and lines to customize your diagram.
- Learn how to adjust styling and formatting.
- Locate what you need with Feature Find.
- Share your diagram with your team to start collaborating.
Templates to create a Fishbone diagram
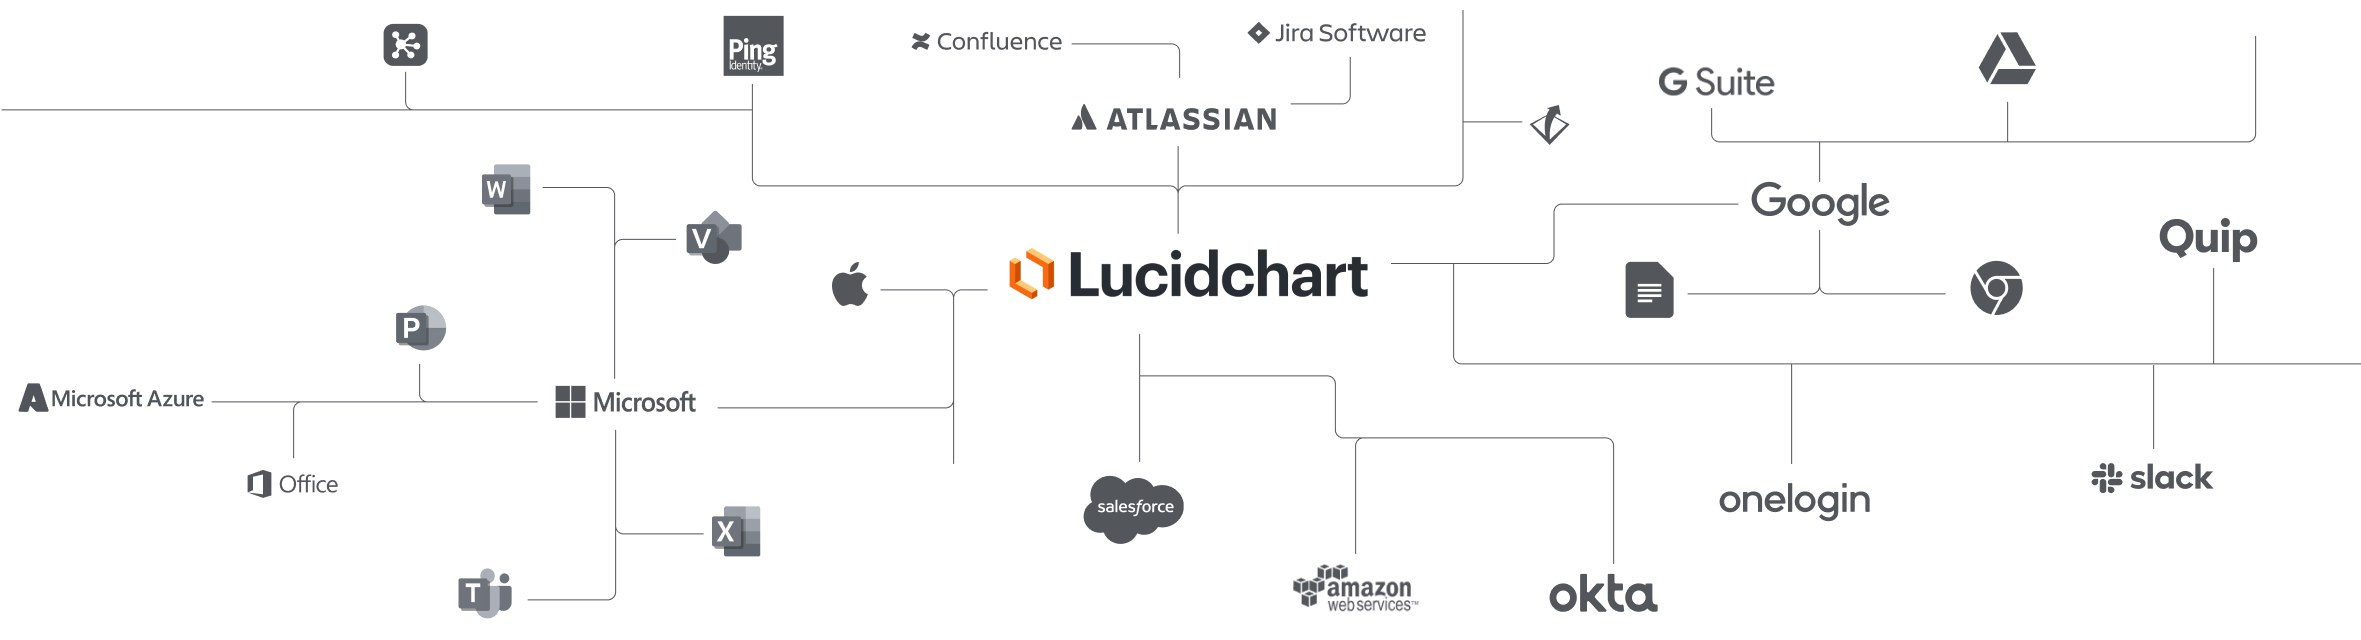
Lucidchart integrations
Connect Lucidchart to your favorite industry-leading apps.
See why teams choose Lucidchart
Diagram, visualize data, and collaborate all in one platform.
Collaboration
Create online fishbone diagrams on any device with ease. Lucidchart helps teams collaborate in real time from anywhere in the world. Enhance productivity while working together with your team to achieve your product goals.
Clarity
Lucidchart brings clarity to the complex. Intelligent diagramming allows you to quickly visualize projects and processes from start to finish.
Alignment
Drive alignment with your team by collaborating in the same space. Quickly map out processes and ideas together in real time so that you never miss a beat.

Better Together
The Lucid Visual Collaboration Suite transforms the way you work from ideation to project completion. Brainstorm and plan in Lucidspark then map it out in Lucidchart. Create a living blueprint of your organization.
What is a fishbone diagram?
A fishbone diagram is also known as an Ishikawa diagram, herringbone diagram, or cause-and-effect diagram. This is because it describes the potential causes of a given problem or outcome. The diagram resembles an actual fish bone, with a long line running down the center pointing to the main outcome, also called the "problem statement". The other bones branch out from the middle bone and represent different categories of causes.
Frequently asked questions about diagramming in Lucidchart
How do I create and use lines in Lucidchart?
It’s easy to add, modify, and format lines in Lucidchart. Click and drag lines or use smart lines for a more streamlined experience.
How do I add and modify text in my diagram?
Lucidchart makes it simple to add and format text anywhere in your diagram. Further manage your text by adding or uploading fonts and using our grammar tools.
How long does the free trial last?
Lucidchart trials last for 7 days with no commitment—you can cancel anytime. We’ll also send you an email reminder before your trial expires.
What other templates does Lucidchart have for brainstorming and process analysis?
We offer templates for mind maps, concept maps, affinity diagrams, and other diagrams ideal for brainstorming. We also have flowcharts, tree diagrams, SWOT analysis diagrams, and other diagrams for process improvement.