
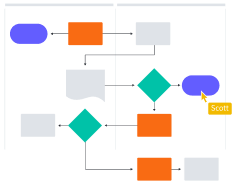
Process mapping software
Lucidchart is an intelligent diagramming application that makes creating a process map easy with drag-and-drop shapes, ready-to-use templates, and more.


By registering, you agree to our Terms of Service and you acknowledge that you have read and understand our Privacy Policy.


Communicate complex processes with ease
Document and improve any plan or process
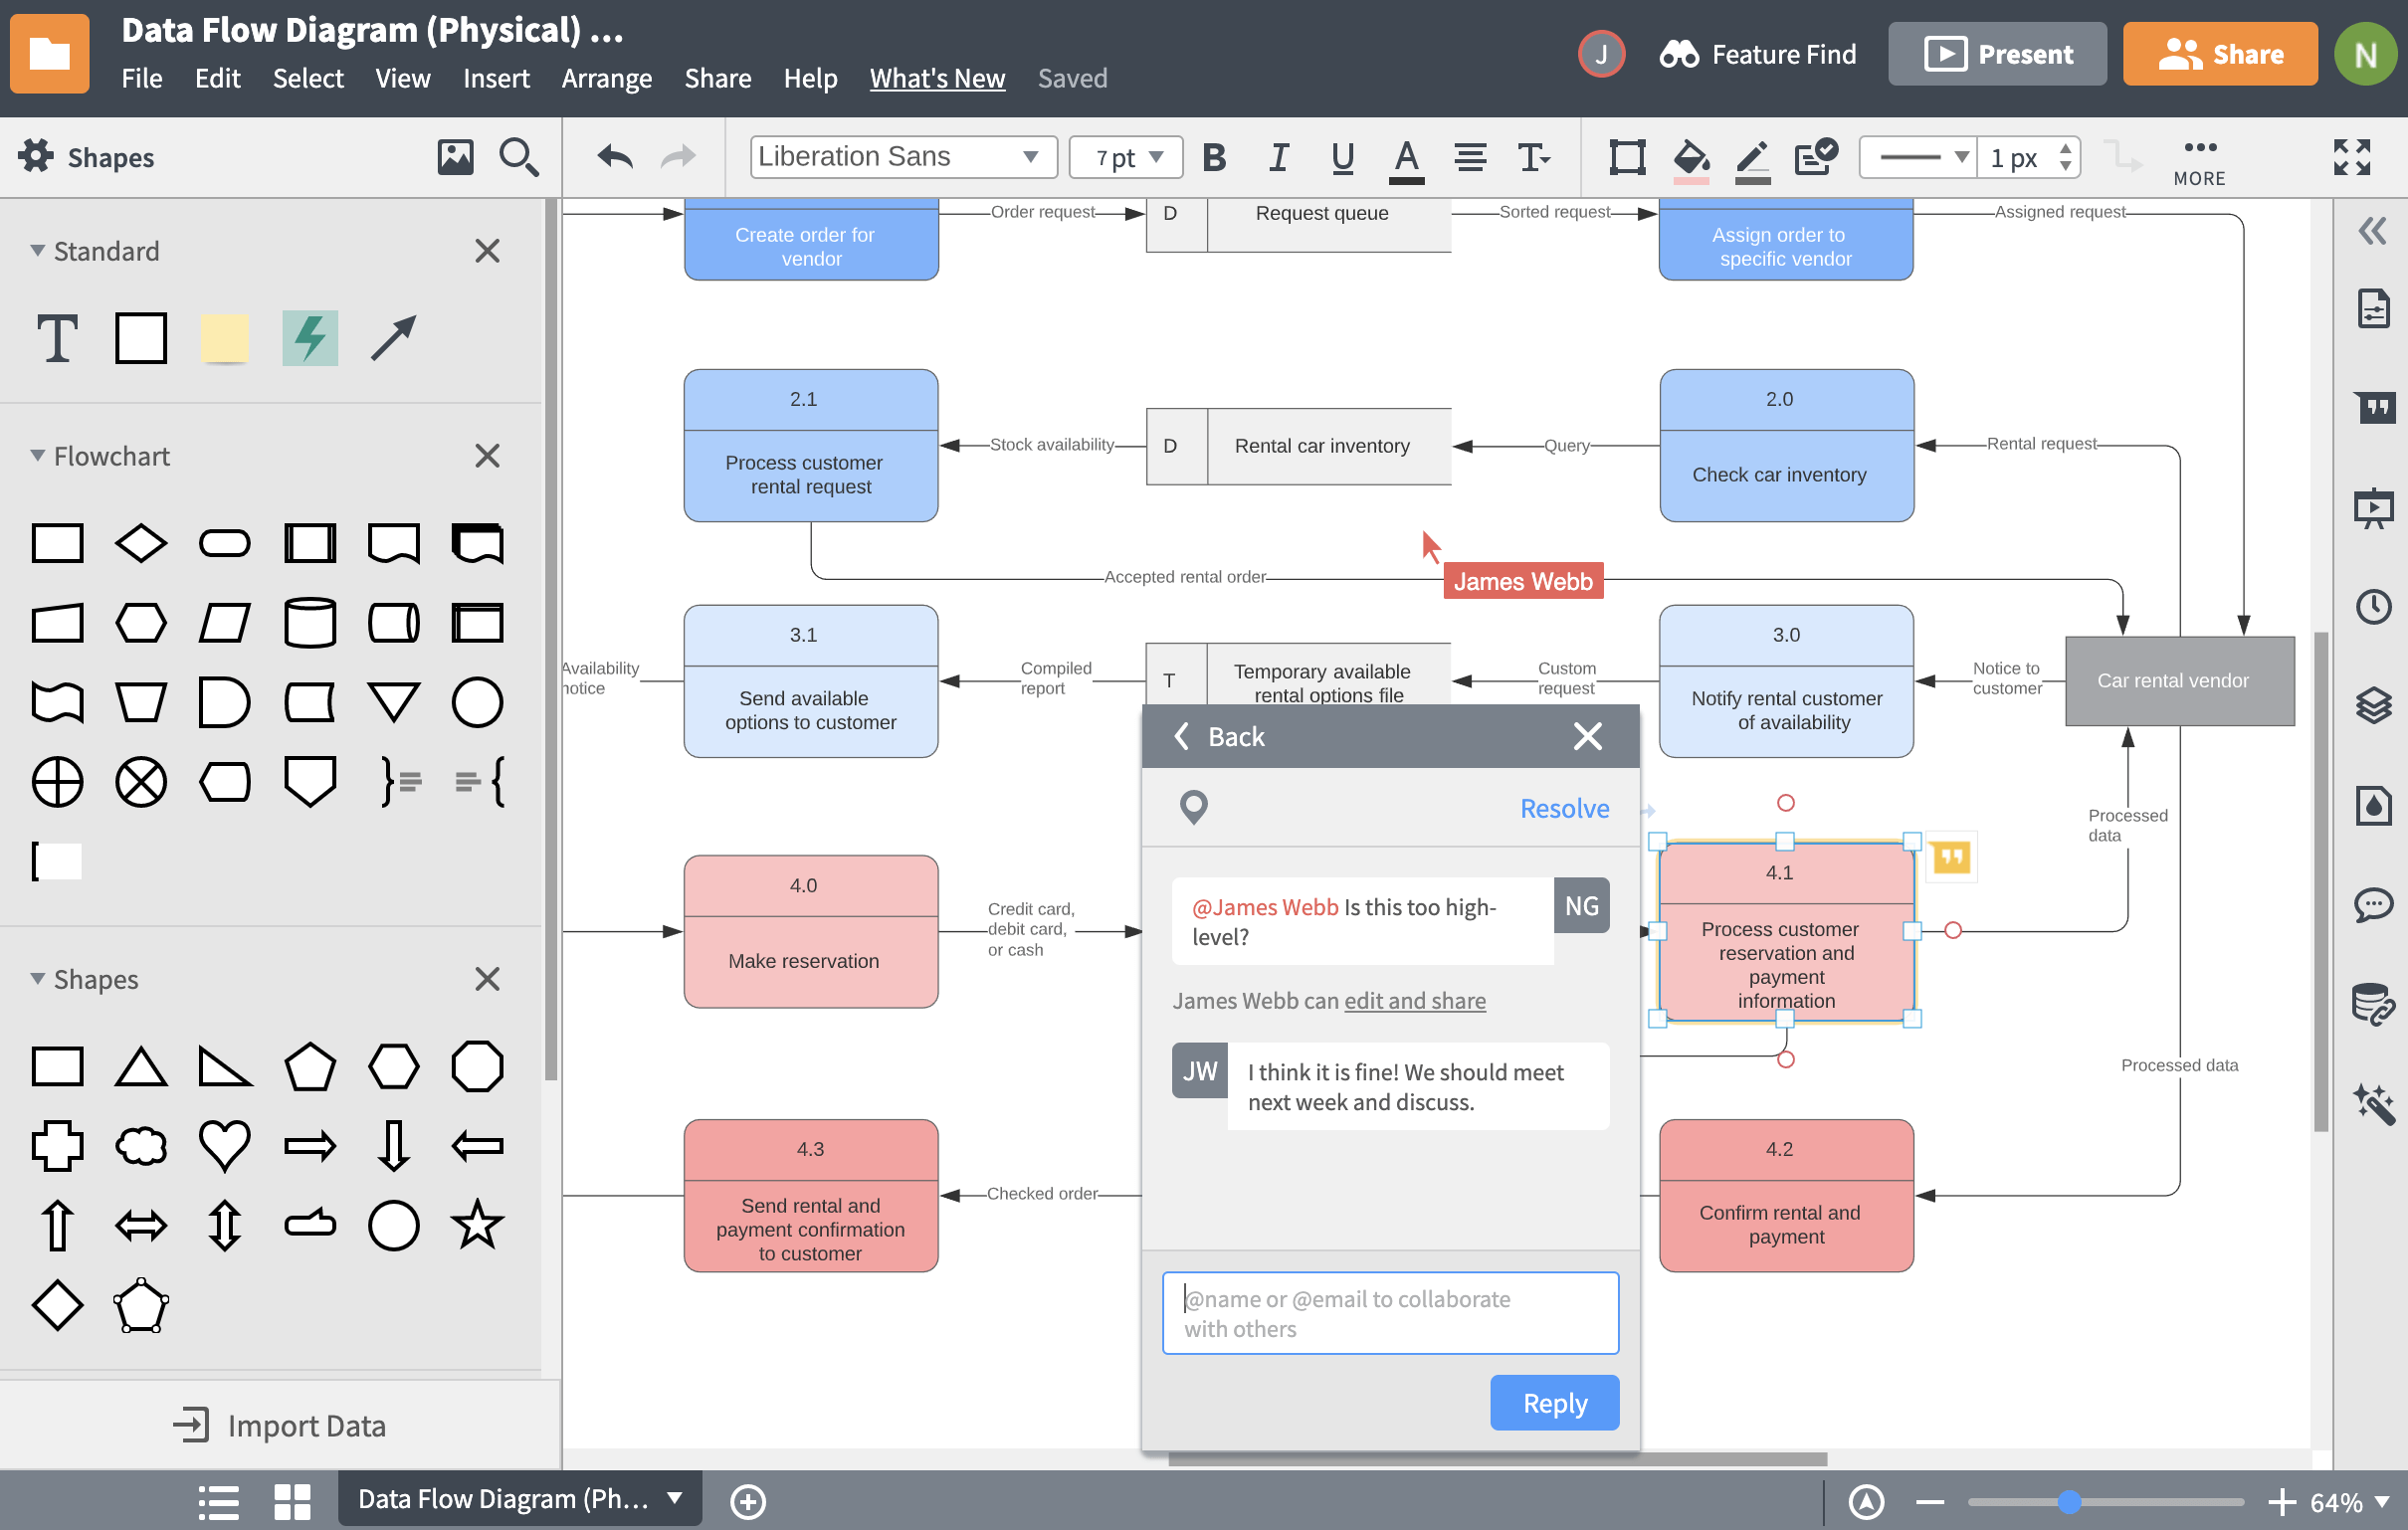
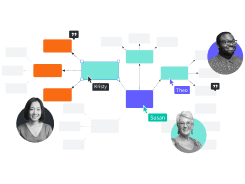
Collaborate in real time, no matter where your team is
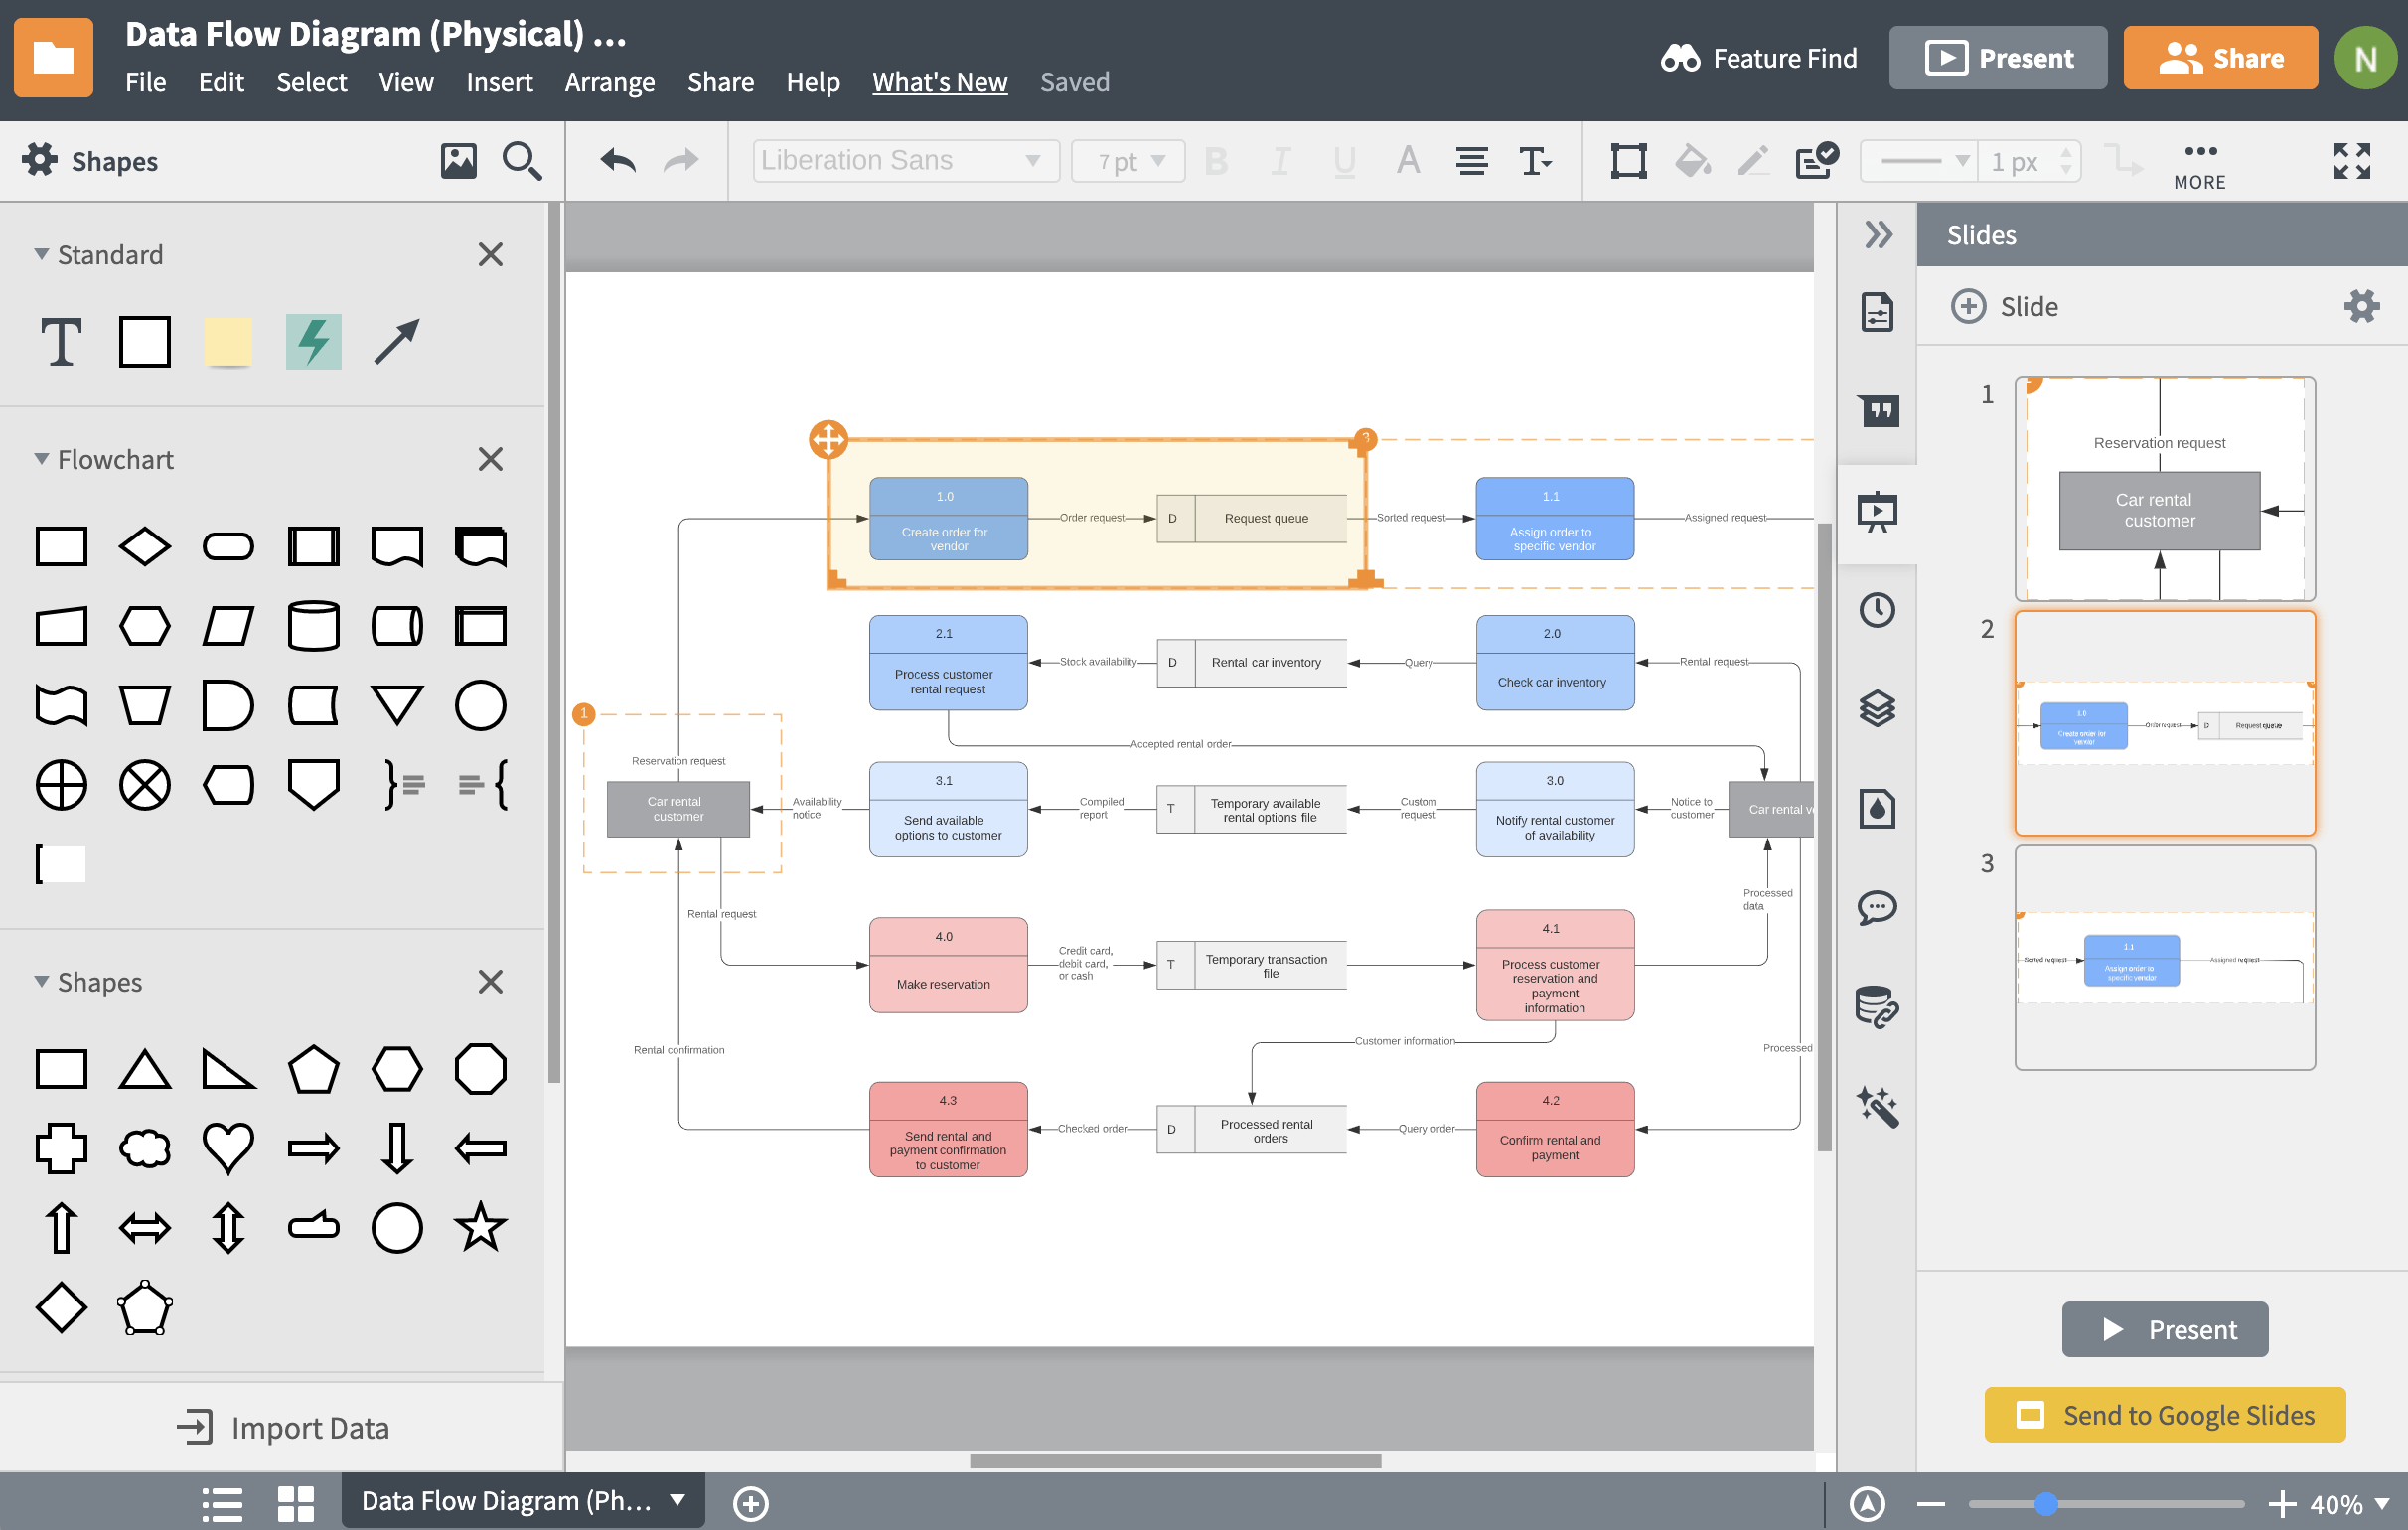
Keep your team on the same page with presentation mode
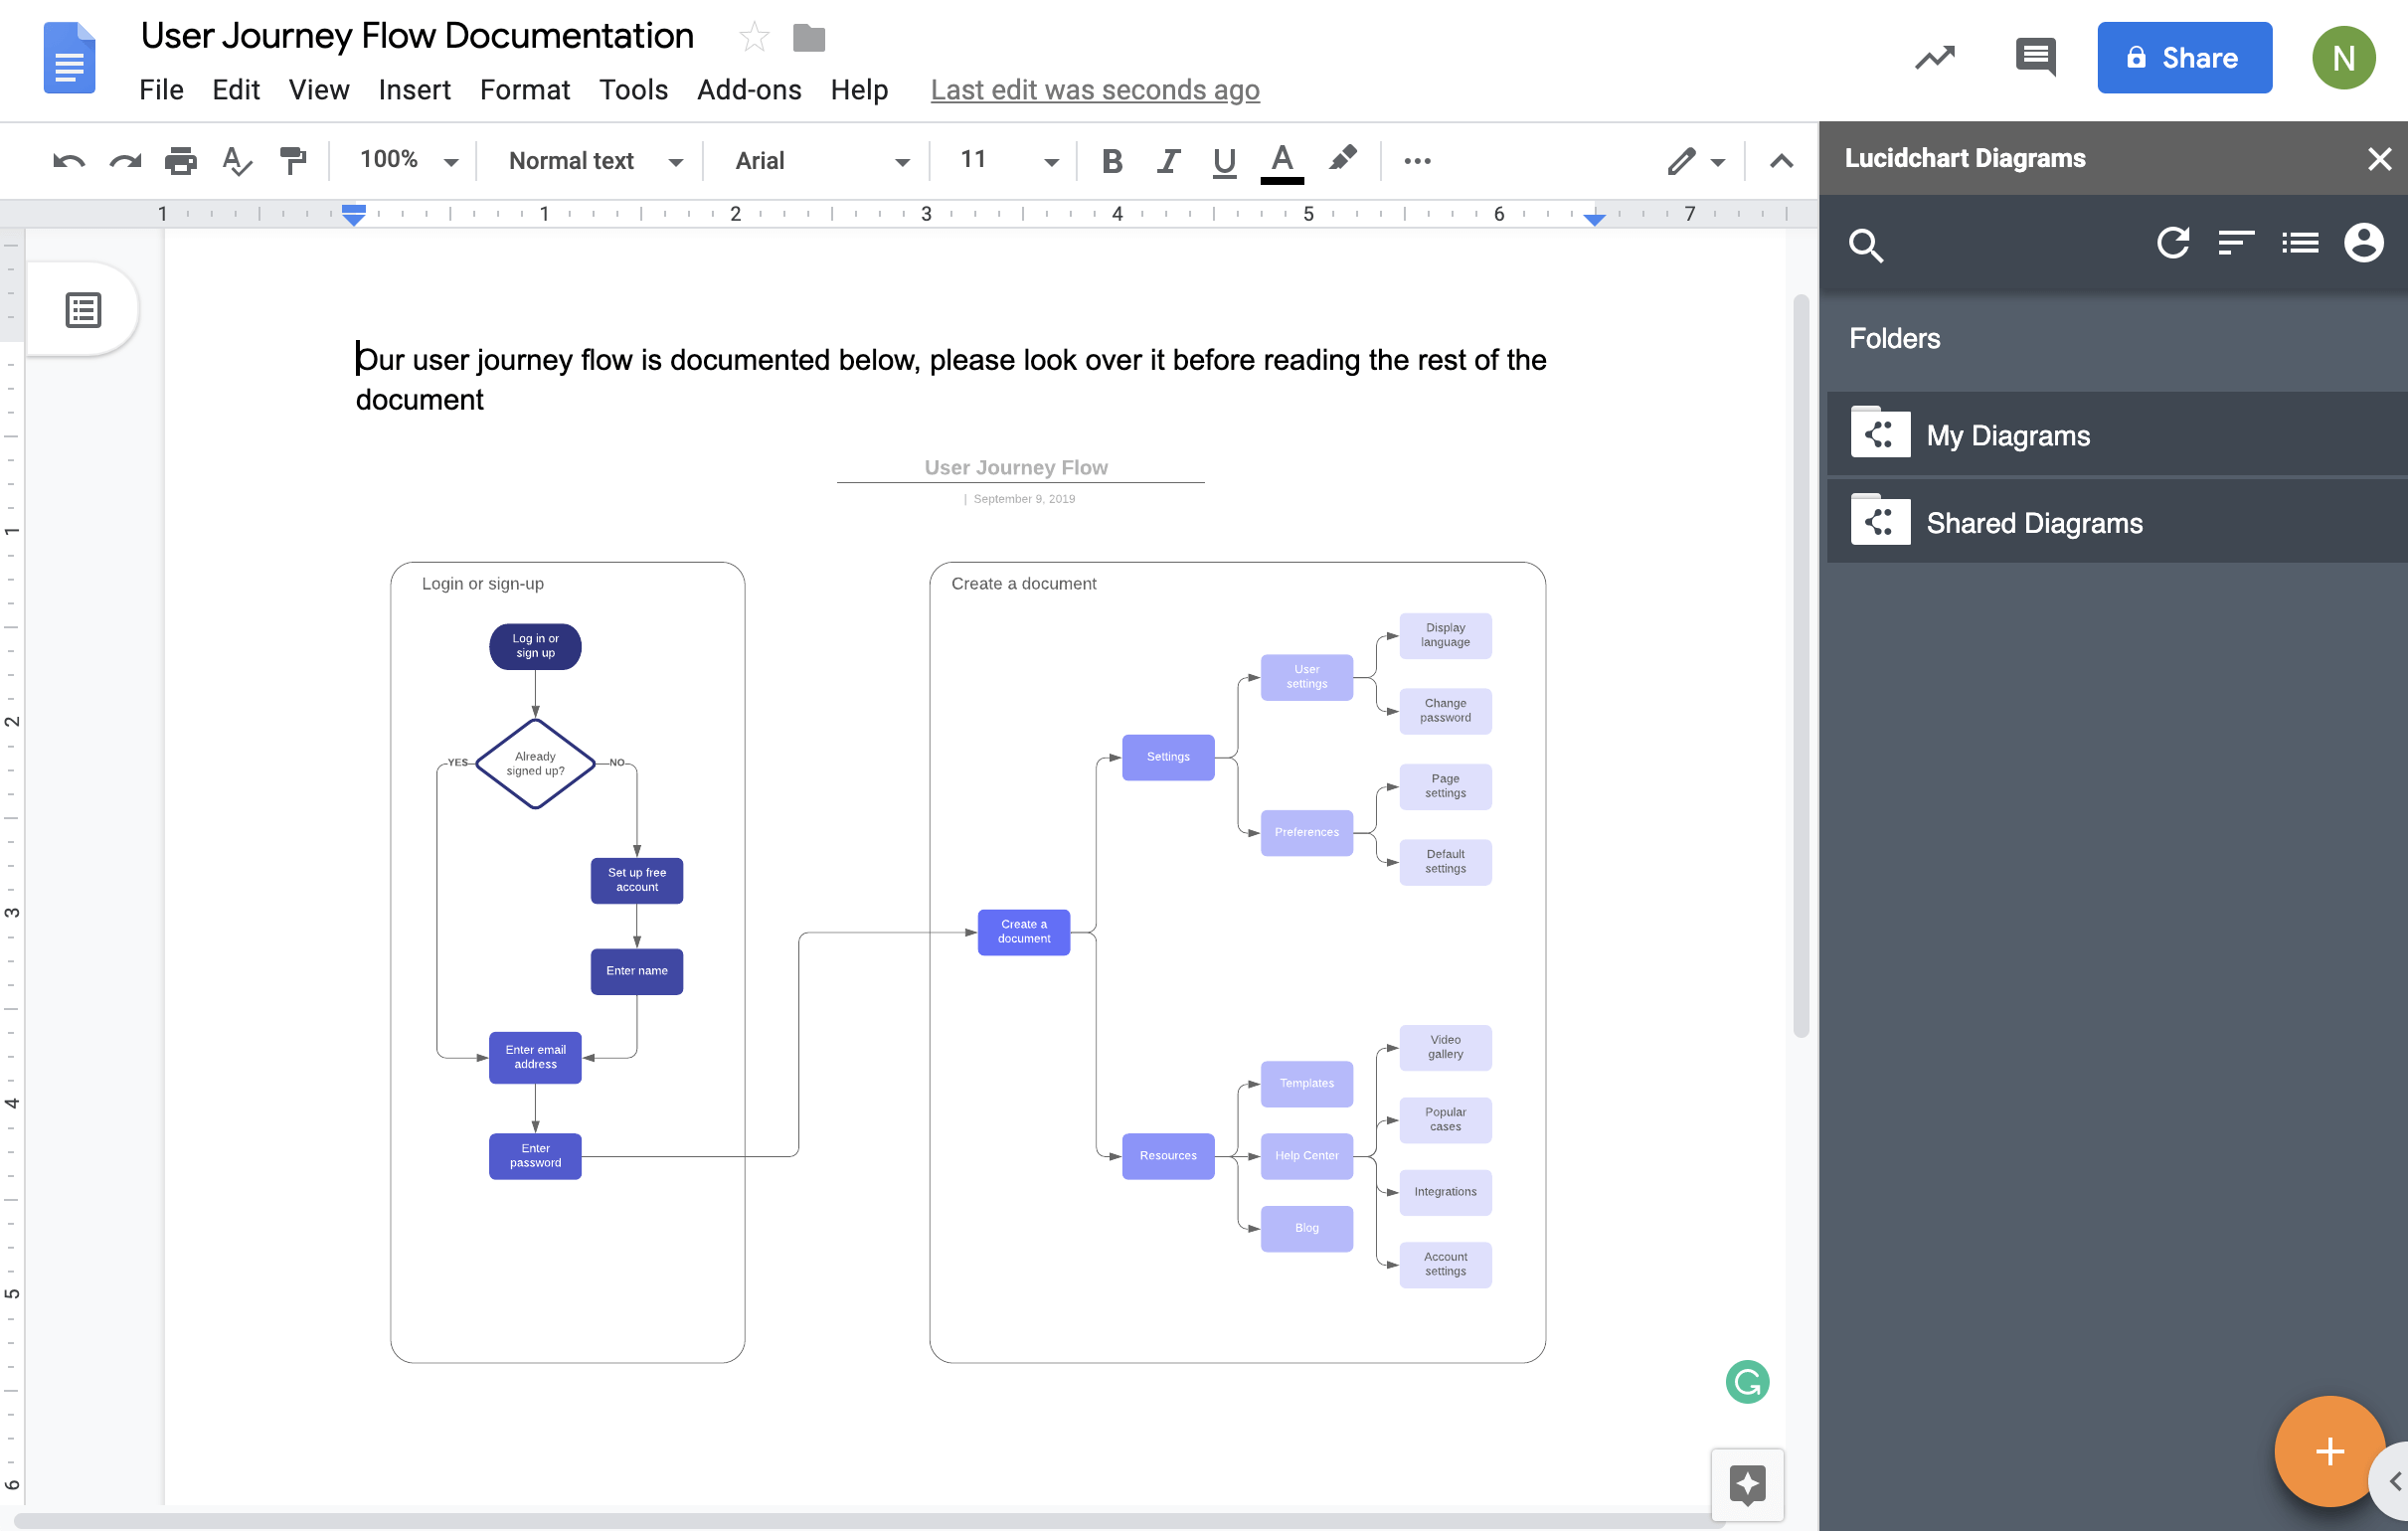
Leverage your Google account to make diagramming easier
Master the basics of Lucidchart in 3 minutes
master the basics of Lucidchart in 5 minutes
- Create your first process map from a template or blank canvas or import a document.
- Add text, shapes, and lines to customize your diagram.
- Learn how to adjust styling and formatting.
- Locate what you need with Feature Find.
- Share your diagram with your team to start collaborating.
Free Process map templates
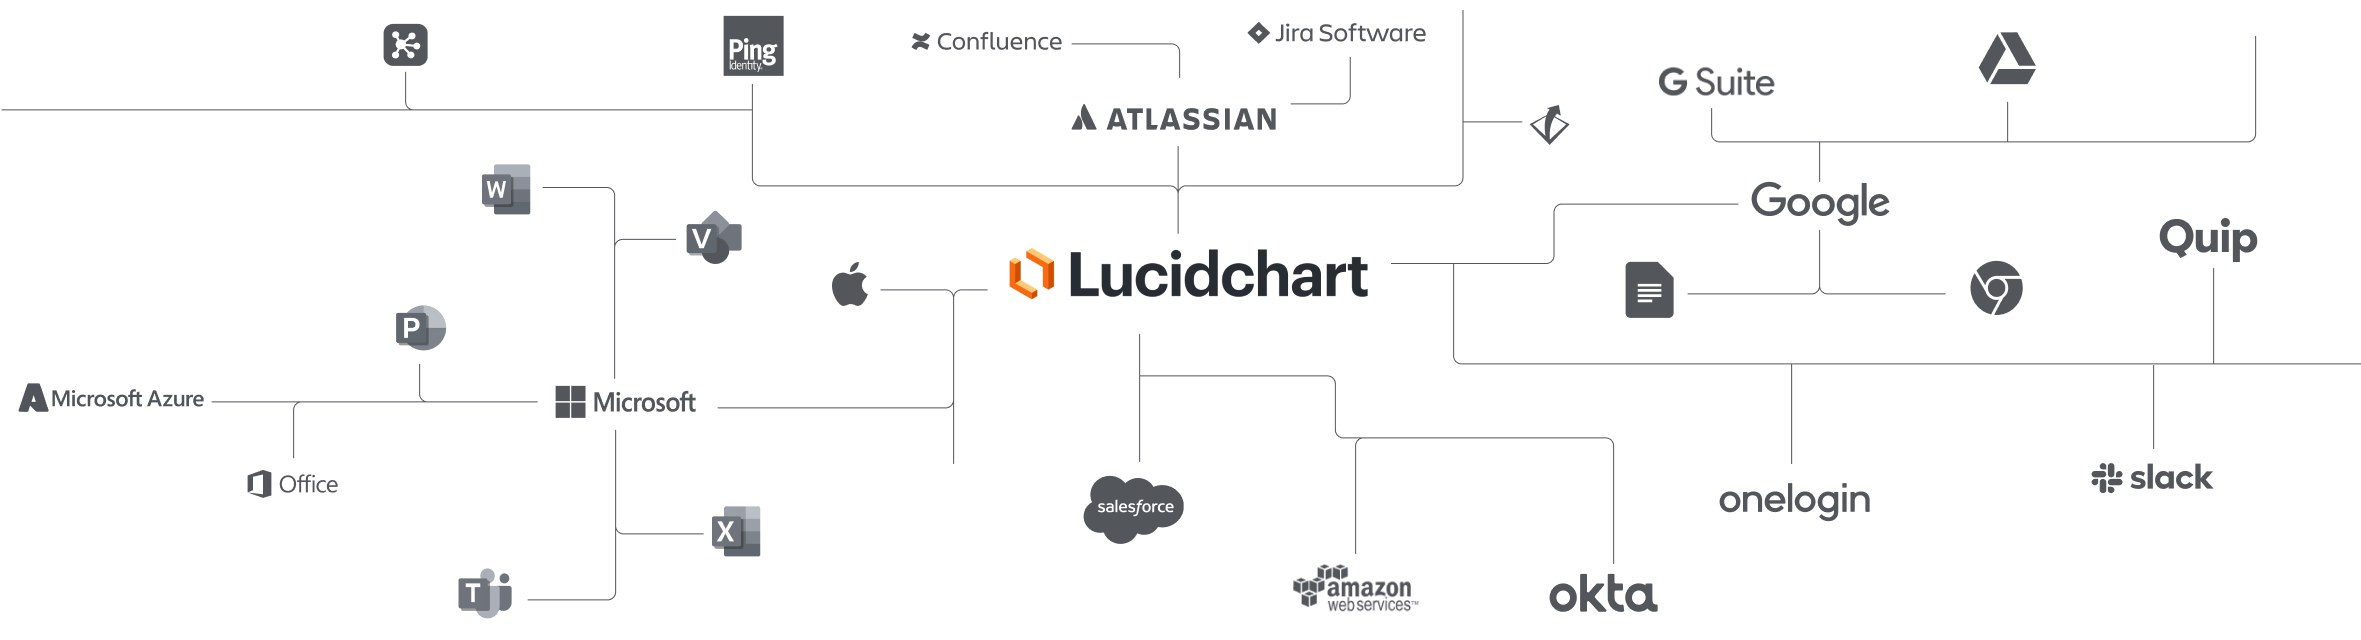
Lucidchart integrations
Connect Lucidchart to your favorite industry-leading apps.
See why teams choose Lucidchart
Diagram, visualize data, and collaborate all in one platform.
Collaboration
Clarity
Alignment

Better Together
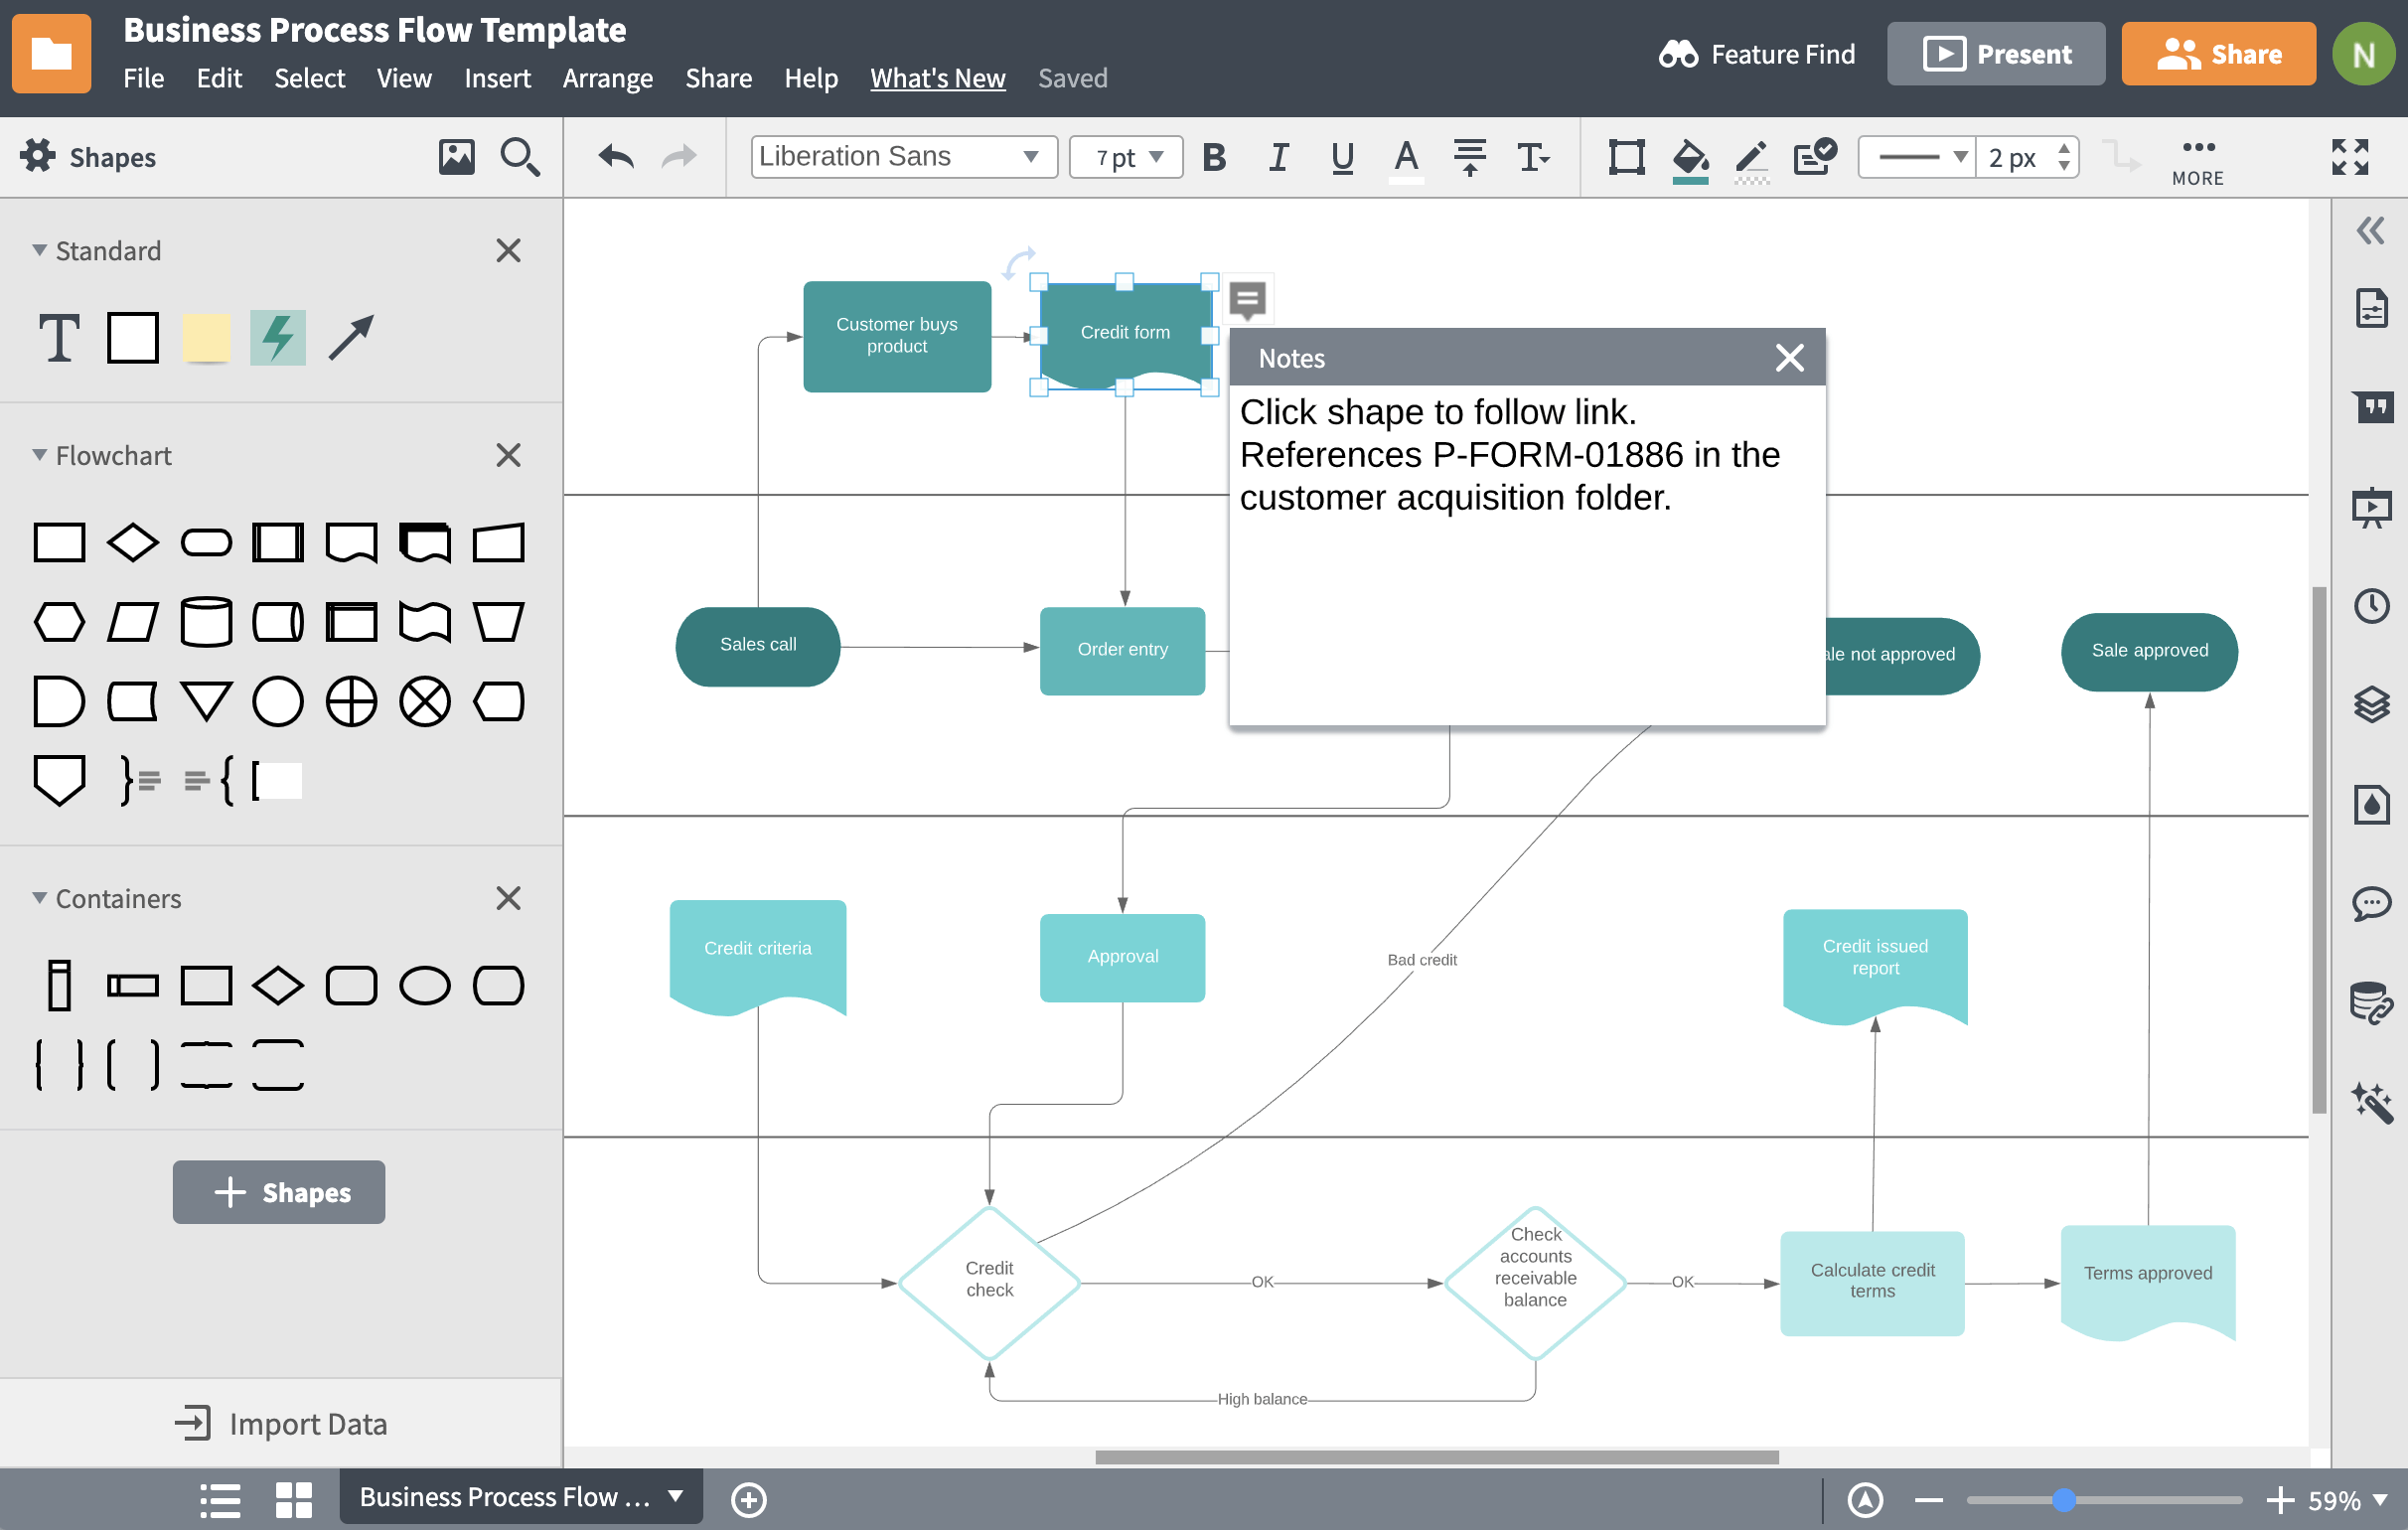
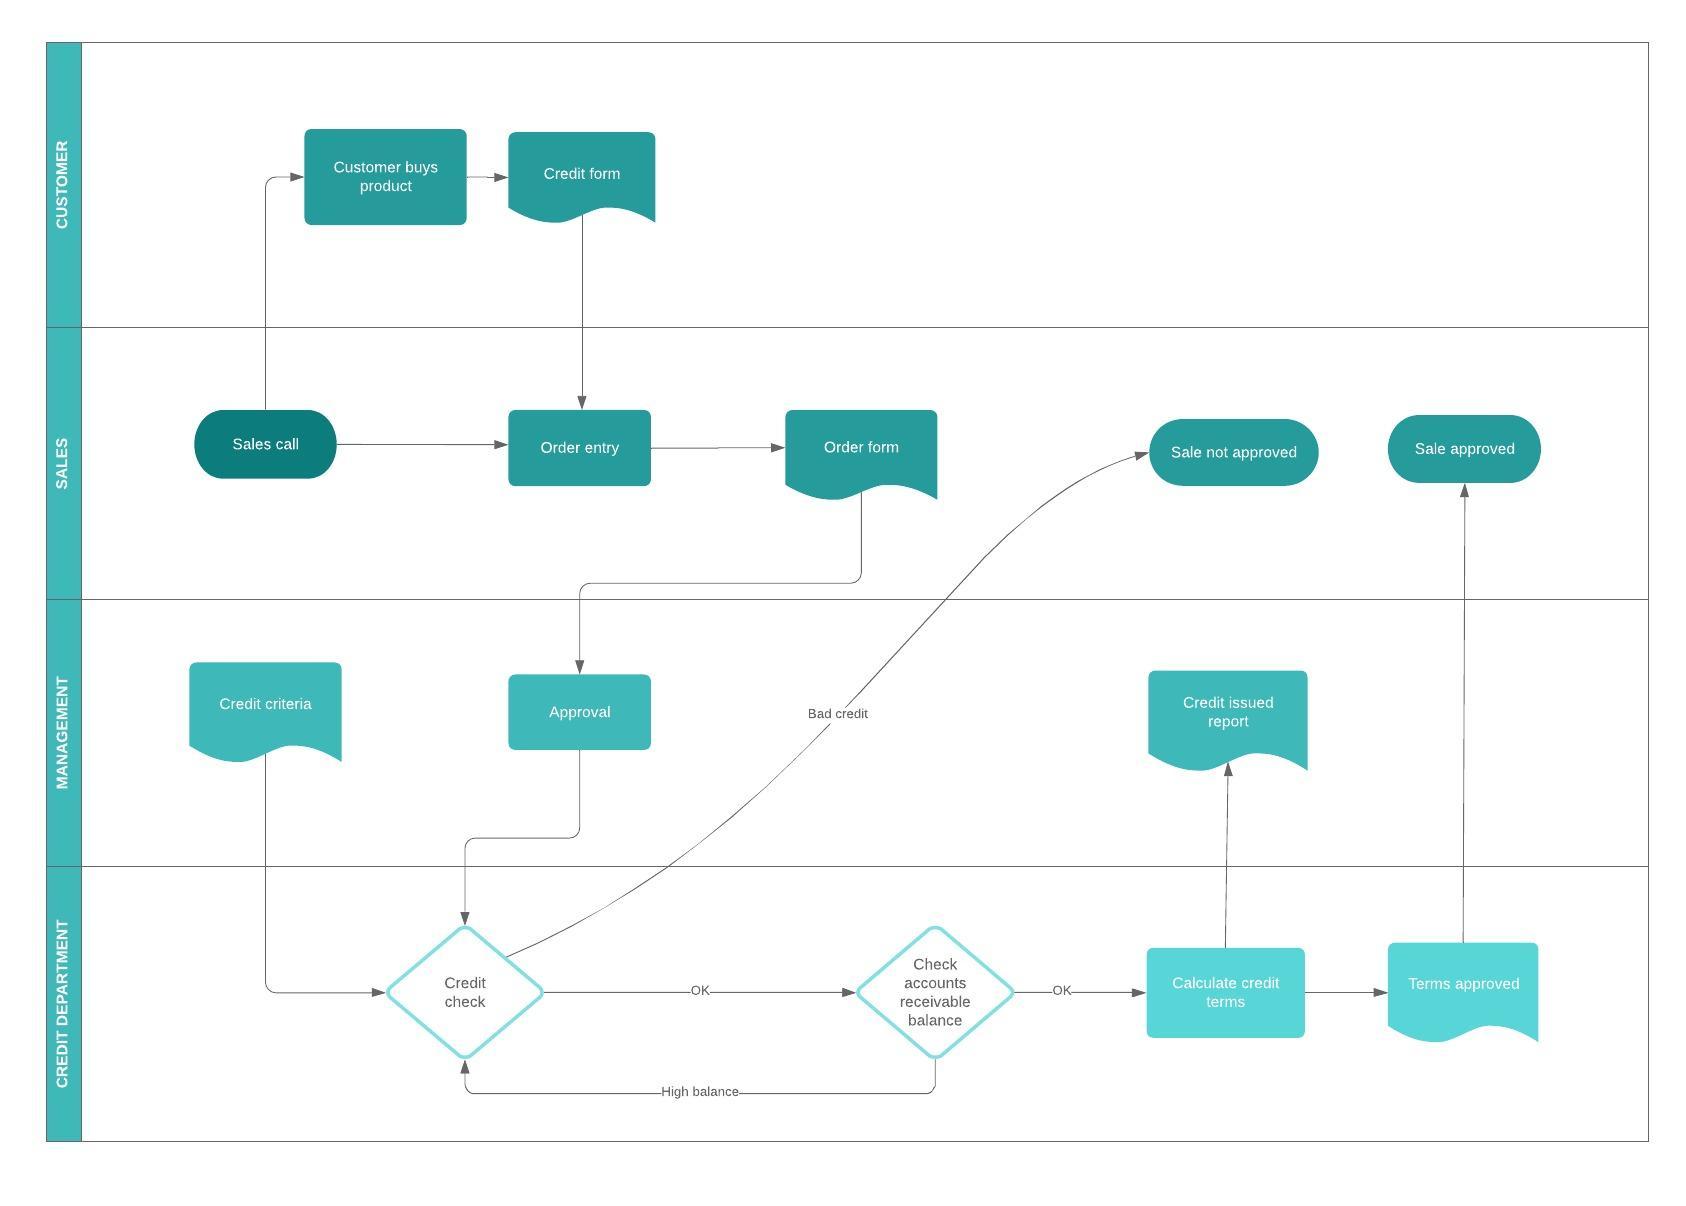
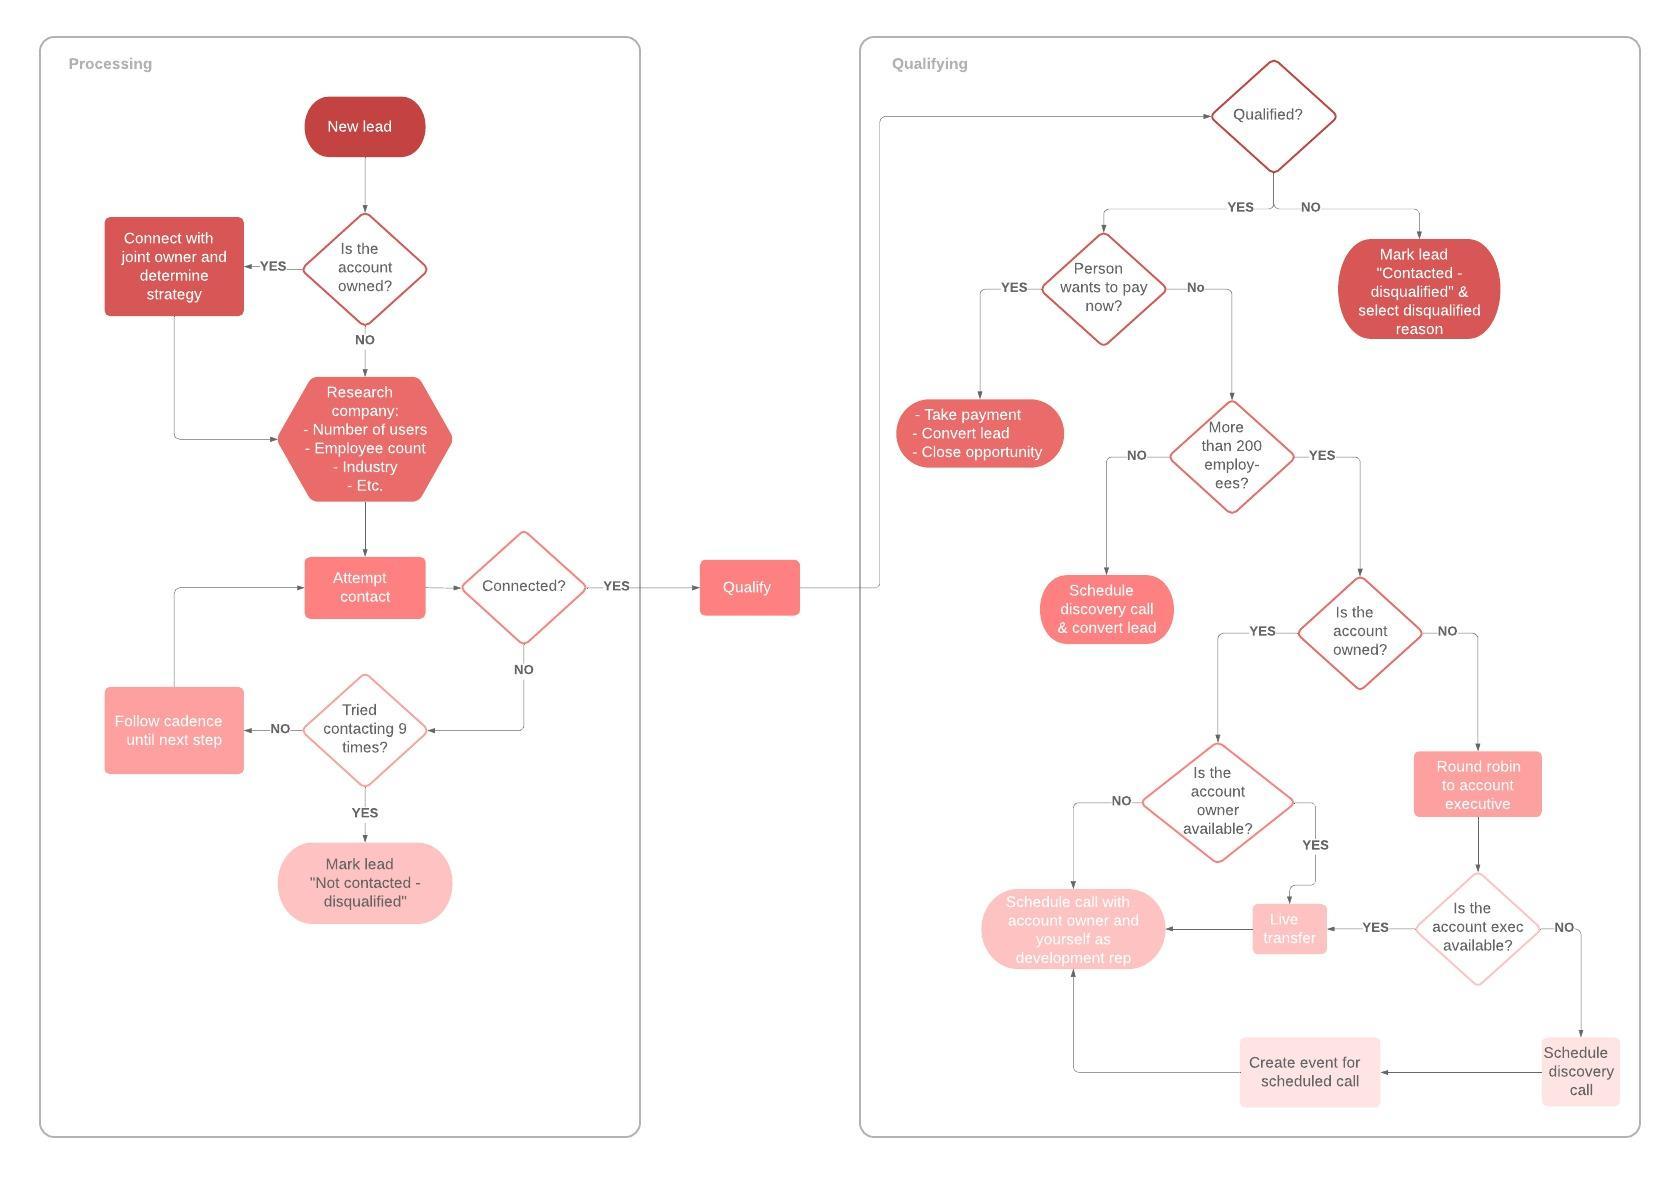
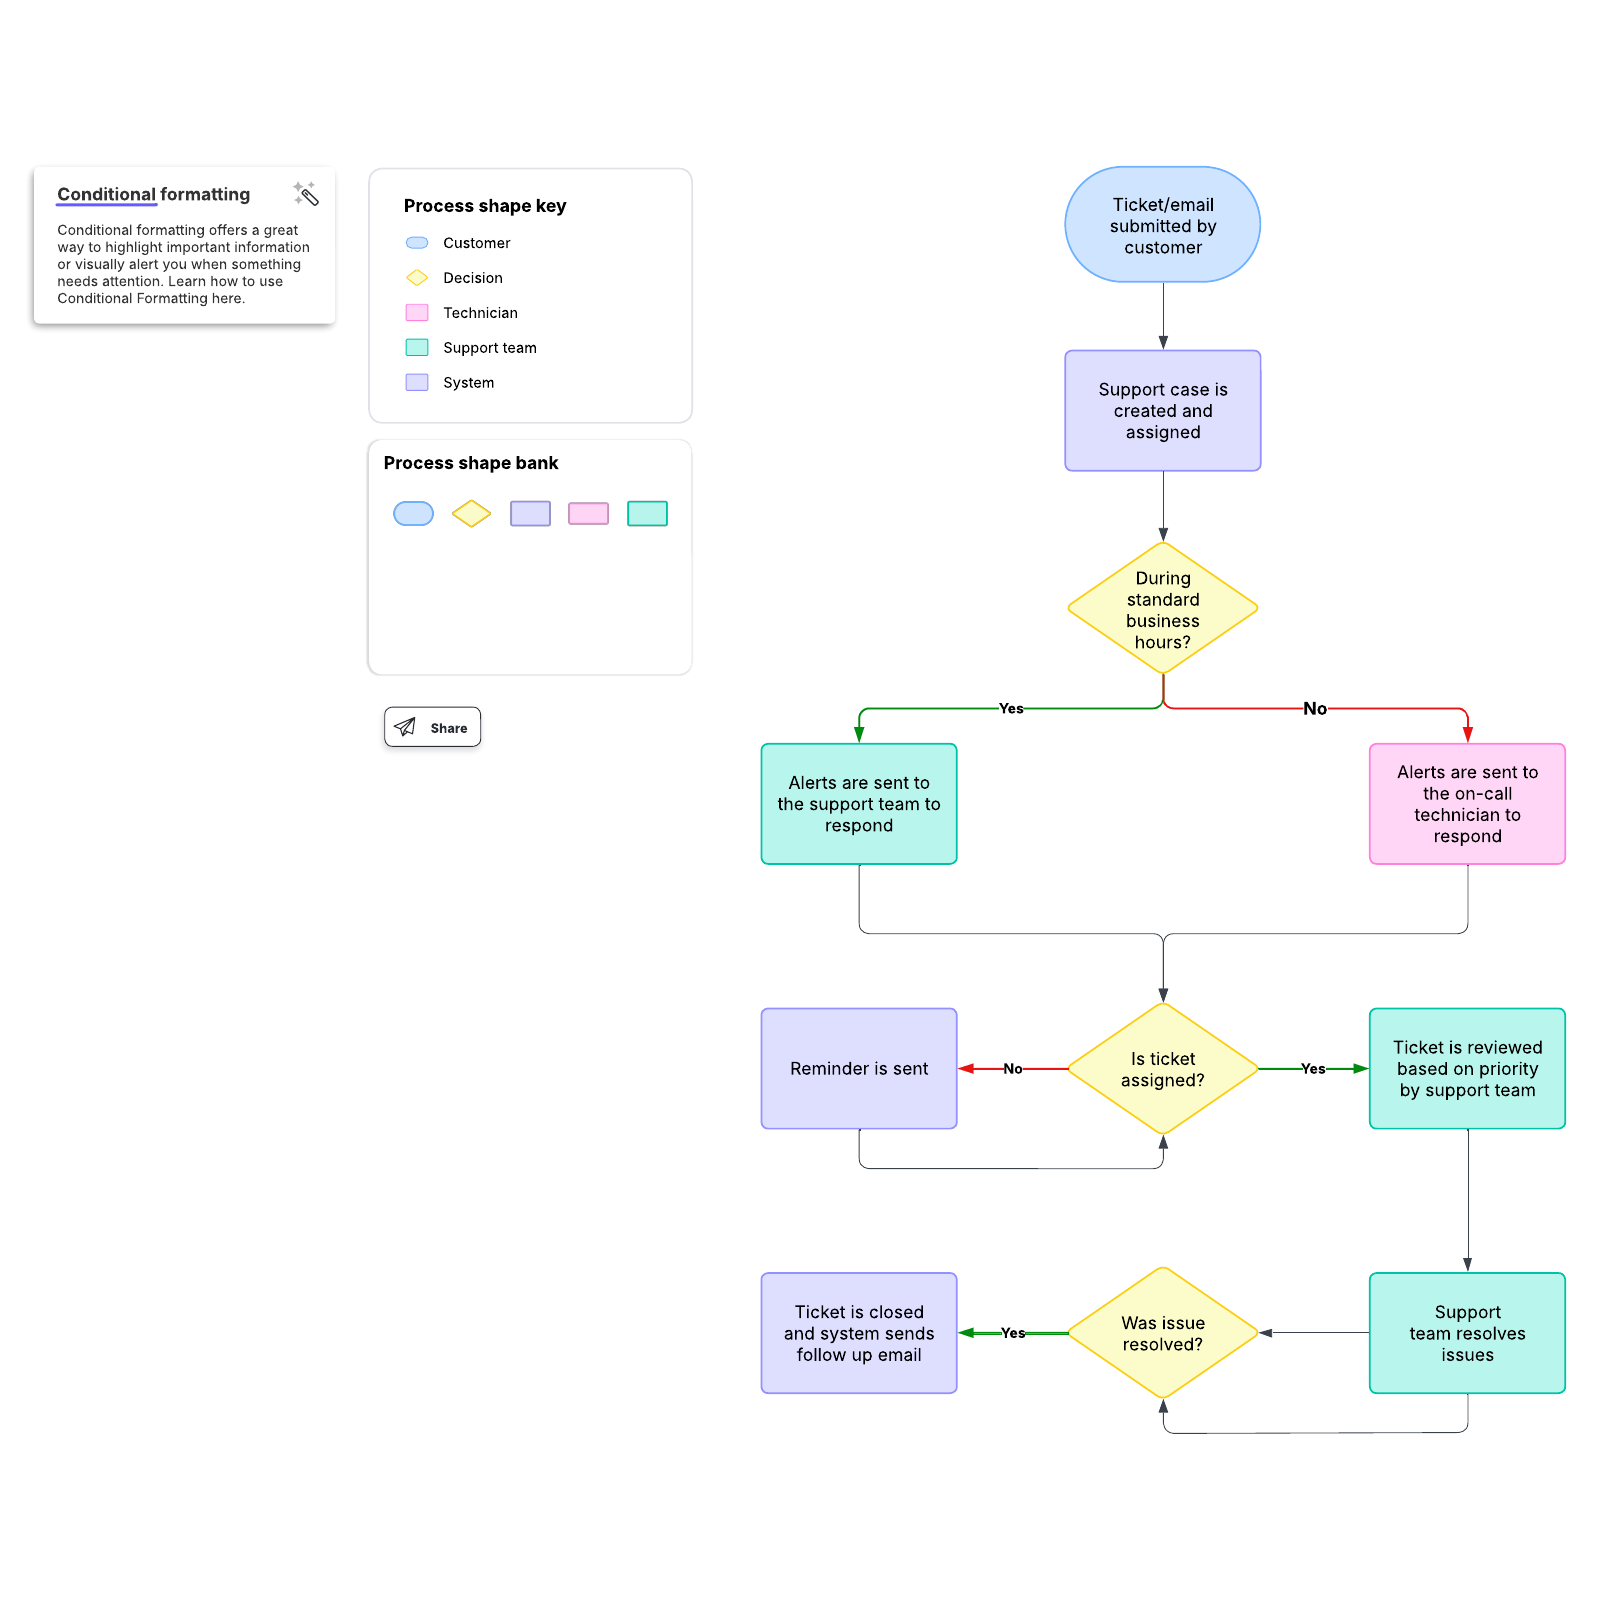
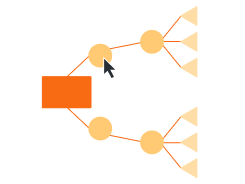
What is a process map
A process map is a planning and management tool that visually describes the flow of work. Using process mapping software, process maps show a series of events that produce an end result. It shows who and what is involved in a process and can be used in any business or organization and can reveal areas where a process should be improved.