Venn diagram maker
Compare products, services, or ideas by creating a Venn diagram online in Lucidchart. Start with a template or build on a blank canvas.


By registering, you agree to our Terms of Service and you acknowledge that you have read and understand our Privacy Policy.


Compare sets of data with our Venn diagram generator
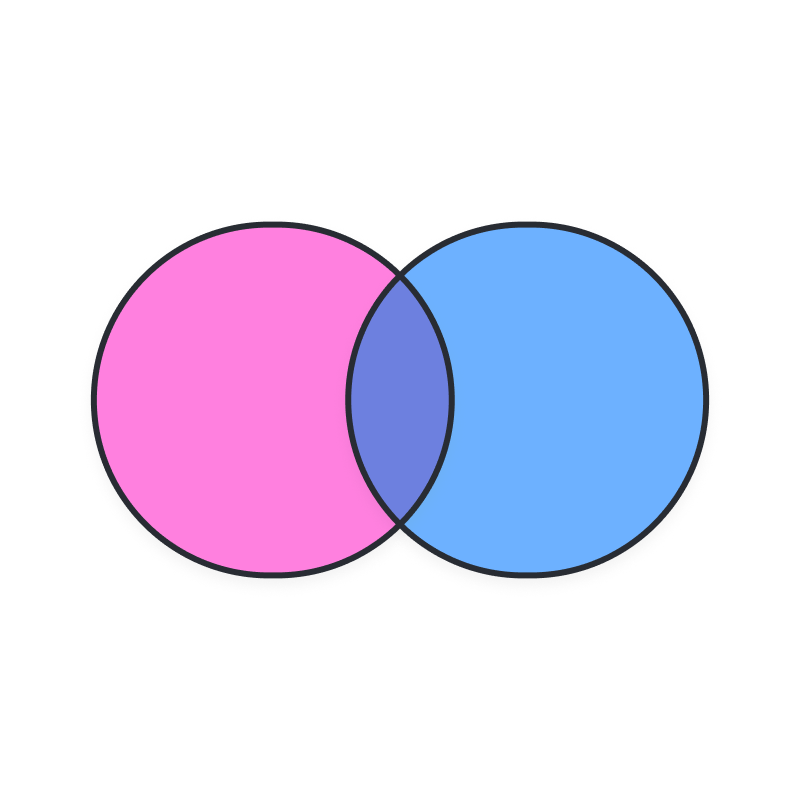
Use visuals to simplify complex information. Easily see the similarities and differences between two or more things.
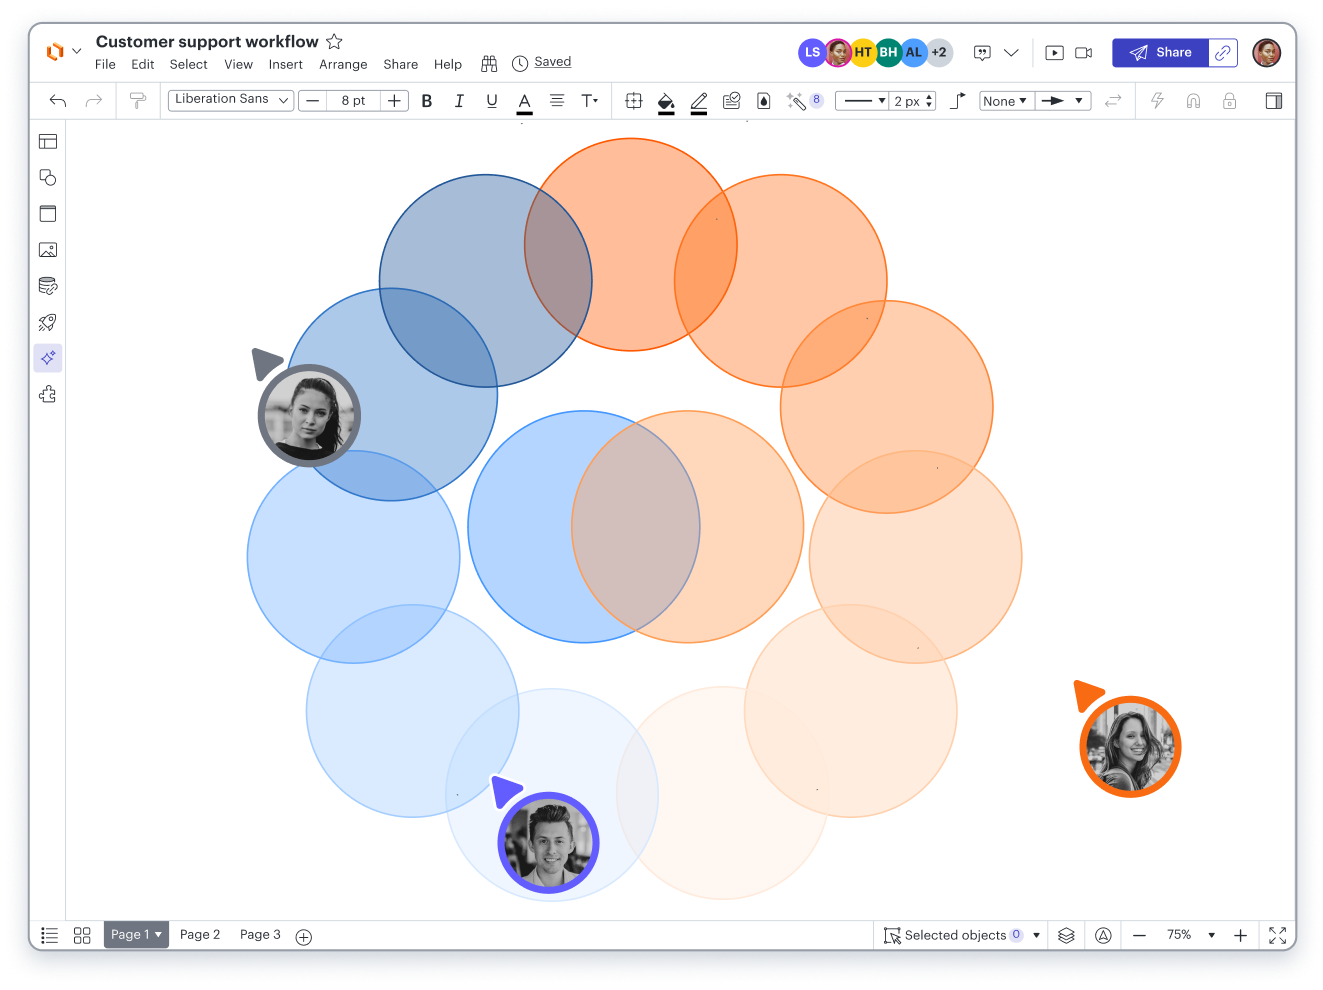
Create a Venn diagram online
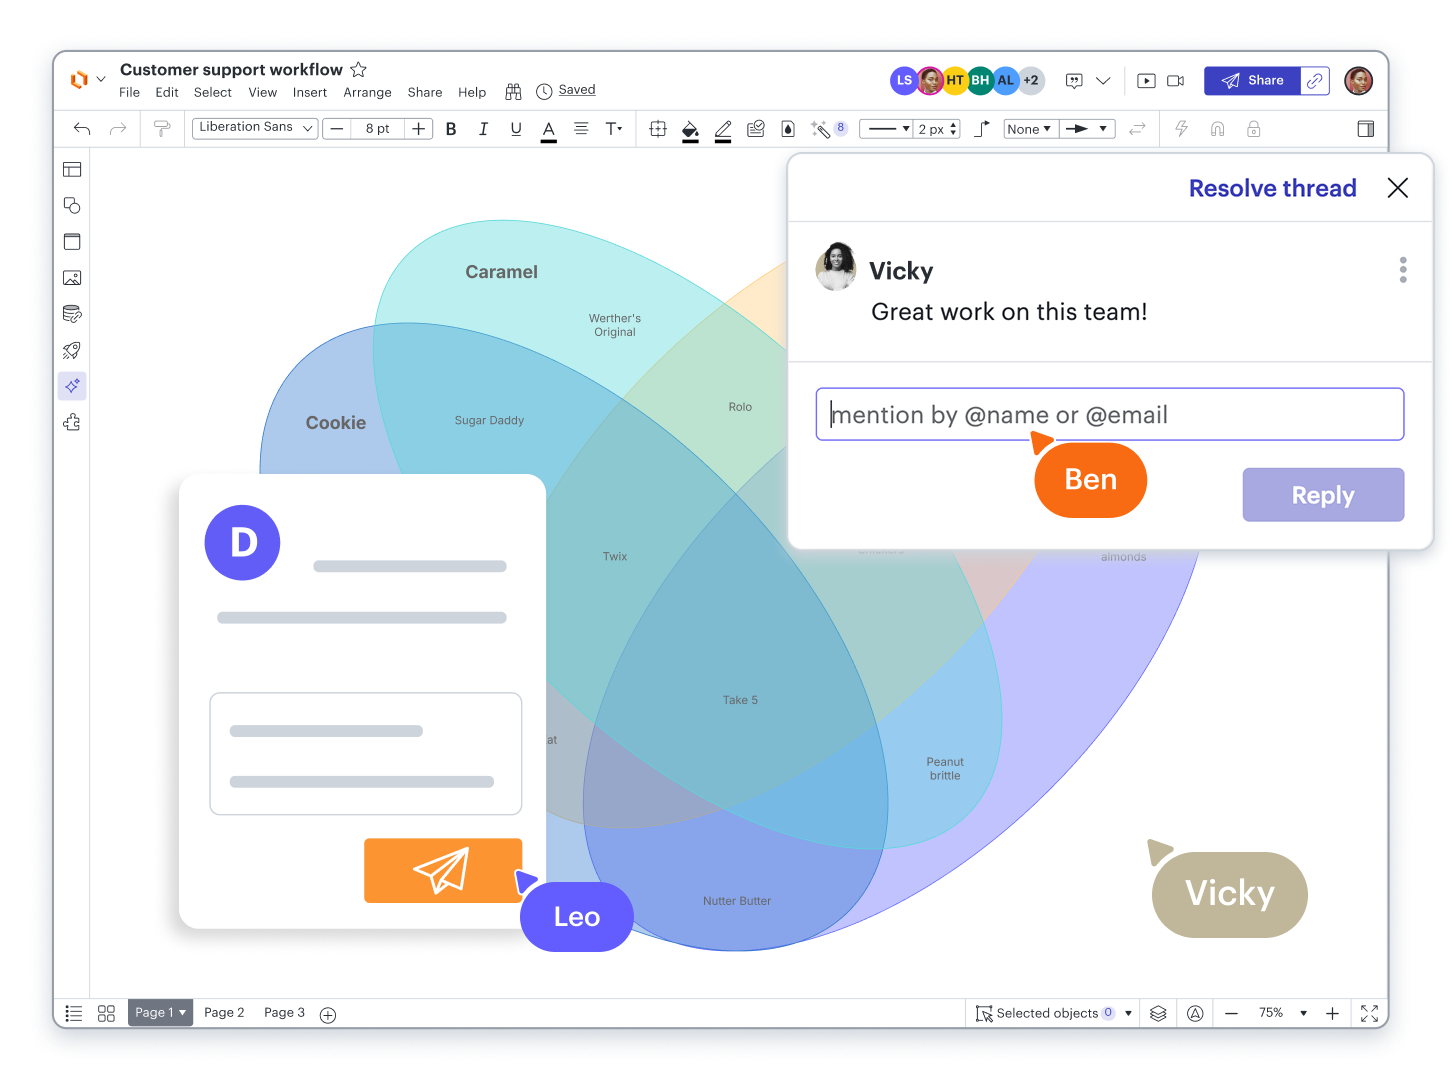
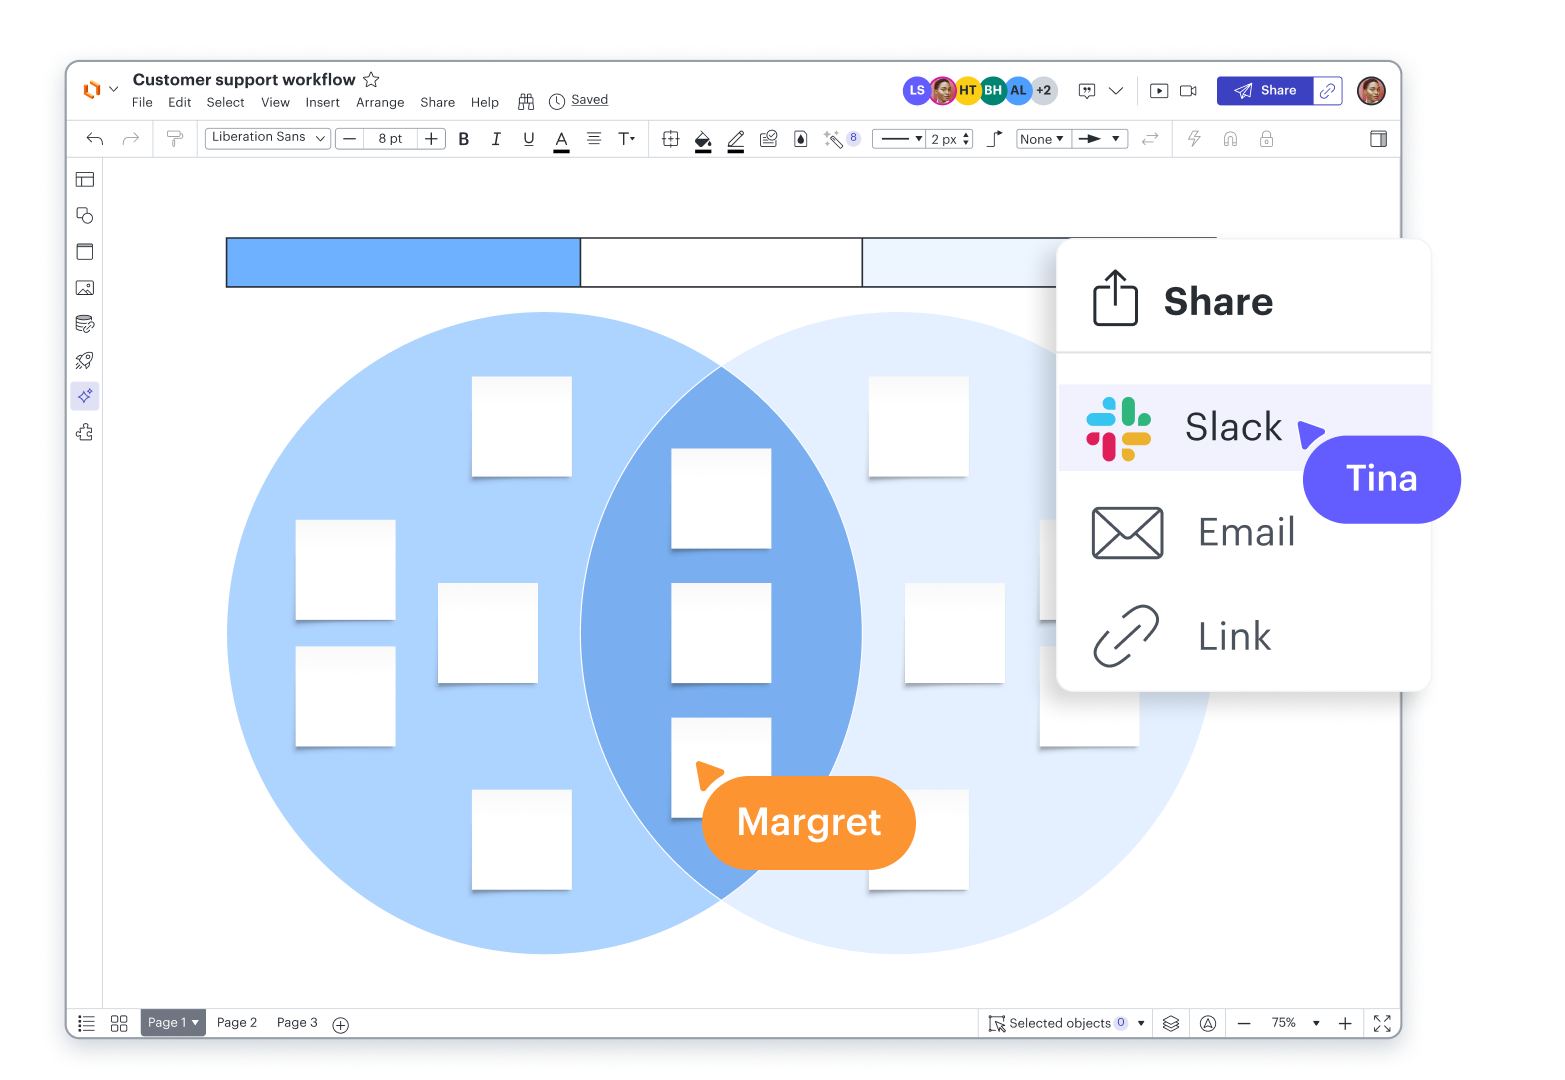
Diagram and discuss in real time
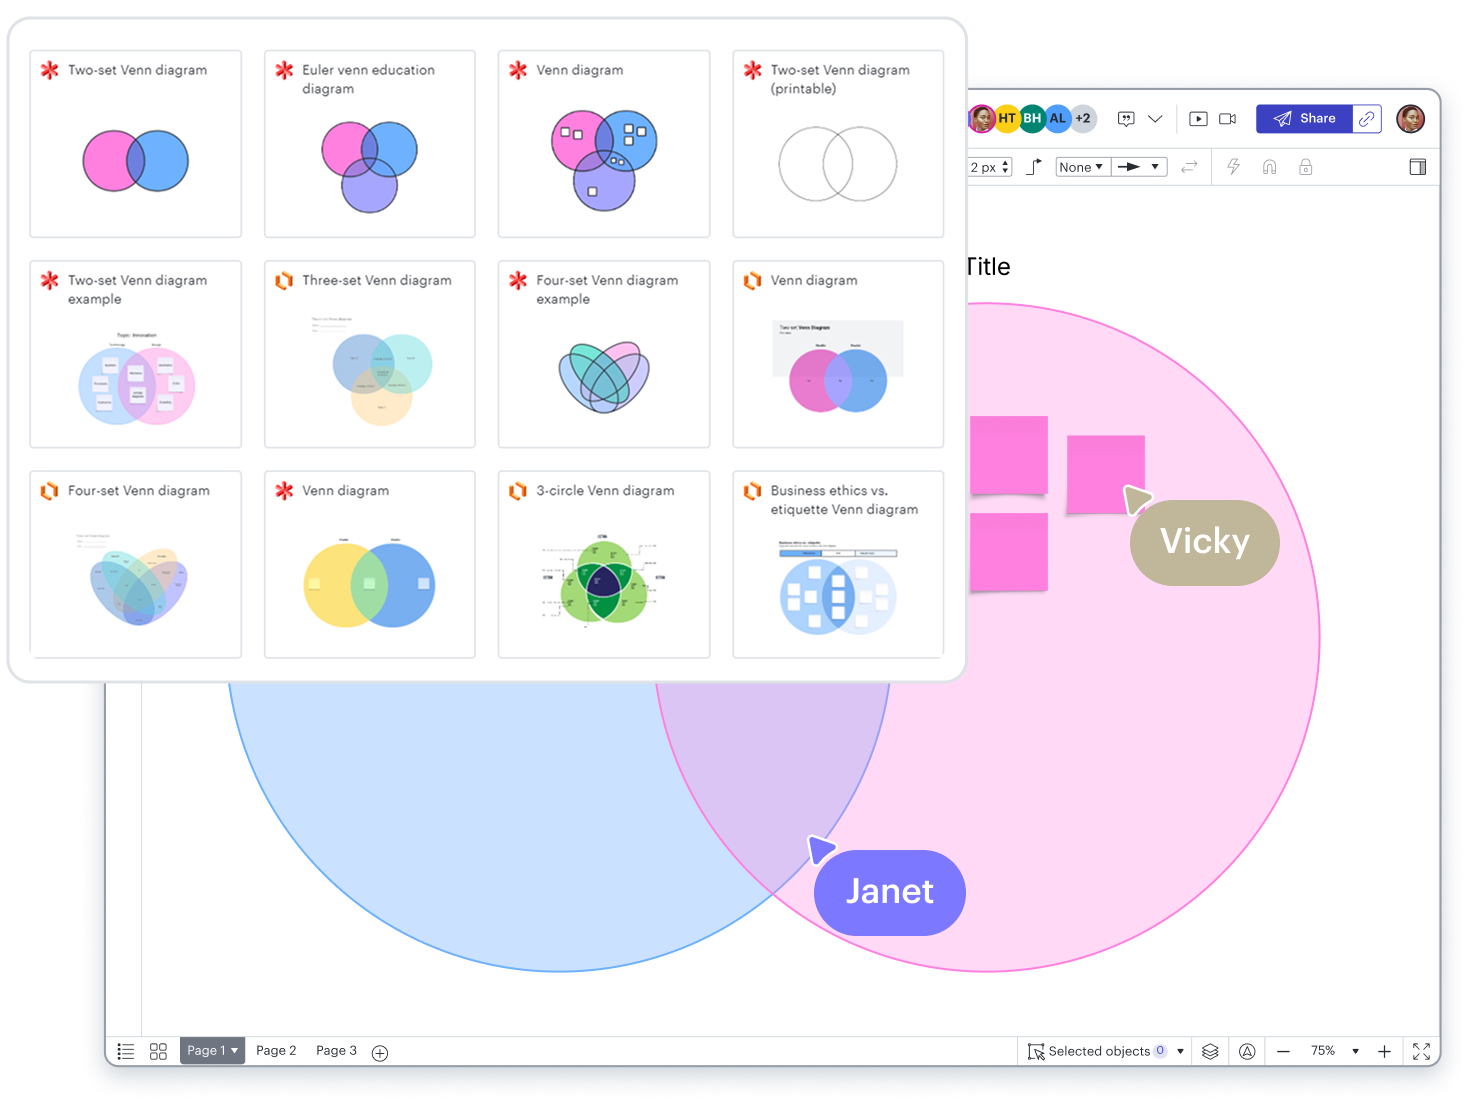
Start with a template or blank canvas
Customize and share your Venn diagram
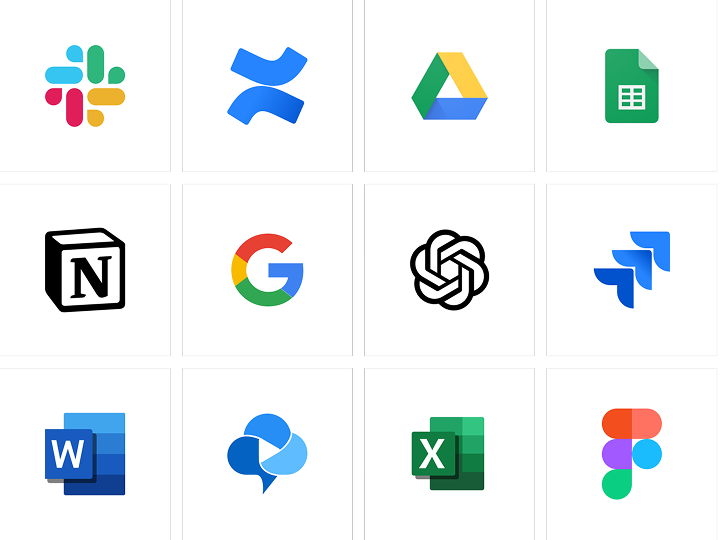
Boost productivity with 100+ integrations
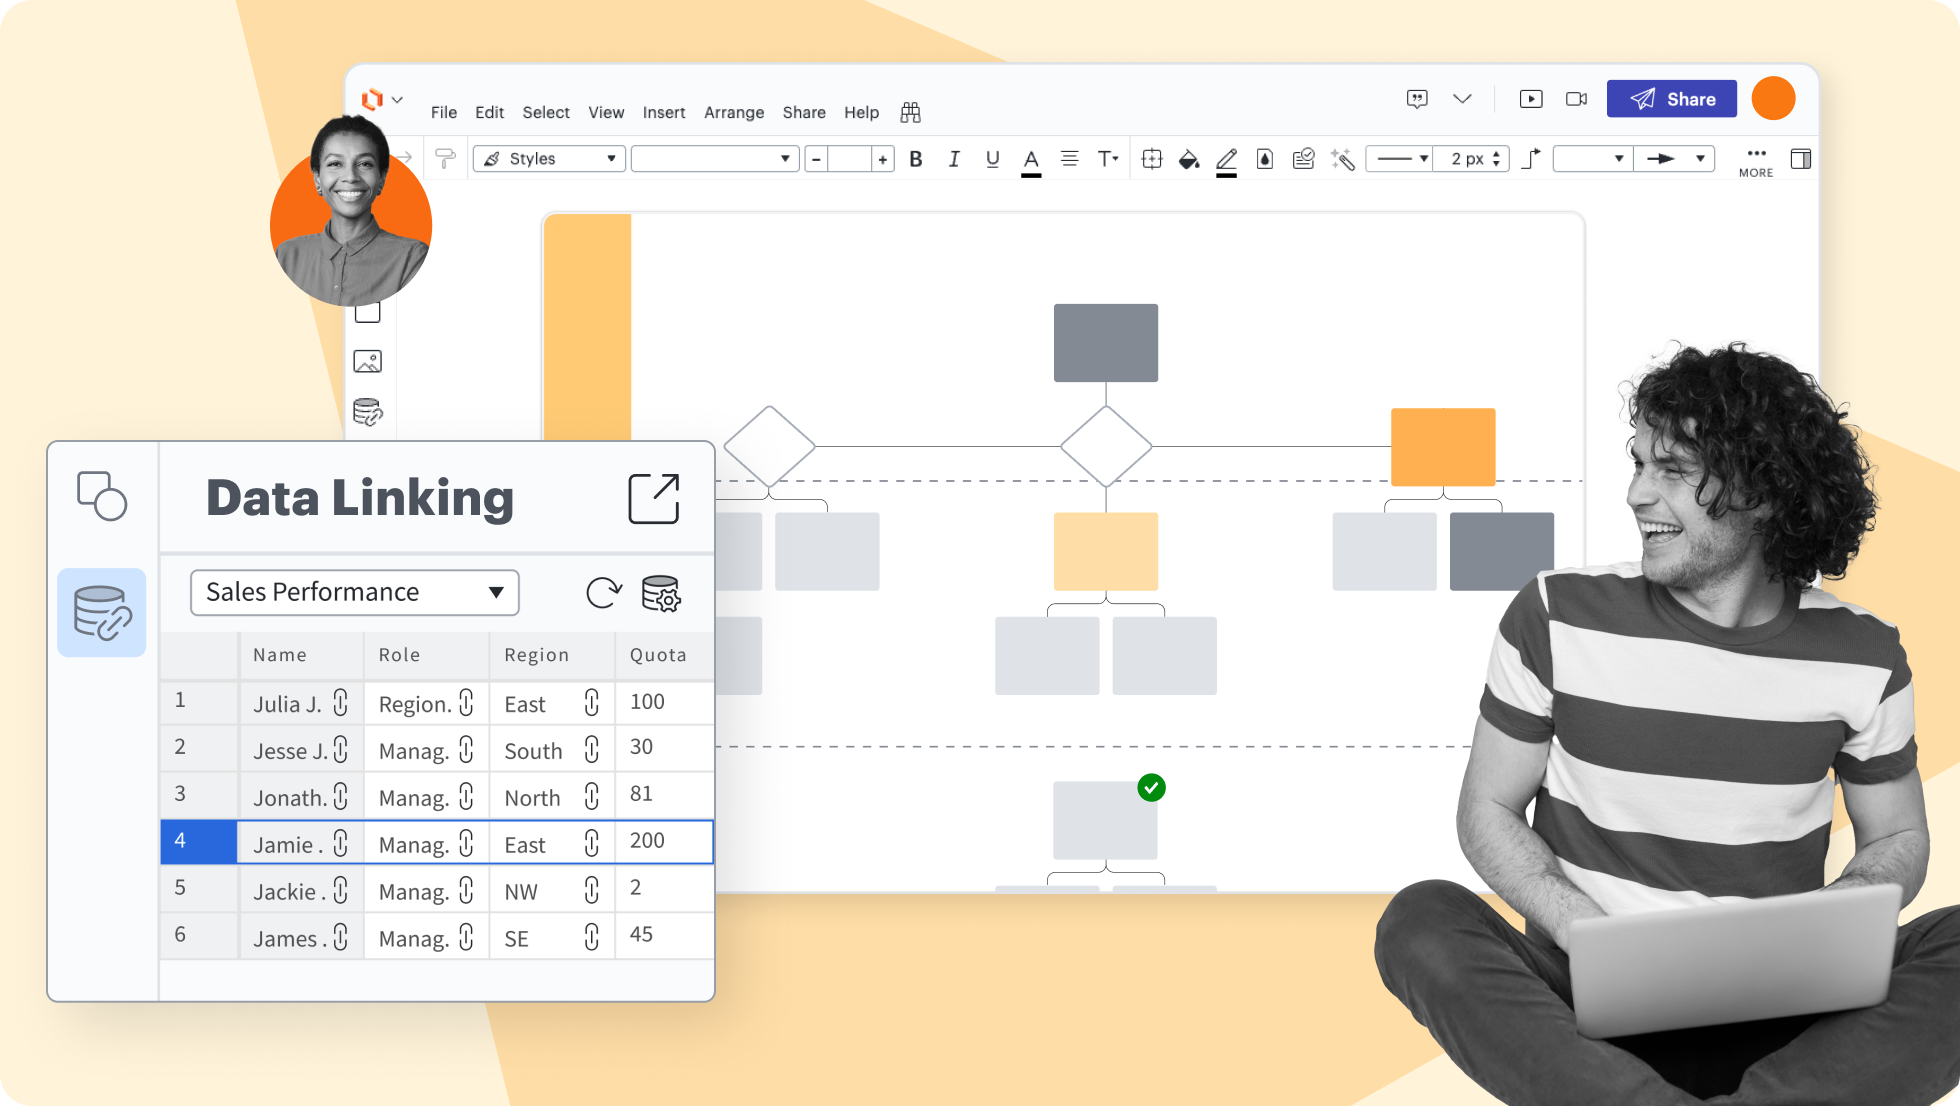
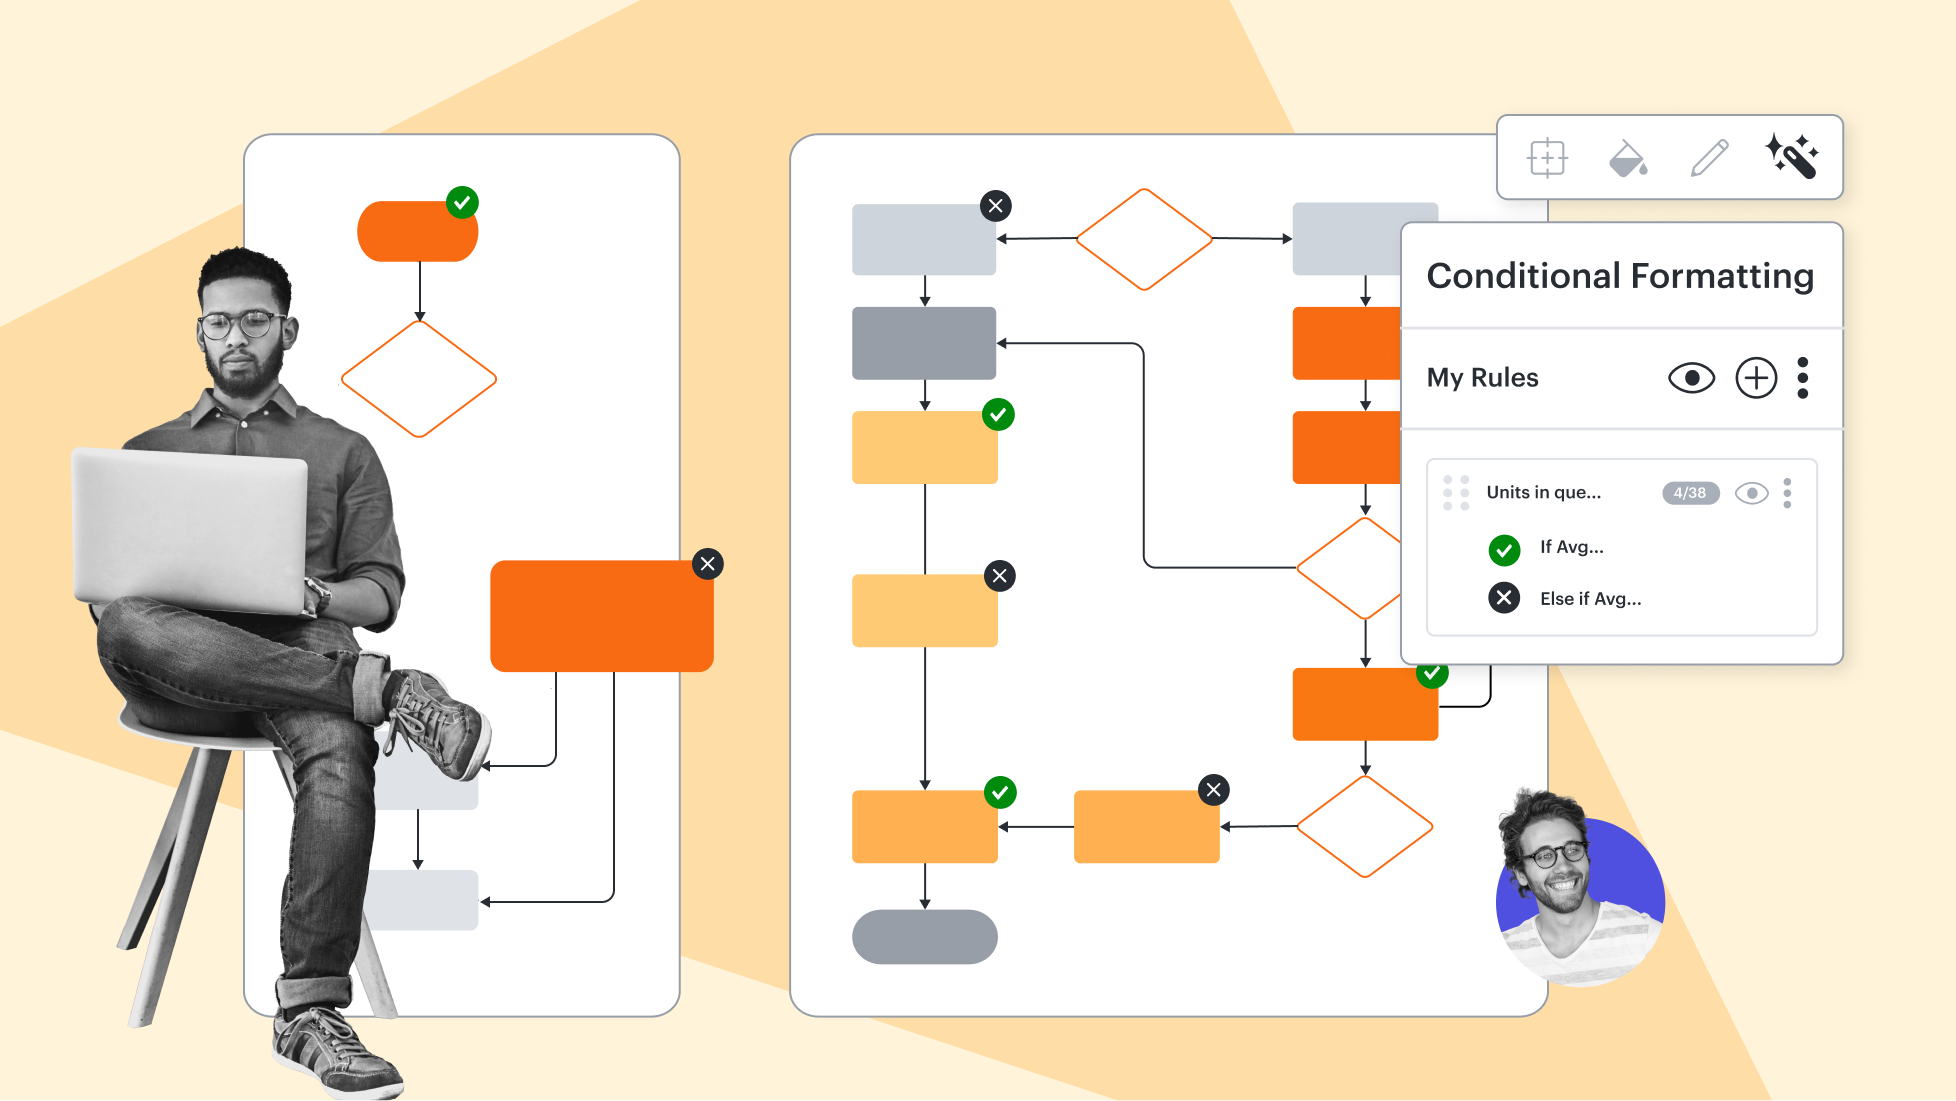
Lucidchart feature highlights


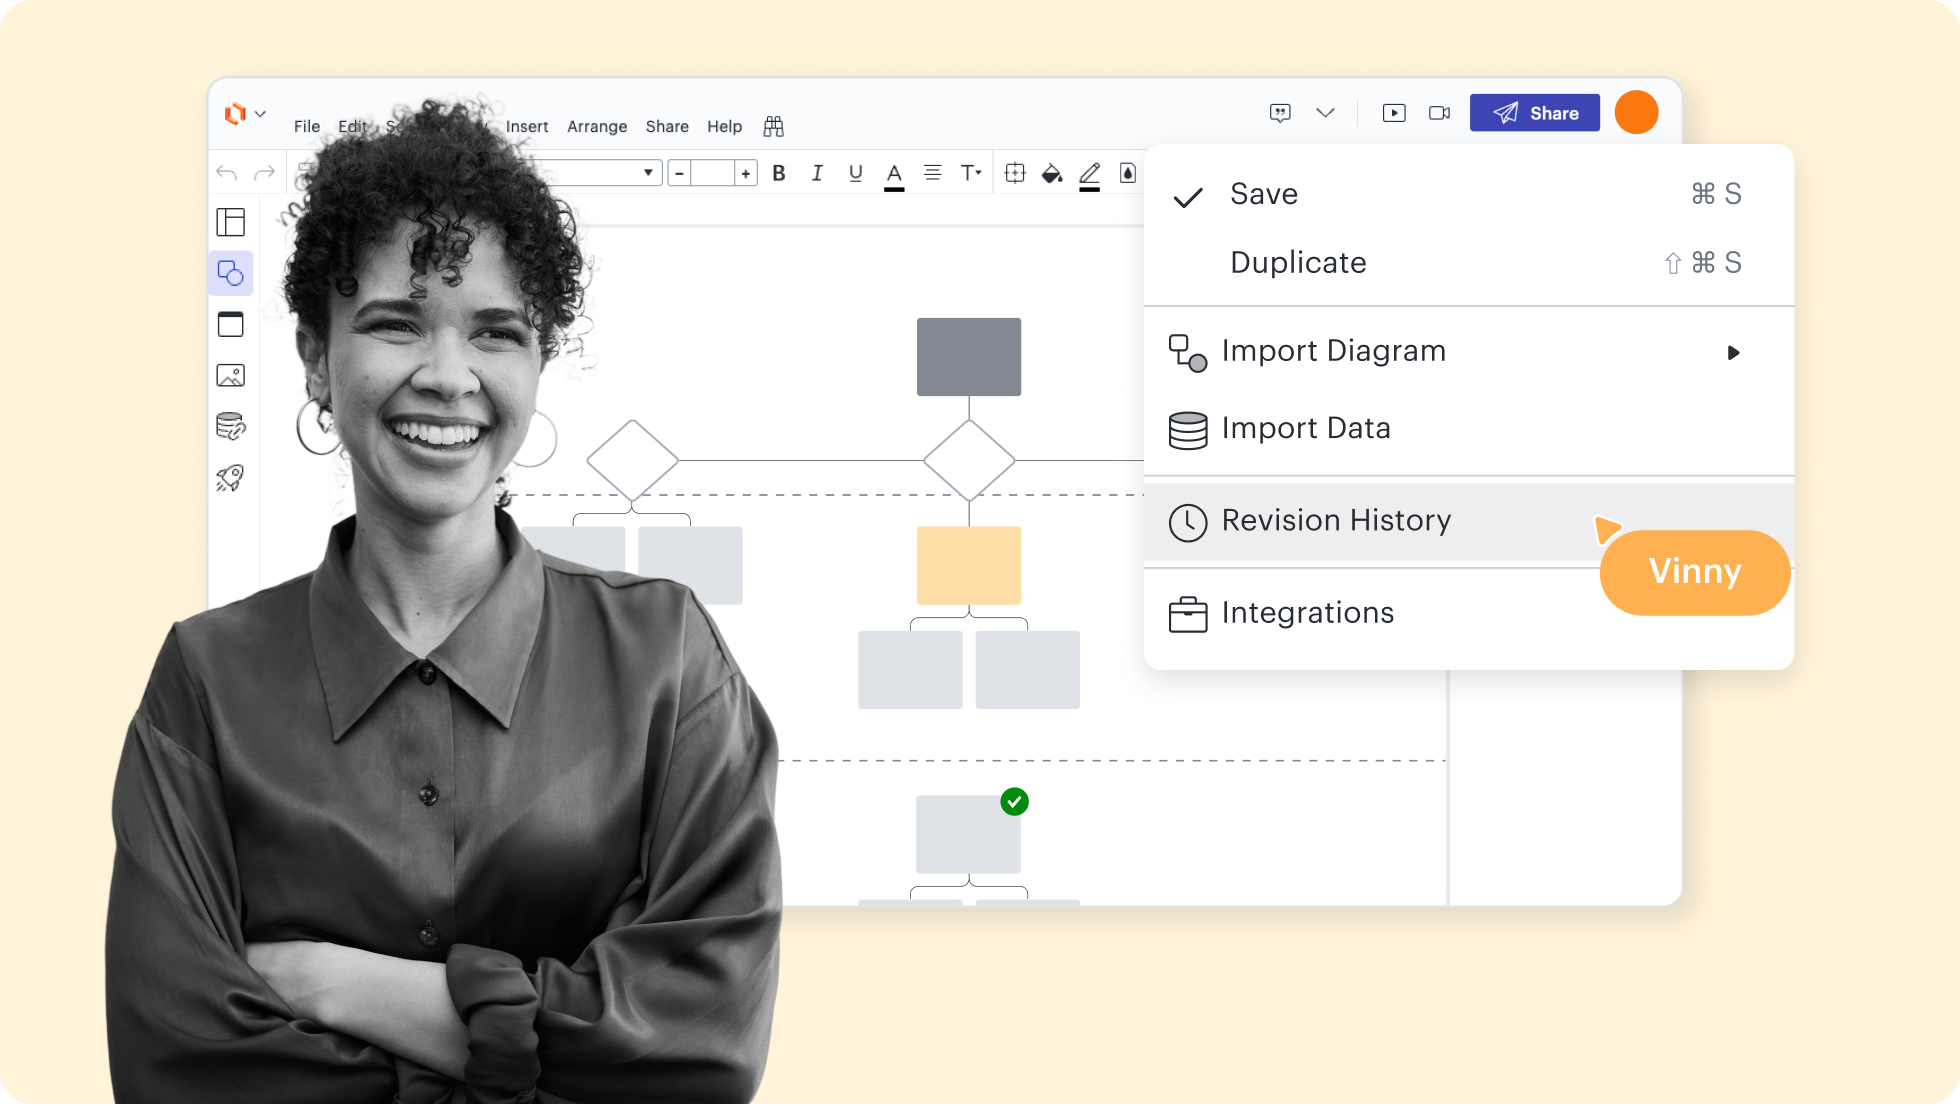


Streamline work by enabling multiple collaborators to create and edit the same diagram at once.
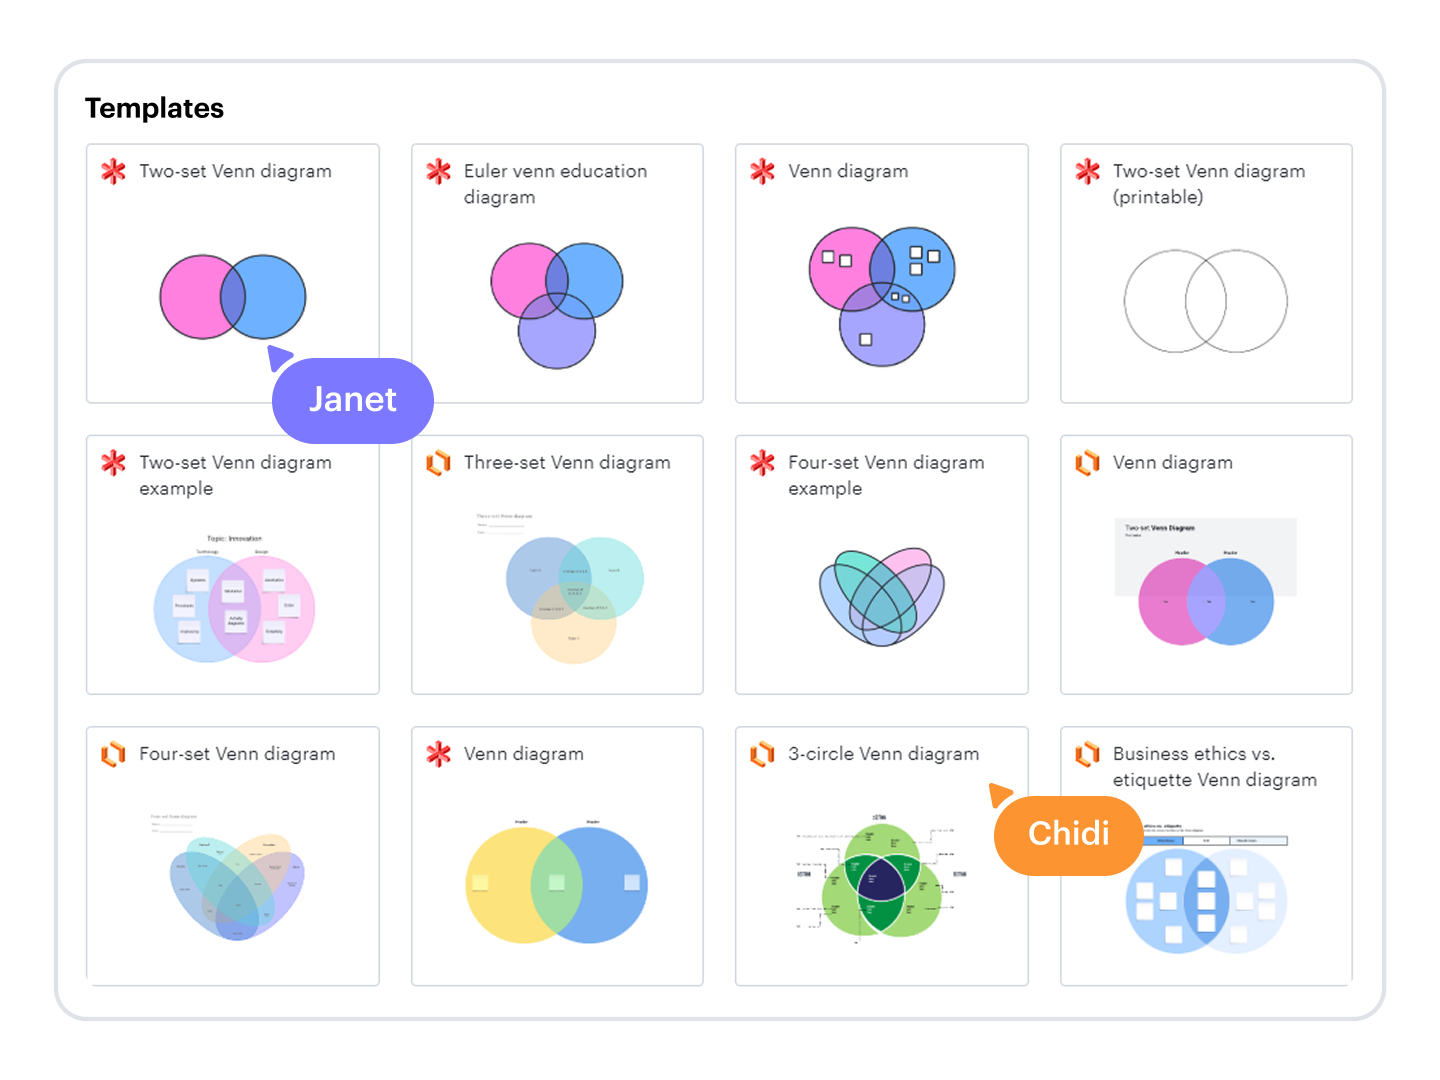
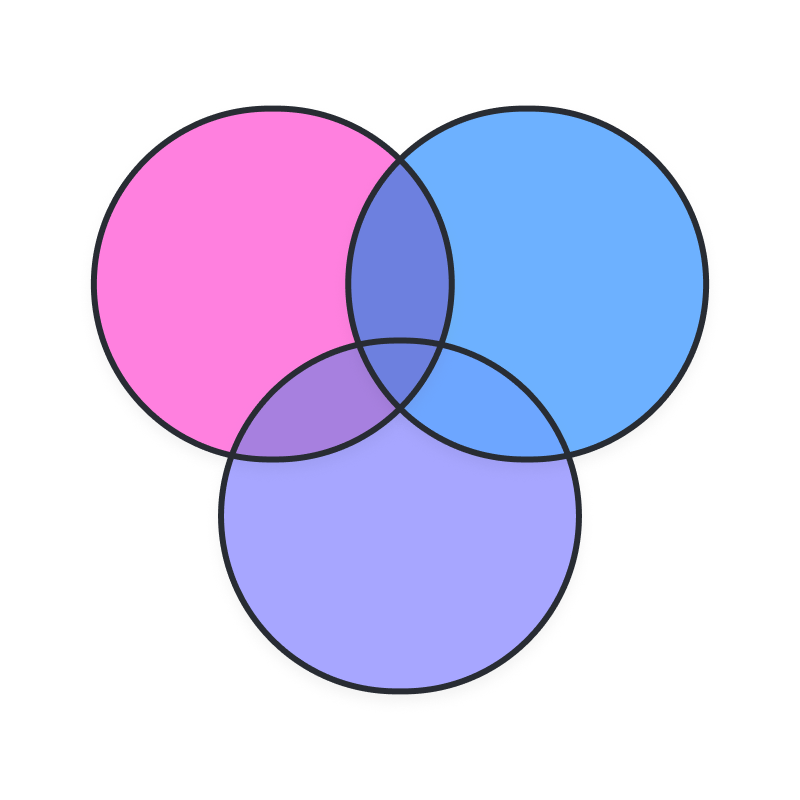
Venn diagram templates
Get inspired and create Venn diagrams faster with free, customizable templates.
Getting started in Lucidchart
Getting Started in Lucidchart
Follow along with this video tutorial and learn how to make any type of diagram in Lucidchart.
Why teams choose Lucidchart
As an intelligent diagramming application, Lucidchart provides simple yet powerful capabilities for visualizing information.

Collaboration. Bring teams together side by side on a shared canvas from anywhere in the world.
Alignment. Build transparency and shared understanding of how a team or company works.
Large-scale change. Increase visibility, standardization, and knowledge sharing across your entire org.
End-to-end workflows. Upgrade to the Lucid Suite for a complete, connected visual collaboration solution.


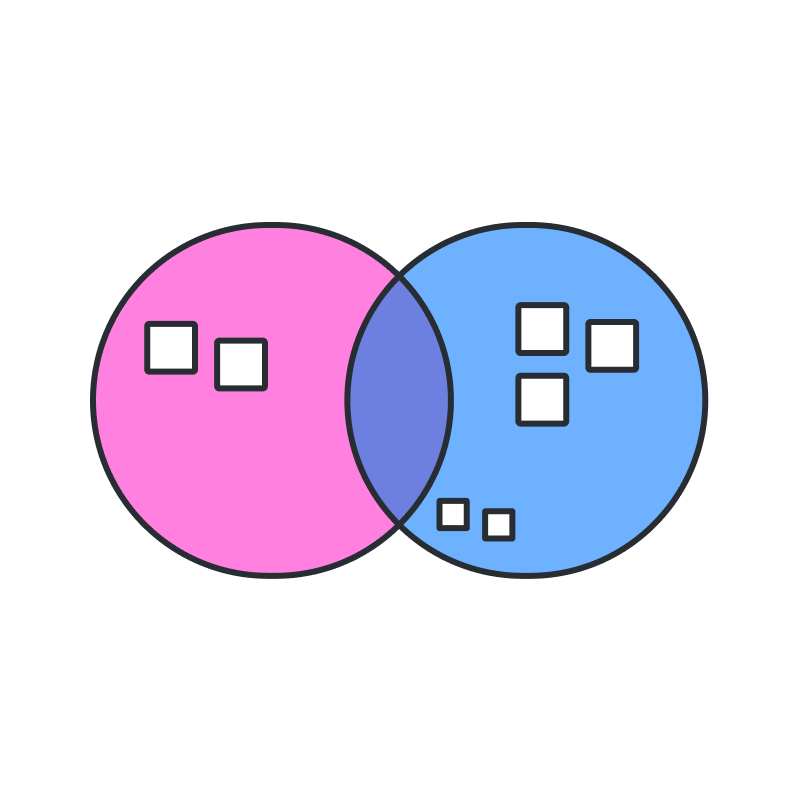
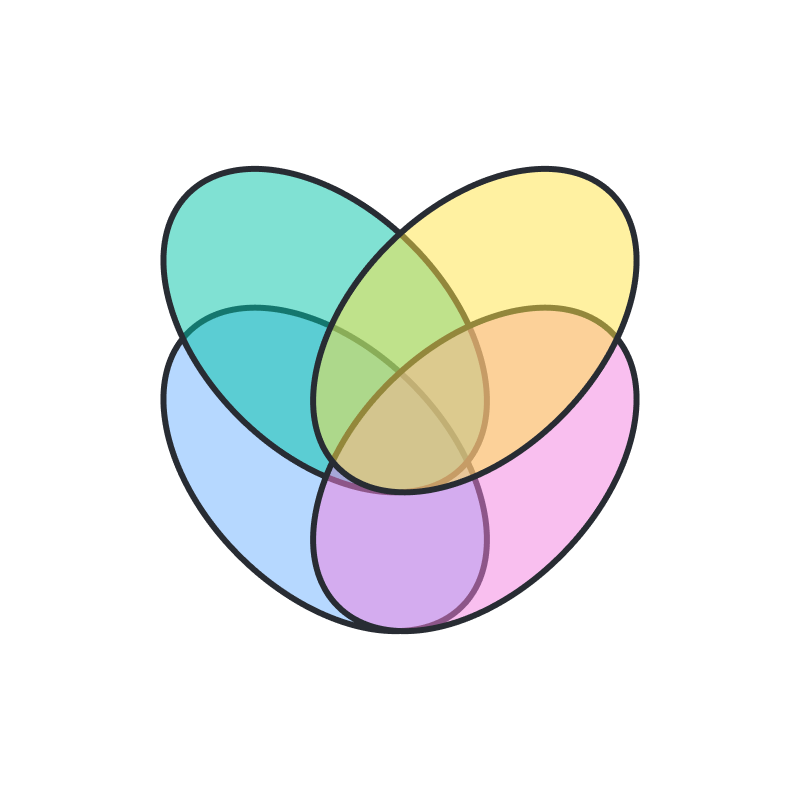
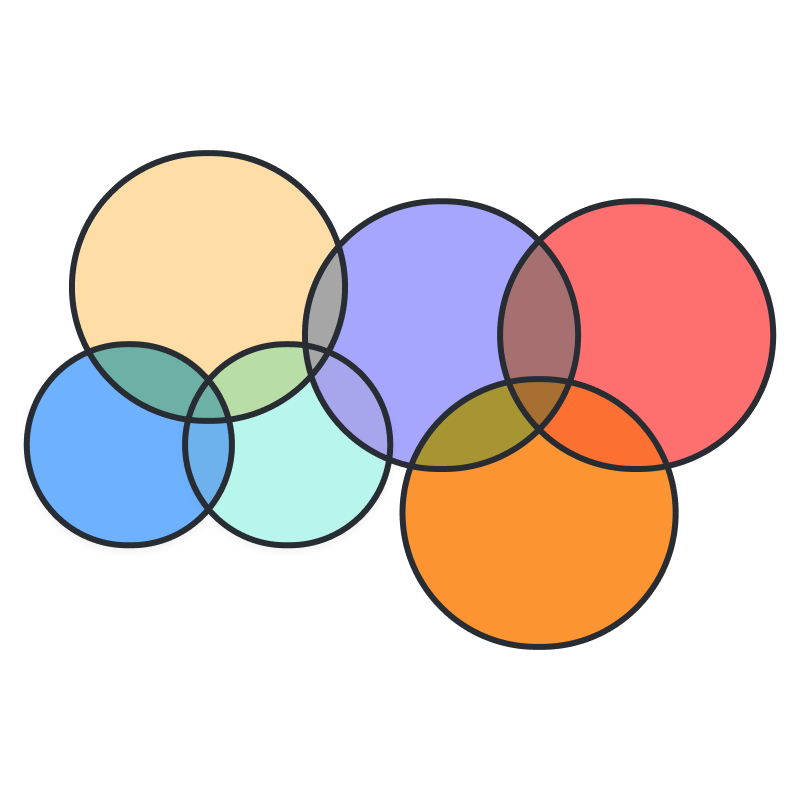
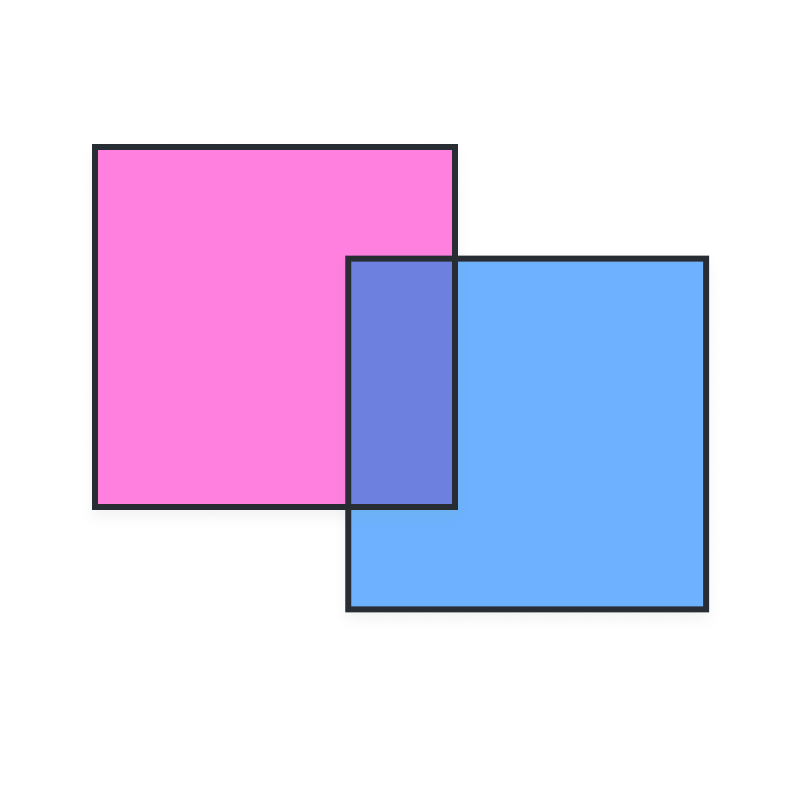
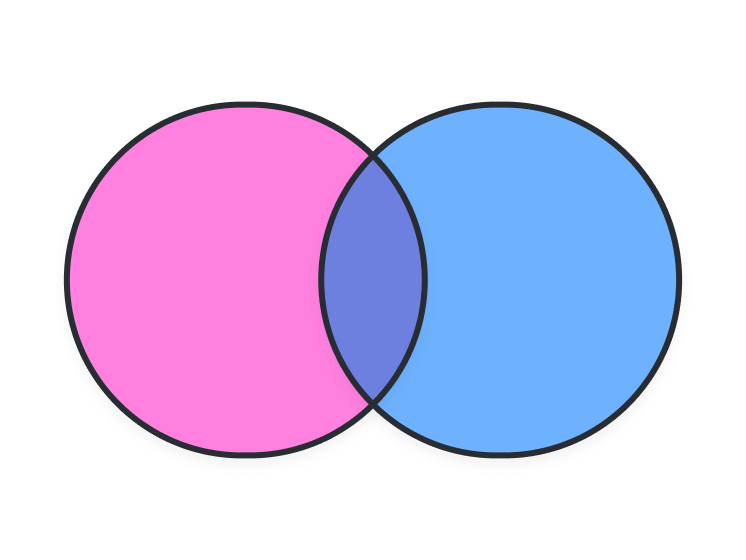
What is a Venn diagram?
A Venn diagram (or set diagram) is a graphical representation of the relationships between two or more sets of elements. Using overlapping circles or other shapes, Venn diagrams highlight the similarities and differences between sets. Venn diagrams are widely used in mathematics, computer science, business, and related fields.
How to make a Venn diagram
Define your sets
Open Lucidchart
Label your circles
Add shared elements
Add unique elements
Additional resources

Lucid Training Labs
Learn visual collaboration skills in free, self-serve courses and live training workshops.

Lucid Community
Connect with other users to share tips and insights. Provide feedback to Lucid’s product team.

Help center
Find detailed articles with step-by-step instructions for using specific Lucid features.

Lucidchart tutorials
Go to the Lucidchart tutorials playlist on YouTube for video training on various topics.
AI diagramming hub
Get an overview of Lucidchart’s AI flowchart generator capabilities and find additional resources.

Lucidchart blog
Read about diagramming trends, and explore tips for creating diagrams in Lucidchart.

Lucidchart pricing
Create a free account and compare options for paid Individual, Team, or Enterprise plans.
Frequently asked questions about Venn diagrams
How much does Lucidchart cost?
Where can I learn the basics of Lucidchart?
How can I format text and add bullet points to a Venn diagram?
How can I adjust the opacity of a Venn diagram circle?
Everything you need to make a Venn diagram
In addition to our Venn diagram maker, Lucidchart offers support and training resources to help you overlap into any type of diagram.
Get support