The database design process
A well-structured database:
- Saves disk space by eliminating redundant data.
- Maintains data accuracy and integrity.
- Provides access to the data in useful ways.
Designing an efficient, useful database is a matter of following the proper process, including these phases:
- Requirements analysis, or identifying the purpose of your database
- Organizing data into tables
- Specifying primary keys and analyzing relationships
- Normalizing to standardize the tables
Let’s take a closer look at each step. Note that this guide deals with Edgar Codd’s relational database model as written in SQL (rather than the hierarchical, network, or object data models). To learn more about database models, read our guide here.
What is a database schema?
A database schema represents the logical configuration of all or part of a relational database. It can exist both as a visual representation and as a set of formulas known as integrity constraints that govern a database. These formulas are expressed in a data definition language, such as SQL. As part of a data dictionary, a database schema indicates how the entities that make up the database relate to one another, including tables, views, stored procedures, and more.

Typically, a database designer creates a database schema to help programmers whose software will interact with the database. The process of creating a database schema is called data modeling. When following the three-schema approach to database design, this step would follow the creation of a conceptual schema. Conceptual schemas focus on an organization’s informational needs rather than the structure of a database.
There are two main kinds of database schema:
- A logical database schema conveys the logical constraints that apply to the stored data. It may define integrity constraints, views, and tables.
- A physical database schema lays out how data is stored physically on a storage system in terms of files and indices.
At the most basic level, a database schema indicates which tables or relations make up the database, as well as the fields included on each table. Thus, the terms schema diagram and entity-relationship diagram are often interchangeable.
Master the basics of Lucidchart in 3 minutes
- Create your first diagram from a template or blank canvas or import a document.
- Add text, shapes, and lines to customize your diagram.
- Learn how to adjust styling and formatting.
- Locate what you need with Feature Find.
- Share your diagram with your team to start collaborating.
Requirements analysis: identifying the purpose of the database
Understanding the purpose of your database will inform your choices throughout the design process. Make sure you consider the database from every perspective. For instance, if you were making a database for a public library, you’d want to consider the ways in which both patrons and librarians would need to access the data.
Here are some ways to gather information before creating the database:
- Interview the people who will use it
- Analyze business forms, such as invoices, timesheets, surveys
- Comb through any existing data systems (including physical and digital files)
Start by gathering any existing data that will be included in the database. Then list the types of data you want to store and the entities, or people, things, locations, and events, that those data describe, like this:
Customers
- Name
- Address
- City, State, Zip
- Email address
Products
- Name
- Price
- Quantity in stock
- Quantity on order
Orders
- Order ID
- Sales representative
- Date
- Product(s)
- Quantity
- Price
- Total
This information will later become part of the data dictionary, which outlines the tables and fields within the database. Be sure to break down the information into the smallest useful pieces. For instance, consider separating the street address from the country so that you can later filter individuals by their country of residence. Also, avoid placing the same data point in more than one table, which adds unnecessary complexity.
Once you know what kinds of data the database will include, where that data comes from, and how it will be used, you’re ready to start planning out the actual database.
Database structure: the building blocks of a database
The next step is to lay out a visual representation of your database. To do that, you need to understand exactly how relational databases are structured.
Within a database, related data are grouped into tables, each of which consists of rows (also called tuples) and columns, like a spreadsheet.
To convert your lists of data into tables, start by creating a table for each type of entity, such as products, sales, customers, and orders. Here’s an example:
Each row of a table is called a record. Records include data about something or someone, such as a particular customer. By contrast, columns (also known as fields or attributes) contain a single type of information that appears in each record, such as the addresses of all the customers listed in the table.
| First Name | Last Name | Age | ZIP Code |
|---|---|---|---|
| Roger | Williams | 43 | 34760 |
| Jerrica | Jorgensen | 32 | 97453 |
| Samantha | Hopkins | 56 | 64829 |
To keep the data consistent from one record to the next, assign the appropriate data type to each column. Common data types include:
- CHAR - a specific length of text
- VARCHAR - text of variable lengths
- TEXT - large amounts of text
- INT - positive or negative whole number
- FLOAT, DOUBLE - can also store floating point numbers
- BLOB - binary data
Some database management systems also offer the Autonumber data type, which automatically generates a unique number in each row.
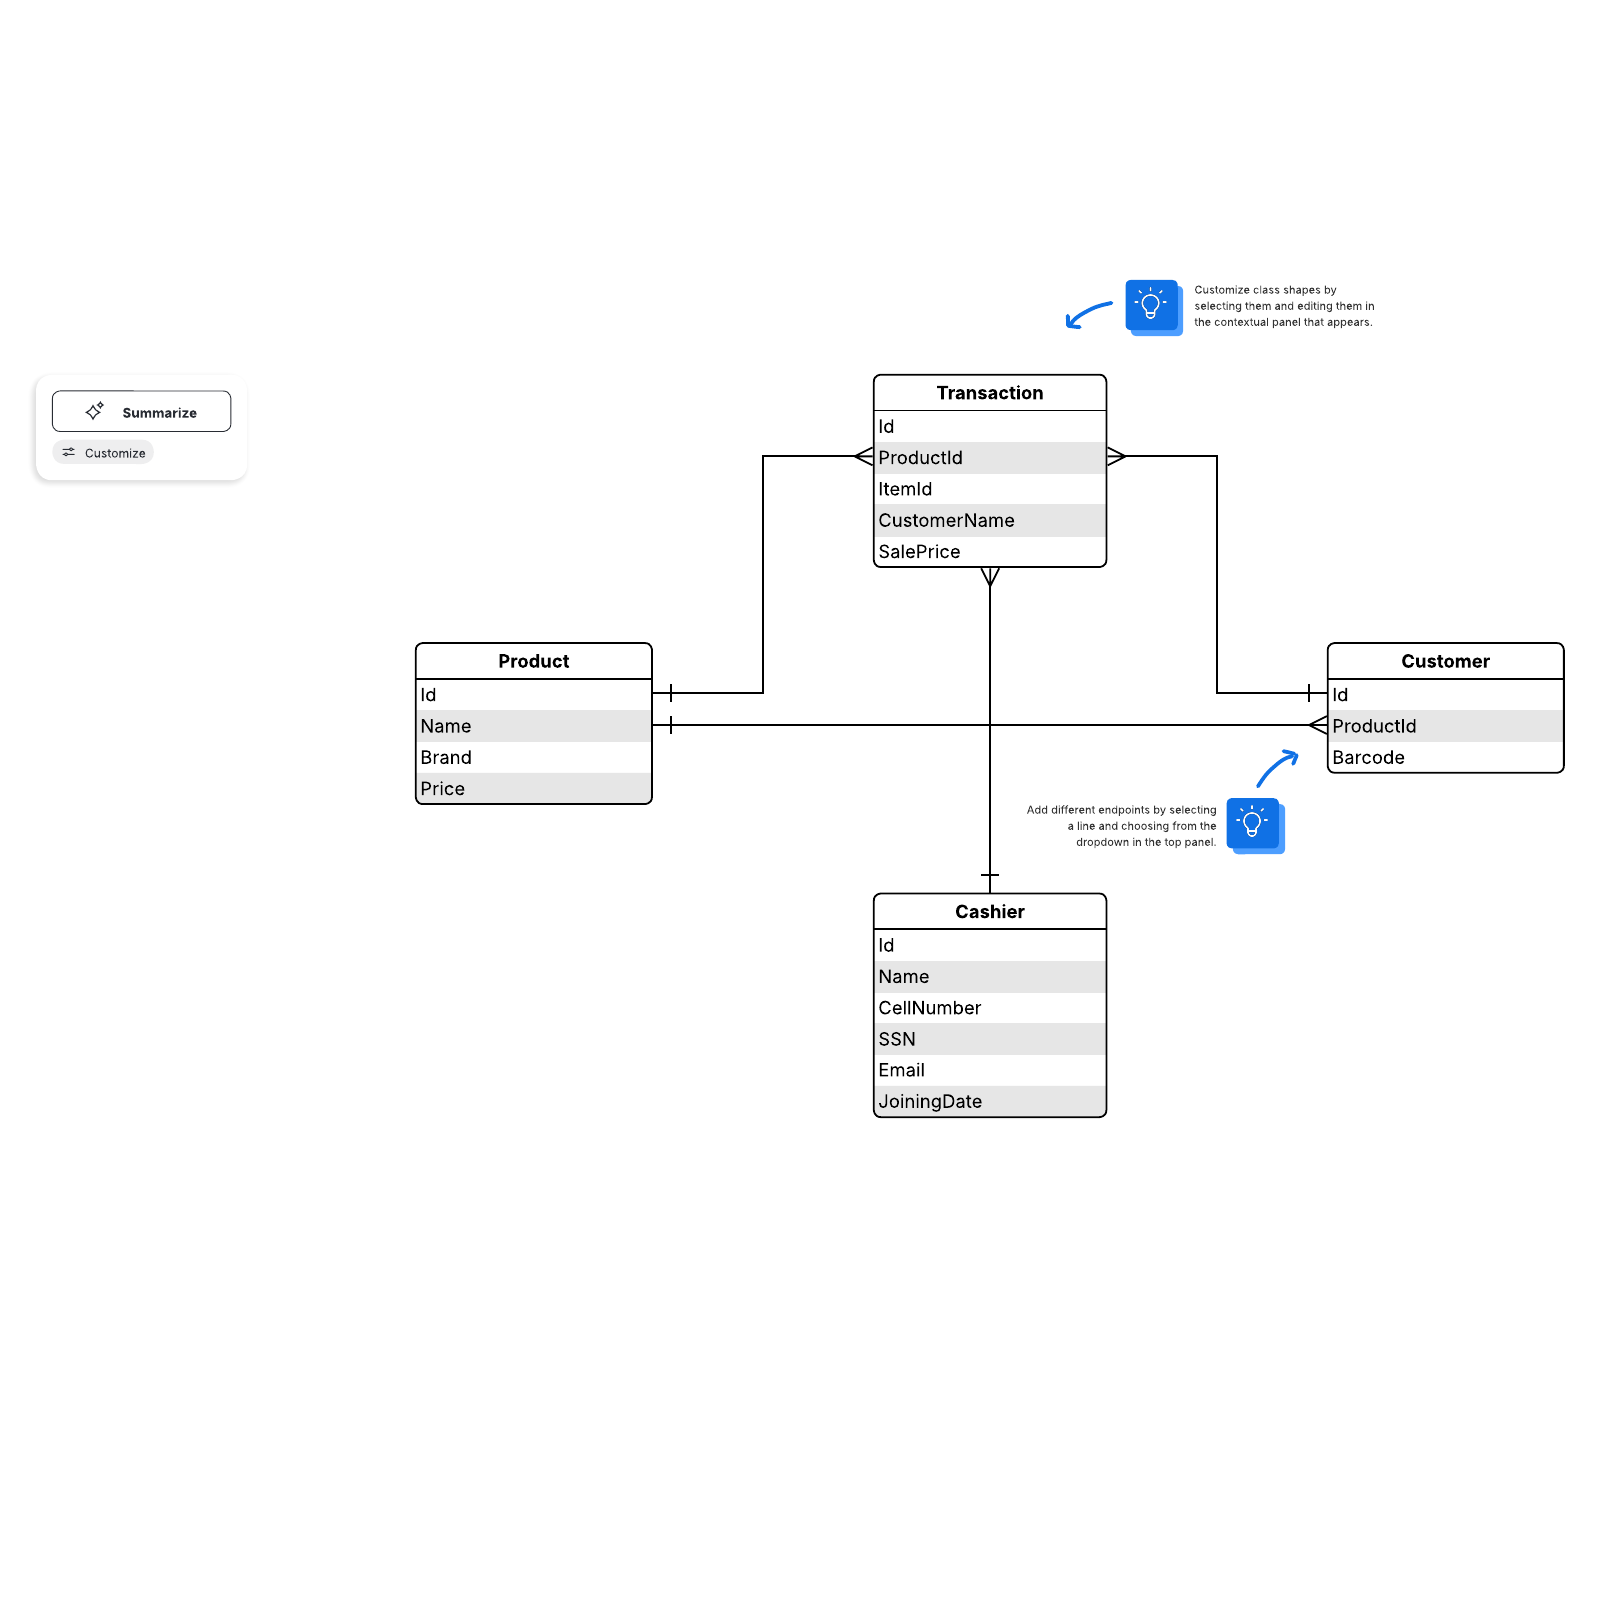
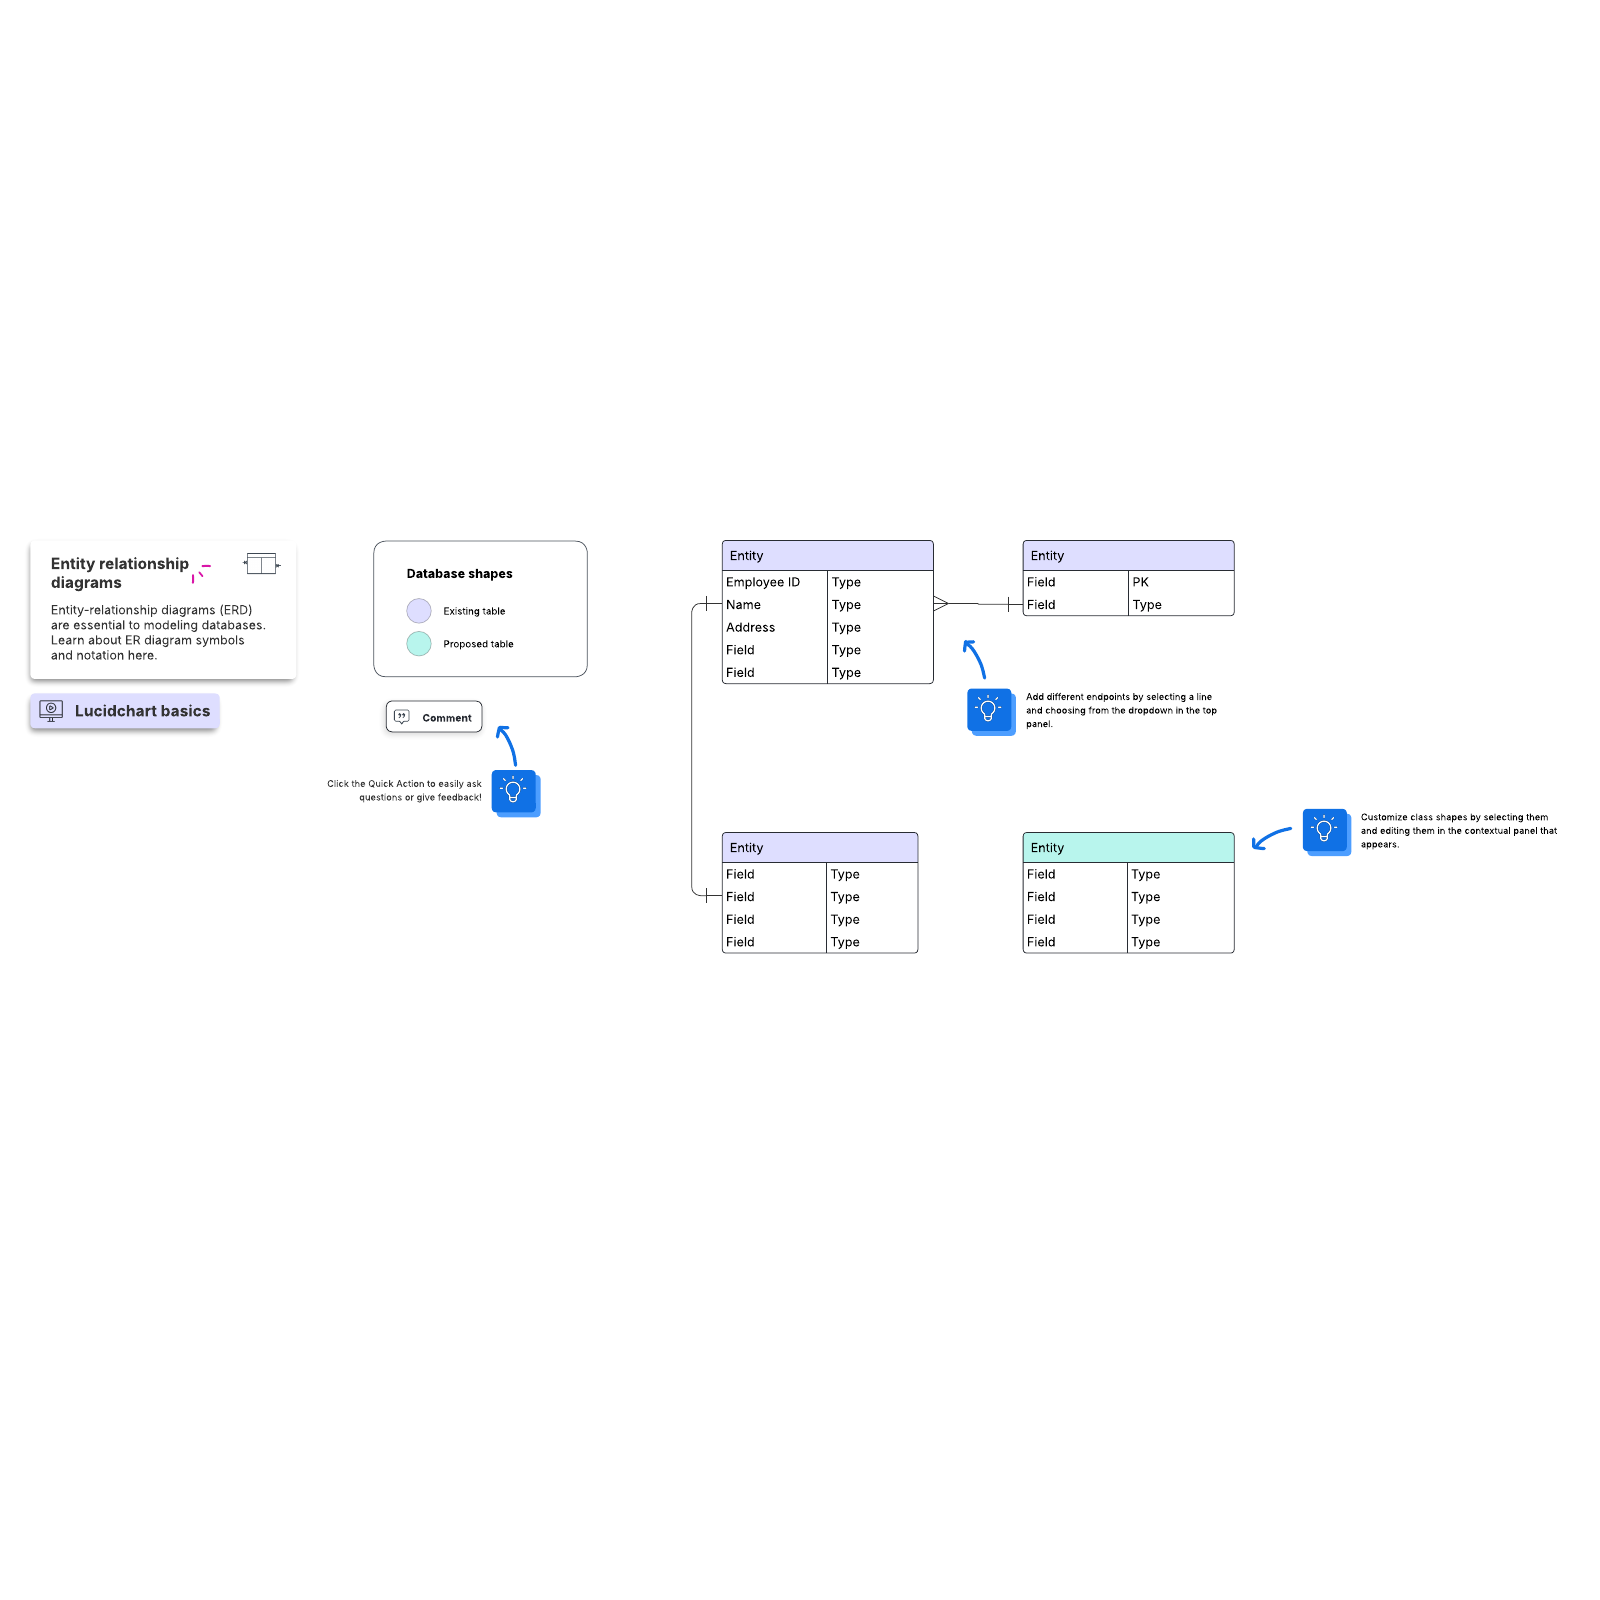
For the purposes of creating a visual overview of the database, known as an entity-relationship diagram, you won’t include the actual tables. Instead, each table becomes a box in the diagram. The title of each box should indicate what the data in that table describes, while attributes are listed below, like this:

Finally, you should decide which attribute or attributes will serve as the primary key for each table, if any. A primary key (PK) is a unique identifier for a given entity, meaning that you could pick out an exact customer even if you only knew that value.
Attributes chosen as primary keys should be unique, unchanging, and always present (never NULL or empty). For this reason, order numbers and usernames make good primary keys, while telephone numbers or street addresses do not. You can also use multiple fields in conjunction as the primary key (this is known as a composite key).
When it comes time to create the actual database, you’ll put both the logical data structure and the physical data structure into the data definition language supported by your database management system. At that point, you should also estimate the size of the database to be sure you can get the performance level and storage space it will require.
Creating relationships between entities
With your database tables now converted into tables, you’re ready to analyze the relationships between those tables. Cardinality refers to the quantity of elements that interact between two related tables. Identifying the cardinality helps make sure you’ve divided the data into tables most efficiently.
Each entity can potentially have a relationship with every other one, but those relationships are typically one of three types:
One-to-one relationships
When there’s only one instance of Entity A for every instance of Entity B, they are said to have a one-to-one relationship (often written 1:1). You can indicate this kind of relationship in an ER diagram with a line with a dash on each end:

Unless you have a good reason not to, a 1:1 relationship usually indicates that you’d be better off combining the two tables’ data into a single table.
However, you might want to create tables with a 1:1 relationship under a particular set of circumstances. If you have a field with optional data, such as “description,” that is blank for many of the records, you can move all of the descriptions into their own table, eliminating empty space and improving database performance.
To guarantee that the data matches up correctly, you’d then have to include at least one identical column in each table, most likely the primary key.
One-to-many relationships
These relationships occur when a record in one table is associated with multiple entries in another. For example, a single customer might have placed many orders, or a patron may have multiple books checked out from the library at once. One-to-many (1:M) relationships are indicated with what’s called “Crow’s foot notation,” as in this example:

To implement a 1:M relationship as you set up a database, simply add the primary key from the “one” side of the relationship as an attribute in the other table. When a primary key is listed in another table in this manner, it’s called a foreign key. The table on the “1” side of the relationship is a considered a parent table to the child table on the other side.
Many-to-many relationships
When multiple entities from a table can be associated with multiple entities in another table, they are said to have a many-to-many (M:N) relationship. This might happen in the case of students and classes, since a student can take many classes and a class can have many students.
In an ER diagram, these relationships are portrayed with these lines:

Unfortunately, it’s not directly possible to implement this kind of relationship in a database. Instead, you have to break it up into two one-to-many relationships.
To do so, create a new entity between those two tables. If the M:N relationship exists between sales and products, you might call that new entity “sold_products,” since it would show the contents of each sale. Both the sales and products tables would have a 1:M relationship with sold_products. This kind of go-between entity is called a link table, associative entity, or junction table in various models.
Each record in the link table would match together two of the entities in the neighboring tables (it may include supplemental information as well). For instance, a link table between students and classes might look like this:

Mandatory or not?
Another way to analyze relationships is to consider which side of the relationship has to exist for the other to exist. The non-mandatory side can be marked with a circle on the line where a dash would be. For instance, a country has to exist for it to have a representative in the United Nations, but the opposite is not true:

Two entities can be mutually dependent (one could not exist without the other).
Recursive relationships
Sometimes a table points back to itself. For example, a table of employees might have an attribute “manager” that refers to another individual in that same table. This is called a recursive relationship.
Redundant relationships
A redundant relationship is one that is expressed more than once. Typically, you can remove one of the relationships without losing any important information. For instance, if an entity “students” has a direct relationship with another called “teachers” but also has a relationship with teachers indirectly through “classes,” you’d want to remove the relationship between “students” and “teachers.” It’s better to delete that relationship because the only way that students are assigned to teachers is through classes.
Database normalization
Once you have a preliminary design for your database, you can apply normalization rules to make sure the tables are structured correctly. Think of these rules as the industry standards.
That said, not all databases are good candidates for normalization. In general, online transaction processing (OLTP for short) databases, in which users are concerned with creating, reading, updating, and deleting records, should be normalized.
Online analytical processing (OLAP) databases which favor analysis and reporting might fare better with a degree of denormalization, since the emphasis is on speed of calculation. These include decision support applications in which data needs to be analyzed quickly but not changed.
Each form, or level of normalization, includes the rules associated with the lower forms.
First normal form
The first normal form (abbreviated as 1NF) specifies that each cell in the table can have only one value, never a list of values, so a table like this does not comply:
| ProductID | Color | Price |
|---|---|---|
| 1 | brown, yellow | $15 |
| 2 | red, green | $13 |
| 3 | blue, orange | $11 |
You might be tempted to get around this by splitting that data into additional columns, but that’s also against the rules: a table with groups of repeated or closely related attributes does not meet the first normal form. The table below, for example, fails to comply:

Instead, split the data into multiple tables or records until each cell holds only one value and there are no extra columns. At that point, the data is said to be atomic, or broken down to the smallest useful size. For the table above, you could create an additional table called “Sales details” that would match specific products with sales. “Sales” would then have a 1:M relationship with “Sales details.”
Second normal form
The second normal form (2NF) mandates that each of the attributes should be fully dependent on the entire primary key. That means each attribute should depend directly on the primary key, rather than indirectly through some other attribute.
For instance, an attribute “age” that depends on “birthdate” which in turn depends on “studentID” is said to have a partial functional dependency, and a table containing these attributes would fail to meet the second normal form.
Furthermore, a table with a primary key made up of multiple fields violates the second normal form if one or more of the other fields do not depend on every part of the key.
Thus, a table with these fields wouldn’t meet the second normal form, because the attribute “product name” depends on the product ID but not on the order number:
-
Order number (primary key)
-
Product ID (primary key)
- Product name
Third normal form
The third normal form (3NF) adds to these rules the requirement that every non-key column be independent of every other column. If changing a value in one non-key column causes another value to change, that table does not meet the third normal form.
This keeps you from storing any derived data in the table, such as the “tax” column below, which directly depends on the total price of the order:
| Order | Price | Tax |
| 14325 | $40.99 | $2.05 |
| 14326 | $13.73 | $.69 |
| 14327 | $24.15 | $1.21 |
Additional forms of normalization have been proposed, including the Boyce-Codd normal form, the fourth through sixth normal forms, and the domain-key normal form, but the first three are the most common.
While these forms explain the best practices to follow generally, the degree of normalization depends on the context of the database.
Multidimensional data
Some users may want to access multiple dimensions of a single type of data, particularly in OLAP databases. For instance, they may want to know the sales by customer, state, and month. In this situation, it’s best to create a central fact table that other customer, state, and month tables can refer to, like this:

Data integrity rules
You should also configure your database to validate the data according to the appropriate rules. Many database management systems, such as Microsoft Access, enforce some of these rules automatically.
The entity integrity rule says that the primary key can never be NULL. If the key is made up of multiple columns, none of them can be NULL. Otherwise, it could fail to uniquely identify the record.
The referential integrity rule requires each foreign key listed in one table to be matched with one primary key in the table it references. If the primary key changes or is deleted, those changes will need to be implemented wherever that key is referenced throughout the database.
Business logic integrity rules make sure that the data fits within certain logical parameters. For instance, an appointment time would have to fall within normal business hours.
Adding indexes and views
An index is essentially a sorted copy of one or more columns, with the values either in ascending or descending order. Adding an index allows users to find records more quickly. Instead of re-sorting for each query, the system can access records in the order specified by the index.
Although indexes speed up data retrieval, they can slow down inserting, updating, and deleting, since the index has to be rebuilt whenever a record is changed.
A view is simply a saved query on the data. They can usefully join data from multiple tables or else show part of a table.
Extended properties
Once you have the basic layout completed, you can refine the database with extended properties, such as instructional text, input masks, and formatting rules that apply to a particular schema, view, or column. The advantage is that, because these rules are stored in the database itself, the presentation of the data will be consistent across the multiple programs that access the data.
SQL and UML
The Unified Modeling Language (UML) is another visual way of expressing complex systems created in an object-oriented language. Several of the concepts mentioned in this guide are known in UML under different names. For instance, an entity is known as a class in UML.
UML is not used as frequently today as it once was. Today, it is often used academically and in communications between software designers and their clients.
Database management systems
Many of the design choices you will make depend on which database management system you use. Some of the most common systems include:
-
Oracle DB
-
MySQL
-
Microsoft SQL Server
-
PostgreSQL
-
IBM DB2
When given the choice, pick an appropriate database management system based on cost, operating systems, features, and more.
Schema in Oracle Database system
In the Oracle database system, the term database schema, which is also known as "SQL schema," has a different meaning. Here, a database can have multiple schemas (or “schemata,” if you’re feeling fancy). Each one contains all the objects created by a specific database user. Those objects may include tables, views, synonyms, and more. Some objects cannot be included in a schema, such as users, contexts, roles, and directory objects.

Users can be granted access to log into individual schemas on a case-by-case basis, and ownership is transferable. Since each object is associated with a particular schema, which serves as a kind of namespace, it’s helpful to give some synonyms, which allows other users to access that object without first referring to the schema it belongs to.
These schemas do not necessarily indicate the ways that the datafiles are stored physically. Instead, schema objects are stored logically within a tablespace. The database administrator can specify how much space to assign to a particular object within a datafile.
Finally, schemas and tablespaces don’t necessarily line up perfectly: objects from one schema can be found in multiple tablespaces, while a tablespace can include objects from several schemas.
Database instance or database schema?
These terms, though related, do not mean the same thing. A database schema is a sketch of a planned database. It doesn’t actually have any data in it.
A database instance, on the other hand, is a snapshot of a database as it existed at a particular time. Thus, database instances can change over time, whereas a database schema is usually static, since it’s difficult to change the structure of a database once it is operational.
Database schemas and database instances can affect one another through a database management system (DBMS). The DBMS makes sure that every database instance complies with the constraints imposed by the database designers in the database schema.
Schema integration requirements
It can be useful to integrate multiple sources into a single schema. Make sure these requirements are met for a seamless transition:
Overlap preservation
Every overlapping element in the schemas you are integrating should be in a database schema table.
Extended overlap preservation
Elements that only appear in one source, but that are associated with overlapping elements, should be copied to the resulting database schema.
Normalization
Independent relationships and entities should not be lumped together in the same table in the database schema.
Minimality
It’s ideal if none of the elements in any of the sources are lost.
Types of database schema
Certain patterns have developed in designing database schema.
The widely used star schema is also the simplest. In it, one or more fact tables are linked to any number of dimensional tables. It’s best for handling simple queries.
The related snowflake schema is also used to represent a multidimensional database. In this pattern, however, dimensions are normalized into lots of separate tables, creating the expansive effect of a snowflake-like structure.