Azure architecture diagram tool
Lucidchart is a visual workspace that combines diagramming, data visualization, and collaboration to accelerate understanding and drive innovation.
Optimize your Azure cloud architecture

Visualize your cloud environment clearly
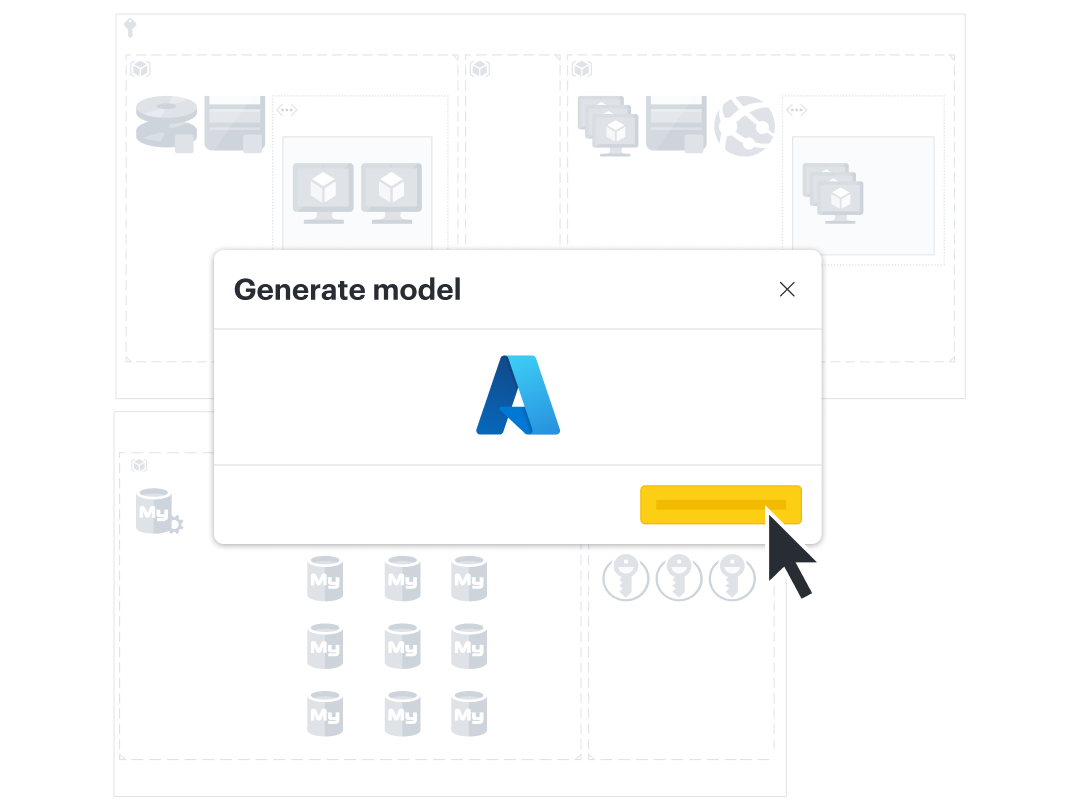
Your cloud likely changes often, making it hard to keep up with documentation. Lucidchart and Lucidscale can help you visualize, support, and share your Azure architecture. To keep track of your architecture, auto-generate models of your current state in Lucidscale. Import Lucidscale models into Lucidchart to plan any updates to your network while illustrating valuable details to stakeholders and teammates.
Build and maintain clear cloud architecture diagrams
Simplify your cloud architecture documentation by using Lucidscale. Lucidscale is our cloud visualization solution that quickly generates and updates cloud models, which can help users troubleshoot network issues, quickly onboard new employees, provide evidence for audits, and speed up security compliance reviews. Import your Lucidscale models of Azure architecture into Lucidchart to add shapes, notes, and personal tags and communicate clearly with key stakeholders and teams. To keep your diagrams updated, simply refresh your data, and our Azure diagram software will reflect your latest infrastructure.

Verify your current cloud architecture
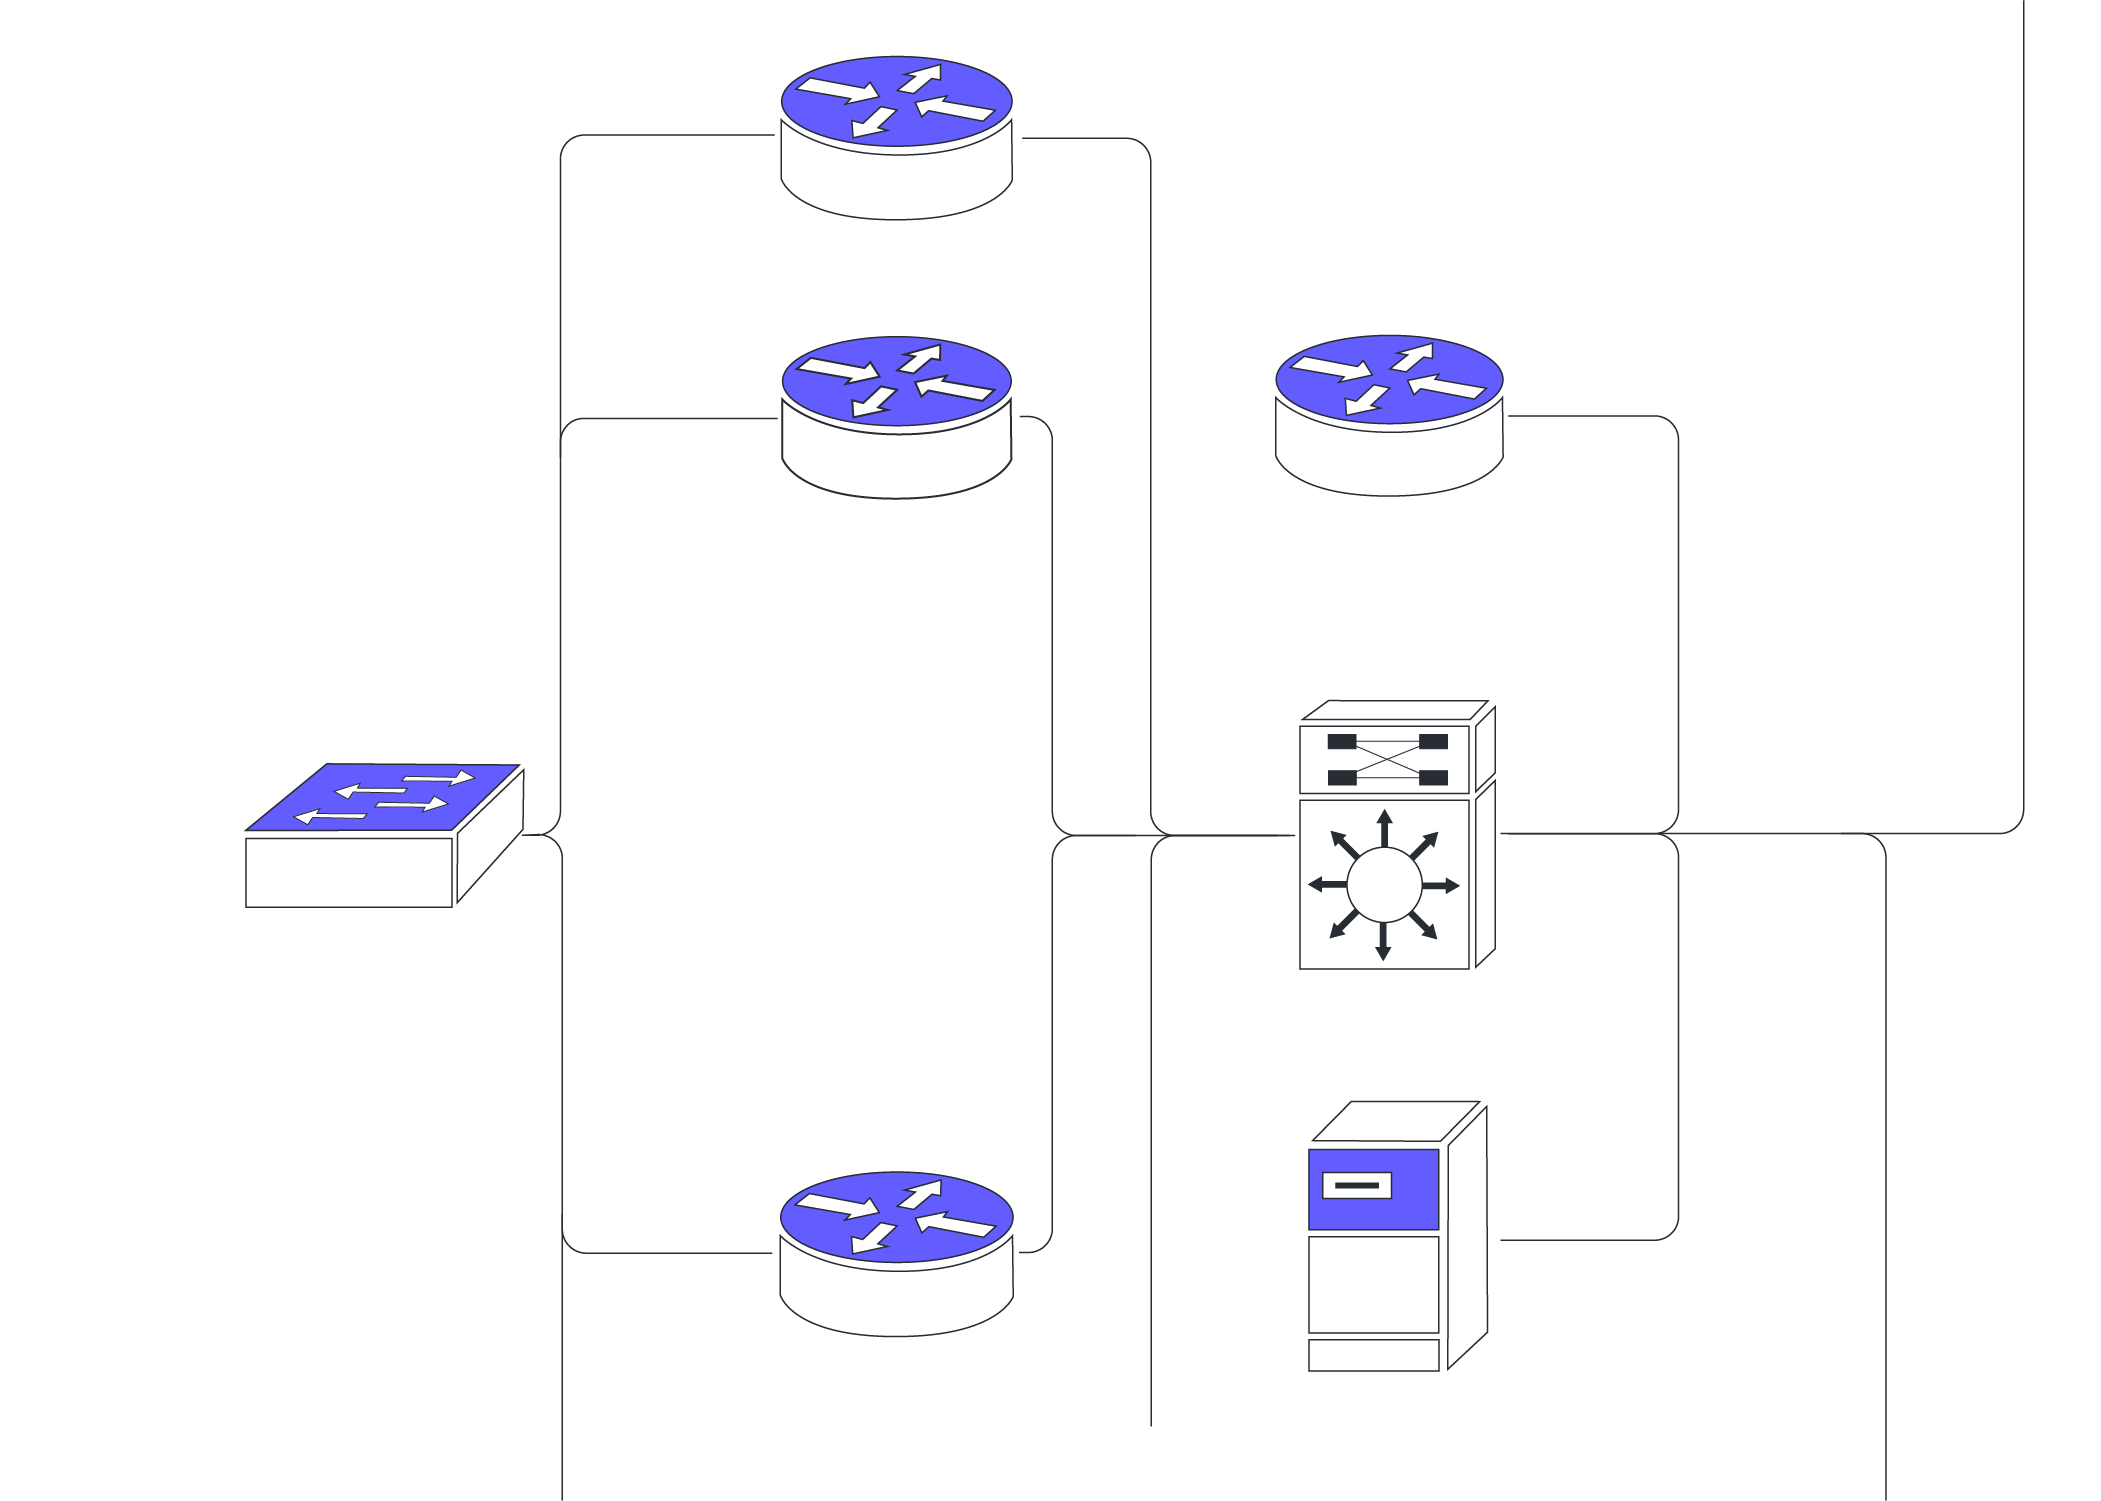
Our Azure architecture diagram software quickly and accurately shows your most important cloud information. That allows you to verify your current infrastructure, apply filters, or highlight important information to share. Lucidscale shows teams critical relationships between components and demonstrates what resources can send and accept traffic. Users can easily refresh data so teams are always viewing the most up-to-date version of your Azure diagrams and cloud environments. Compare your Lucidscale cloud models to your Lucidchart development plans to verify that deployment was done correctly.
FAQ about our Azure architecture diagram solution
How do you connect to my Azure account?
Can I filter down my diagram to only see certain parts of my infrastructure?
Can I keep these diagrams up to date with changes in my cloud environment?
Get started with Lucidchart Cloud Insights
Used by millions across the globe
“Lucidchart charting was the missing SaaS tool needed to complete any IT professional’s SaaS toolset.”

4.5/5 stars 650+ reviews


