How to create a fishbone diagram in Word with a template from the Lucidchart add-in
1. Set up a Lucidchart account
Before getting started, you’ll need to register for a free Lucidchart account. Sign-up is quick and easy—all you need is an email address!
2. Choose a template
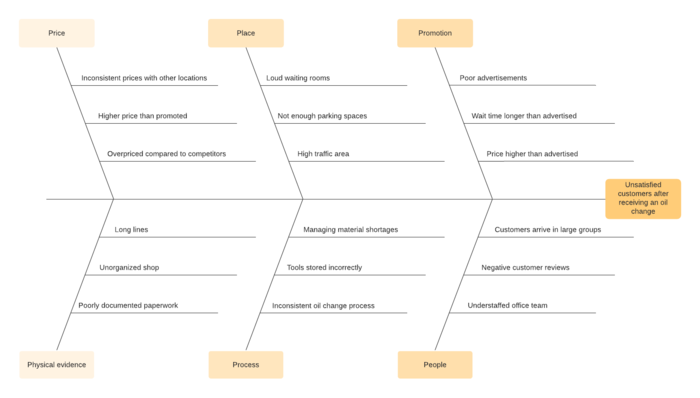
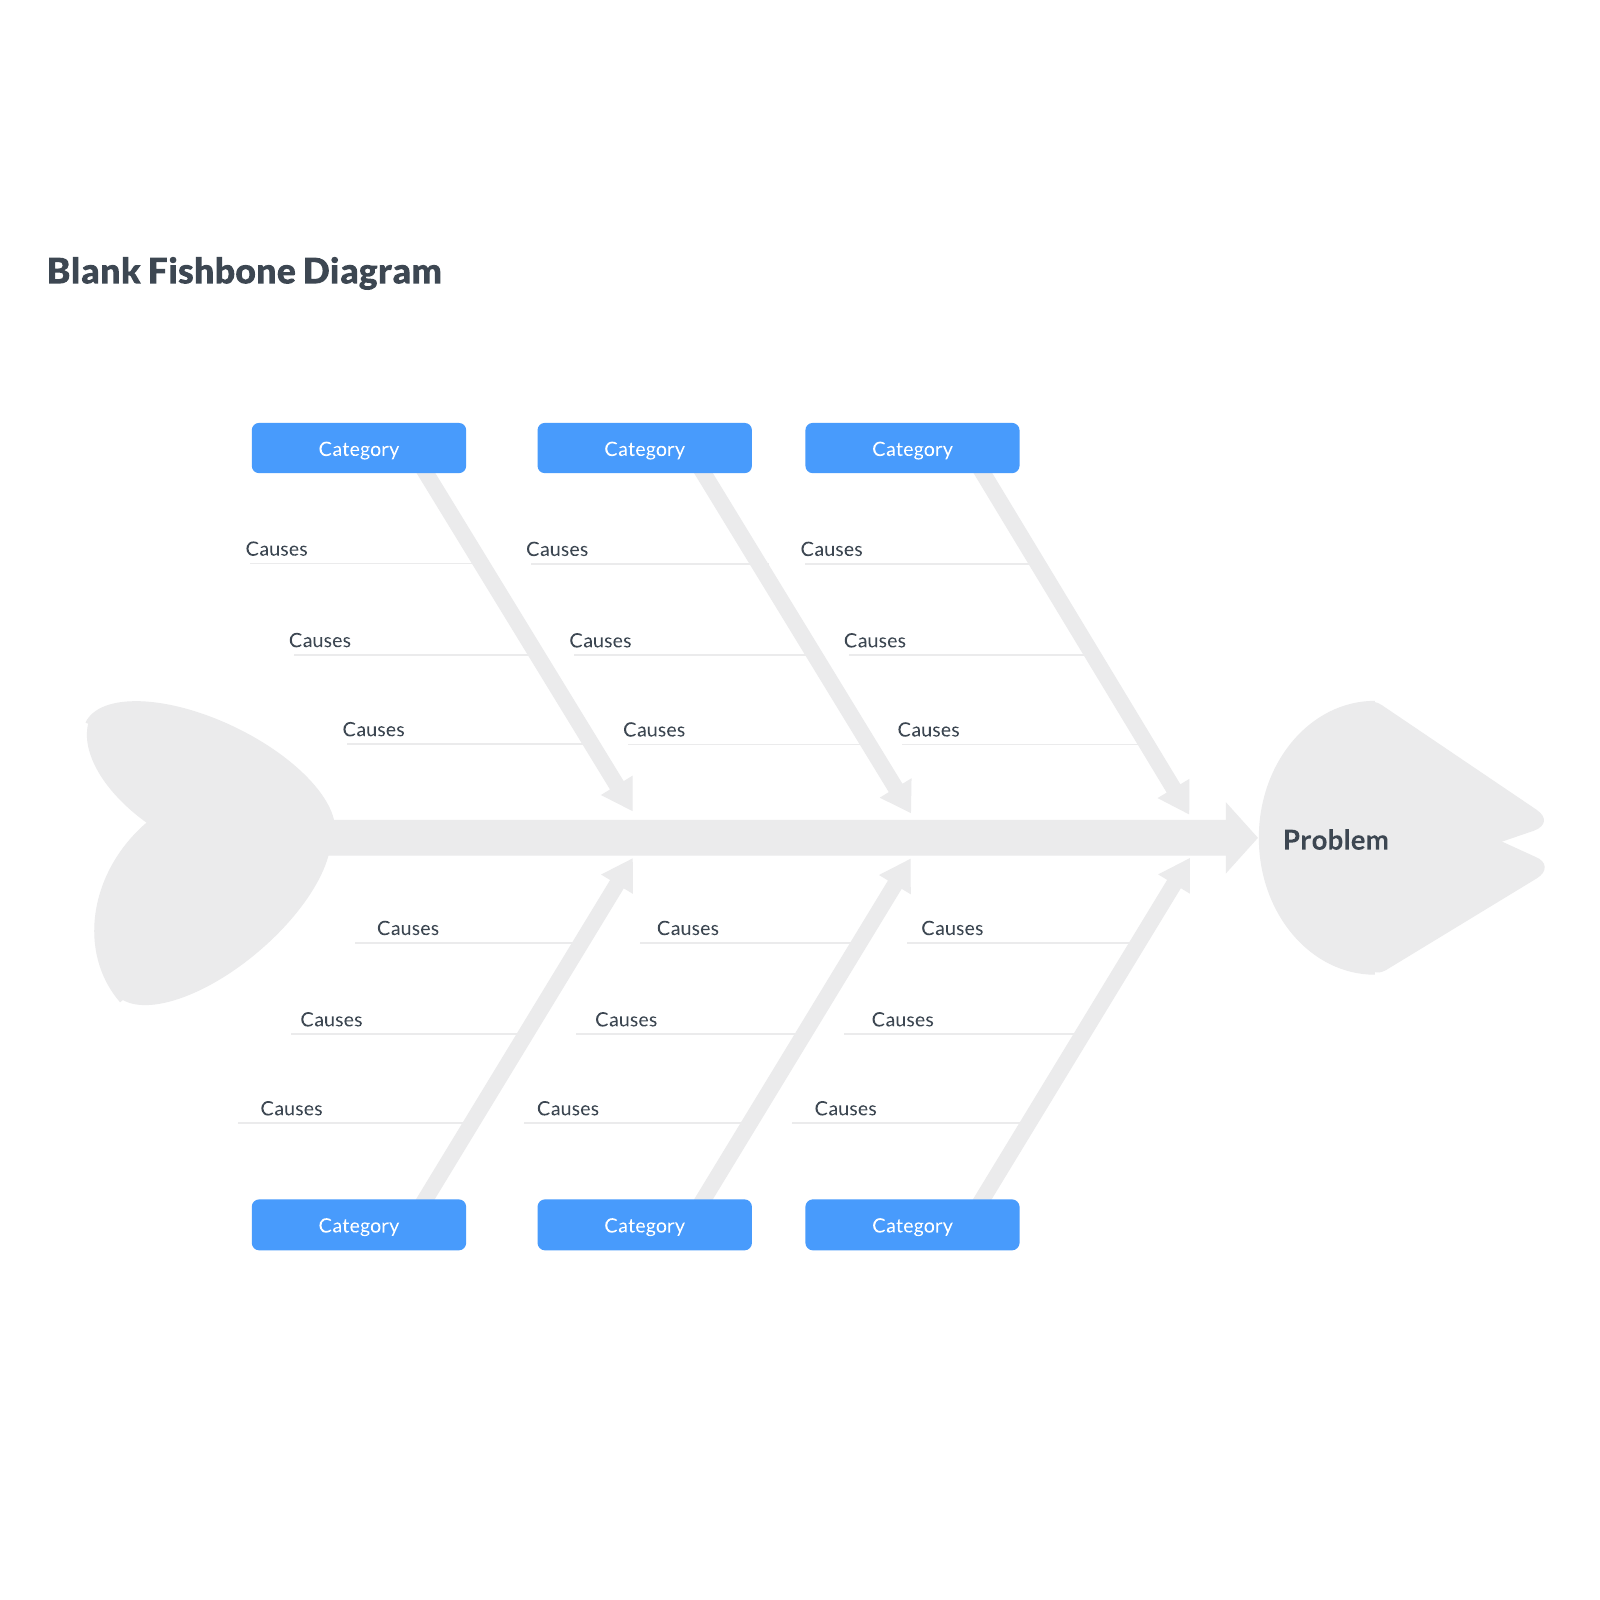
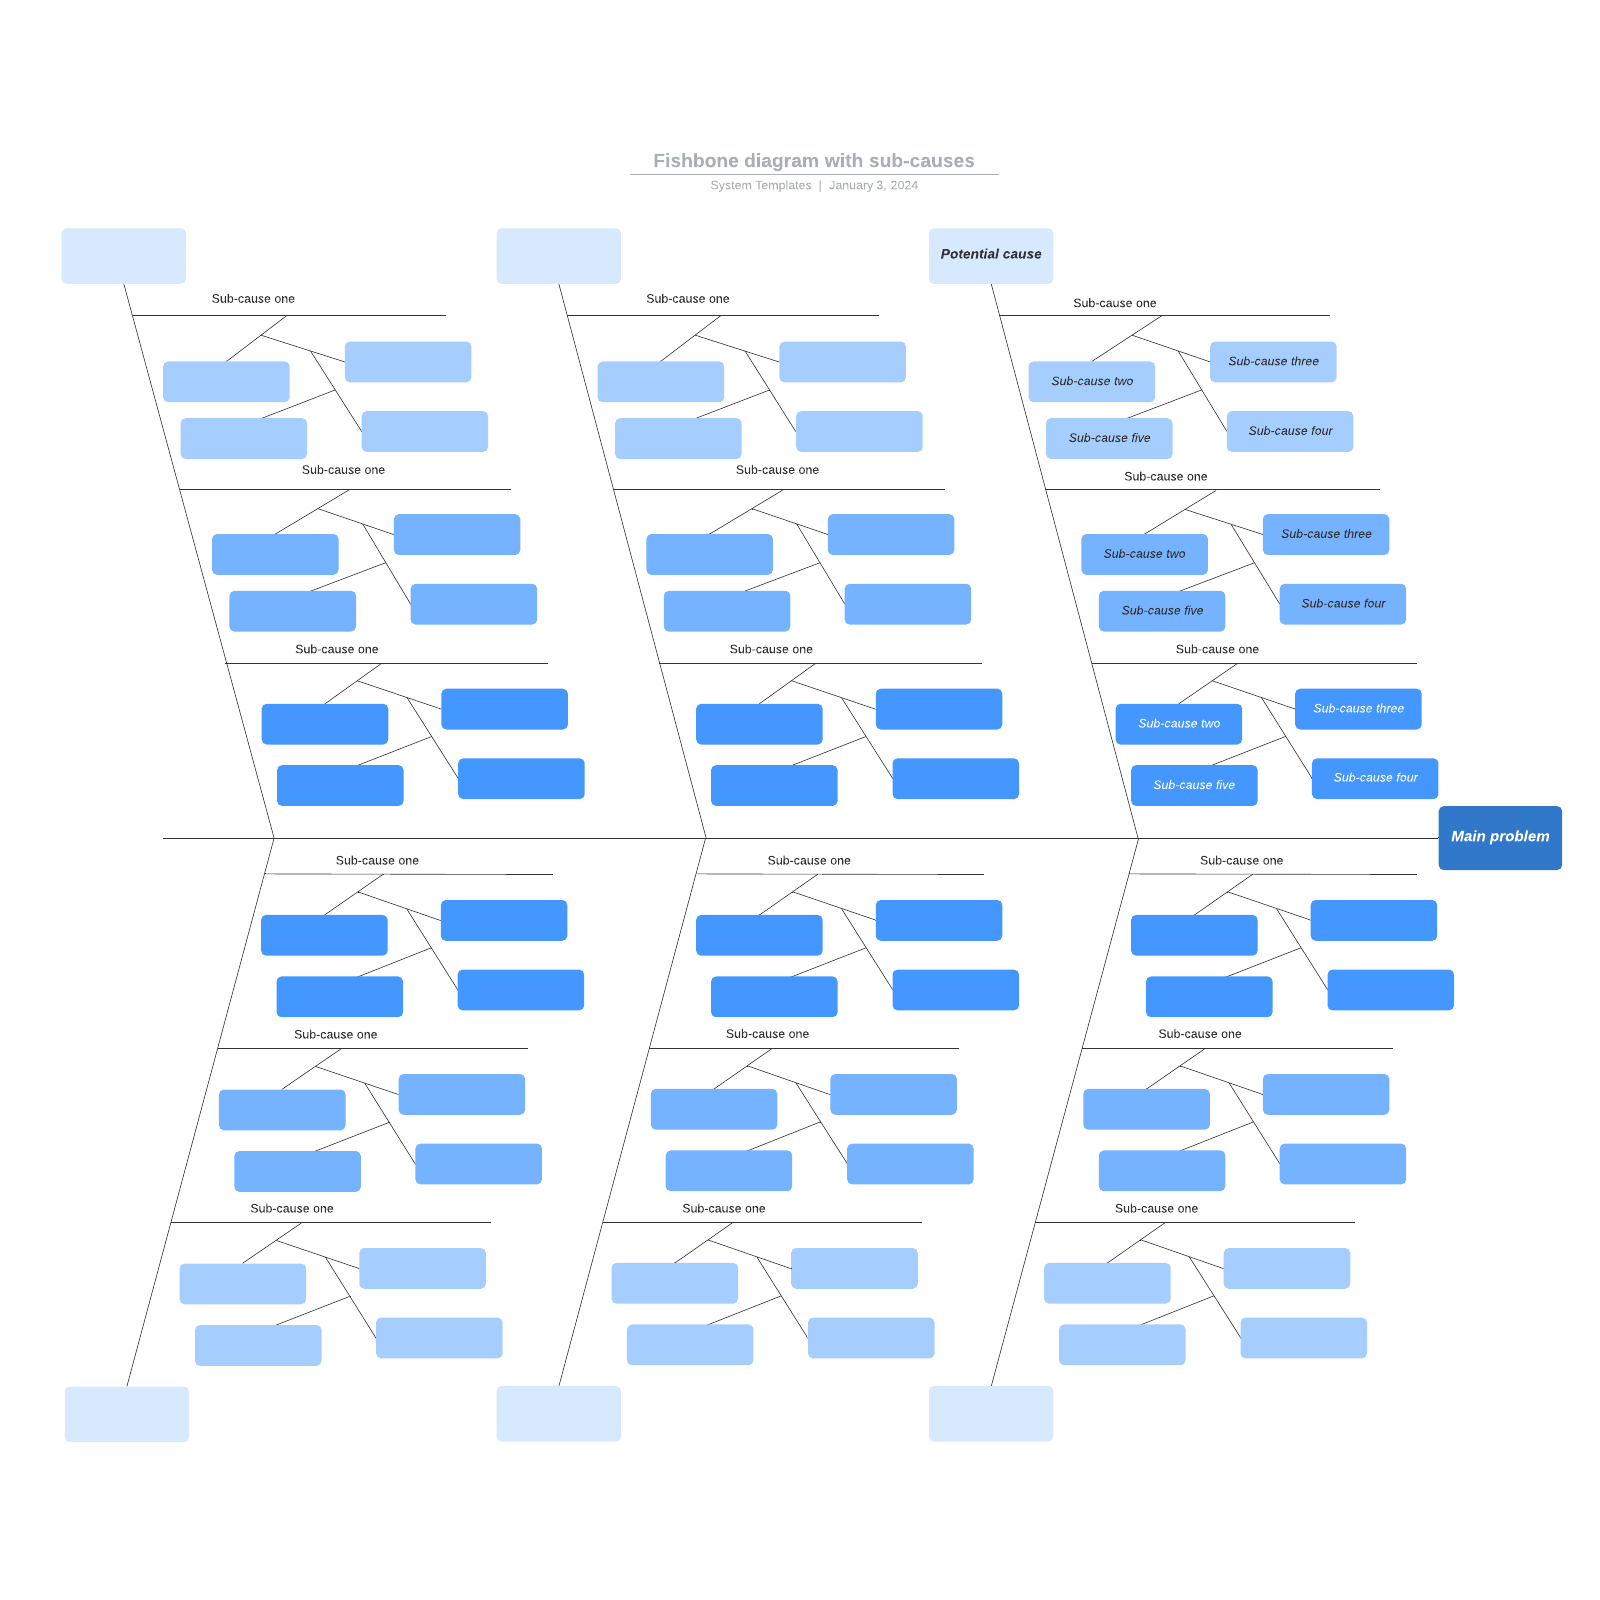
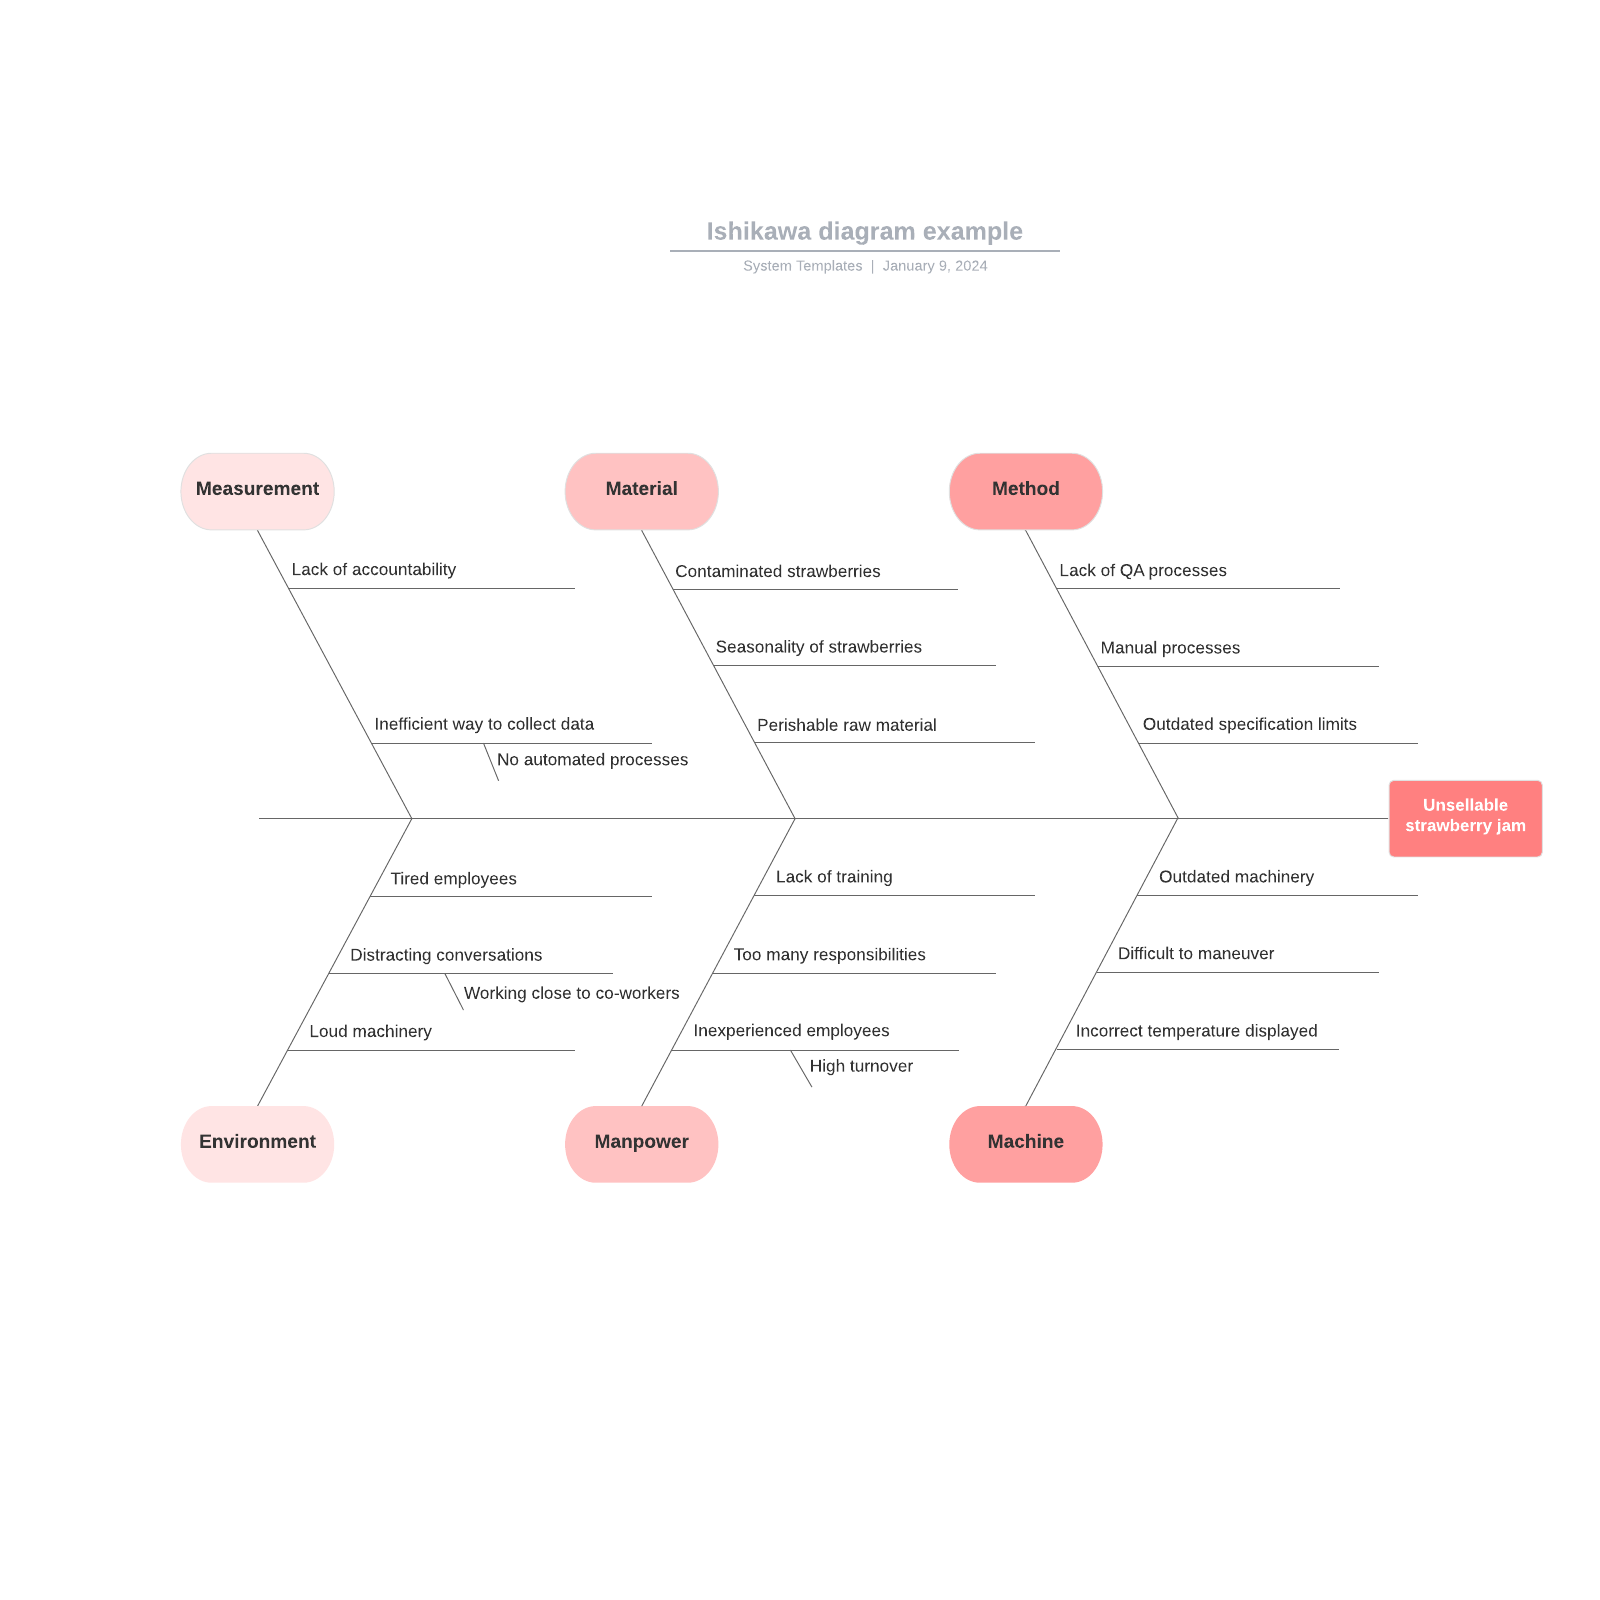
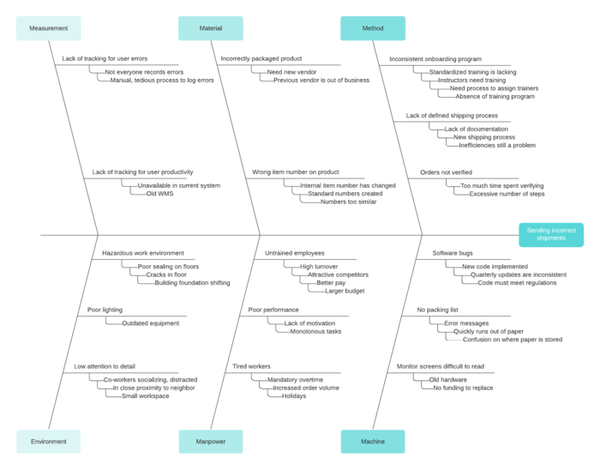
Lucidchart has several fishbone diagram templates, covering various levels of complexity. Click the arrow next to “+Document” to open Lucidchart’s template library. To read about a template, simply click on it once—this will give you a closer look at the template and recommended uses. When you’ve found a template that suits your needs, select it and click “Create Document.” (To use the template below, click on the image.)

3. Get editing
These templates are great starting points, but chances are, you’ll want to customize your fishbone diagram. With Lucidchart’s intuitive interface, editing your diagram is quick and hassle-free.
4. Download the Lucidchart add-in for Microsoft Word
To install the Lucidchart add-in, open Microsoft Word and go to Insert > My Add-ins. Search for Lucidchart and click “Install.” It’s that easy!
5. Choose which diagram to insert into your document
In your MS Word document, go to the insert tab. The Lucidchart add-in can be found on the far-right side of the insert ribbon—click on it. This opens the Lucidchart add-in pane on the right-hand side of your window. Select the diagram you want to insert from the list of documents, and click “Insert.”
If you ever want to update your diagrams, you can select the diagram you wish to update and click the "Edit" button. This allows you to hop right into the Lucidchart editor to update your fishbone diagram. Then, when you're finished, re-open your Lucidchart add-in, and your updated diagram will display as an option to insert into your Word document.
Still need help importing your diagrams? Watch our video demonstration here.
Master the basics of Lucidchart in 3 minutes
- Create your first diagram from a template or blank canvas or import a document.
- Add text, shapes, and lines to customize your diagram.
- Learn how to adjust styling and formatting.
- Locate what you need with Feature Find.
- Share your diagram with your team to start collaborating.
How to make a fishbone diagram in Word
If you’ve tried to create diagrams in Microsoft Word, you know that diagramming is not one of its strong points. It is, after all, a word processor—great for creating text documents, not so great for creating visuals. Although Word can be used to make simple fishbone diagrams, there aren’t any in-app templates—you’ll have to start from scratch. In this tutorial, we’ve broken down the whole process for you.
1. Locate the Shapes drop-down box
In your Word document, go to Insert > Shapes—everything needed for your fishbone diagram will be found there.
2. Create the “head” and “spine” of your diagram
For your first shape, choose a line with an arrow and draw it in the center of your document. Draw from left to right (the arrow should point towards the right-hand side of the page). Add a rectangle adjoining this line and label it with the central problem statement. To add text to your rectangle, simply select it and begin typing.

3. Add additional lines
Add lines without arrows jutting out from the central line. These extend from the central line at an angle, like ribs. Each of these lines represents a category of factors that contribute to the central problem. It may be helpful to label these lines with their respective categories—add rectangles or bubbles with text at the tip of each line.
Next, add additional lines extending horizontally from each category line. Each of these new lines will eventually be labeled with a potential cause of the central problem.

4. Customize your diagram
At this point, your diagram is styled according to Microsoft presets. If you’re satisfied with the diagram’s look, go ahead and skip this step.
To edit a shape’s color, line weight, etc., select one of the shapes or lines in your diagram. Open the format pane, found on the right-hand side of the shape format bar. (To open the format pane quickly, just double-click one of your shapes.)
From the format pane, you can change nearly every aesthetic aspect of your diagram. Try different stylings out until you are satisfied with the look of your fishbone diagram. (Tip: To edit multiple shapes or lines simultaneously, hold Shift as you select them.)
5. Add content or save as a template
Now your diagram is both built and styled, but it has no content. If you want to use this fishbone diagram as a template, simply save your document as is—your fishbone template is complete.
To finish your fishbone diagram, fill in the text. If you haven’t written a problem statement in the central box, add one now. Next, add text boxes above each of the horizontal lines. Go to Insert > Text > Text Box. These labels should represent contributing factors to the central problem. Once your diagram is all filled in, you’re ready to save your document.
While it is possible to make simple diagrams using MS Word, here’s the bottom line: Word wasn’t designed for creating visuals. Diagramming with the shapes library is a pain. With the Lucidchart add-in, you’ll skip the headache, no matter the complexity or size of your diagram. And this doesn’t apply only to fishbone diagrams—whether you need a flowchart or a timeline, you can add beautiful visuals to your MS Word documents with Lucidchart.