Diagramming powered by intelligence
Create next-generation diagrams with AI, data, and automation in Lucidchart. Understand and optimize every system and process.


By registering, you agree to our Terms of Service and you acknowledge that you have read and understand our Privacy Policy.


Flowcharts for every use case

Product and UX
Research and design teams use Lucidchart for:
- User journey flows
- Product roadmapping
- Current vs. future state
Integrates with:


Engineering
Development teams use Lucidchart for:
- Algorithm flowcharts
- Programming flowcharts
- Data mapping
Integrates with:


IT
IT and DevOps teams use Lucidchart for:
- Work order processes
- IT audit flowcharts
- API flowcharts
Integrates with:


Project management
Logistical teams use Lucidchart for:
- Workflow diagrams
- Project timelines
- Task dependencies
Integrates with:


General and admin
Ops, HR, finance, and exec teams use Lucidchart for:
- BPMN diagrams
- Process optimization
- Value stream mapping
Integrates with:


Go-to-market
Revenue teams use Lucidchart for:
- Sales processes
- Marketing workflows
- Strategy mapping
Integrates with:


Why teams choose Lucidchart
Most intelligent
Use Lucid AI to generate and refine diagrams, add conditional formatting, summarize content, and more. Link data sets to visuals and make complex data clear.
Discover Lucid AI
Most connected
Integrate Lucidchart with apps from top providers such as Google, Microsoft, Slack, and more. Leverage bidirectional syncs to ensure all systems are up to date.
Browse integrations
Most complete
Upgrade to an Enterprise plan for a complete visual collaboration solution. Combine Lucidchart for intelligent diagramming with Lucidspark for virtual whiteboarding.
Explore enterprise
Most value
Get started faster with over 1,500 customizable templates. Leverage our dedicated support team, and engage professional services for tailored solutions.
Browse templates
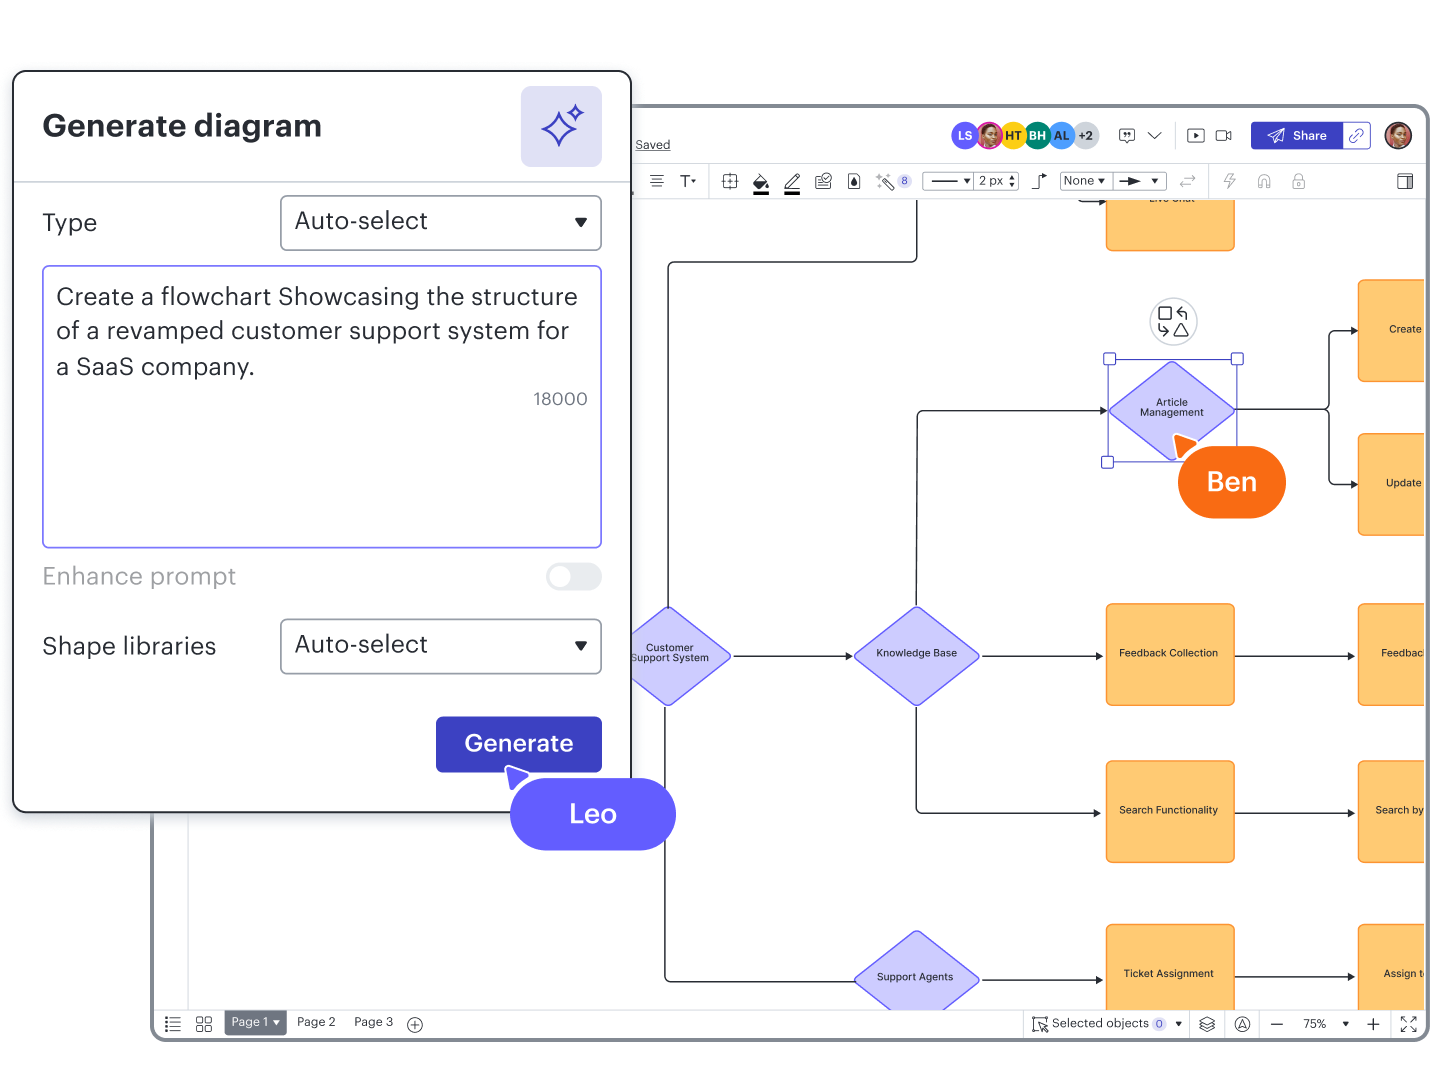
Lucid AI
Type text prompts to generate content automatically on your Lucidchart canvas, or ask questions to get started with AI.

Data linking
Link to Google Sheets, Excel, or CSV files to create visualizations automatically from a data source.

Conditional formatting
Transform data by visually highlighting patterns and insights for quick comprehension at a glance.

UML markup
Auto-generate a sequence diagram from text, then edit the markup or style your diagram as desired.

Layers
Add layers to your visualizations for multiple levels, distinct visibility controls, and hierarchy management.