Visualize and optimize your network
See how Lucidchart can help you build, optimize, and maintain your infrastructure.

Visualize your network infrastructure
In Lucidchart, you can easily visualize the current state of your network and plan out your future state. With our Visio stencil import and extensive shape libraries, including Cisco network and server rack shapes, you can create detailed visuals to design and document your network setup.
Contact Sales
Improve troubleshooting processes
If your network is down, your organization can’t accomplish its goal. Visualize your physical network to understand where the source of the problem may lie and to start identifying potential solutions. Diagrams help display Wi-Fi coverage mapping, the location of phones, computers, and other devices, a layout of the server rack, etc.
Contact Sales
Keep your organization secure and compliant
Build diagrams to ensure that you have set up your network to meet PCI, ISO, SOC 2, GDPR, and other security standards and then share these visuals with other stakeholders to demonstrate compliance.
Contact Sales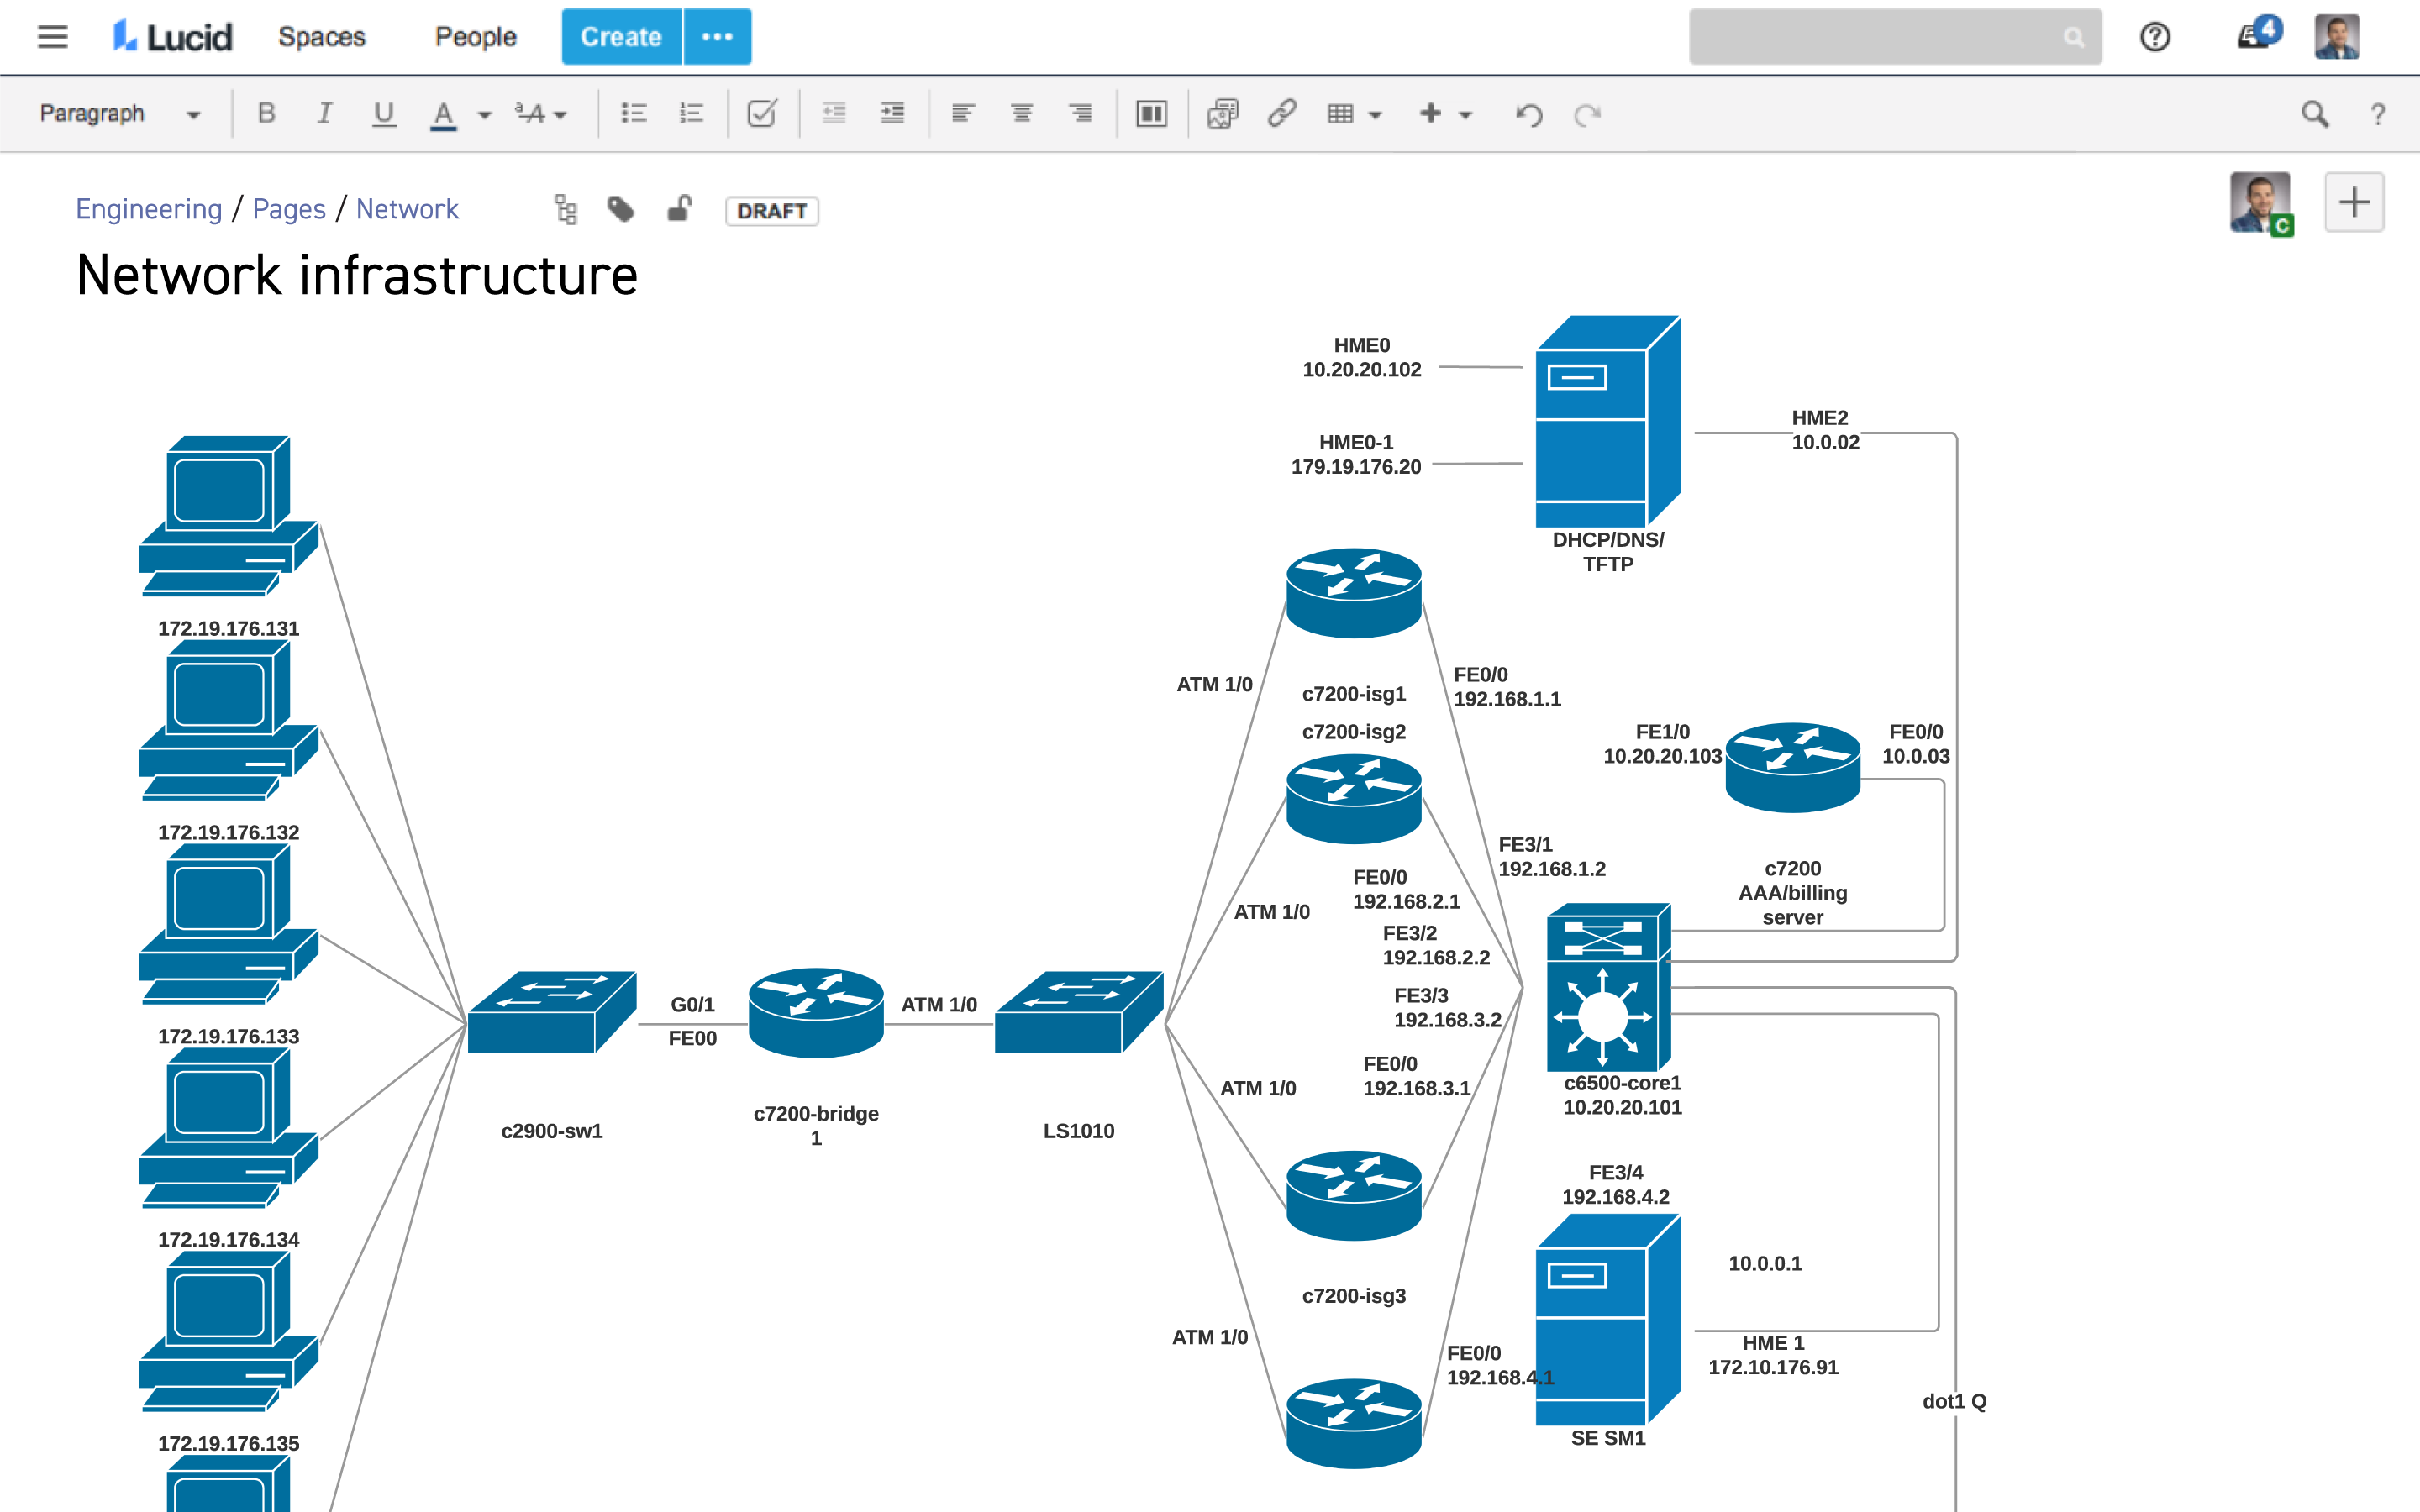
Create a central repository for documentation
As you train new hires or help employees transition teams, using visuals makes it easier for them to understand your network and systems. Build physical and logical network diagrams in Lucidchart to help create clarity faster.
Contact SalesVisio replacement
Microsoft may have developed a web-based Visio platform, but Visio Online still can't beat the collaboration and constant innovation offered through Lucidchart.
Learn moreHow to Visualize Your AWS Architecture with Lucidchart
Join Collin Mangum and Jerry Hargrove to learn how Jerry uses Lucidchart to design AWS architectures and communicate ideas with clarity. Space is limited, so reserve your seat today!
Learn moreGroupon Case Study
When Groupon acquired Breadcrumb in 2012, they promised that every customer would receive 5-star support. Lucidchart helped Groupon honor that promise by allowing the support team to access network diagrams of the customer's setup.
Learn moreI use Lucidchart to create network diagram to discover, design, and document the setup of each office for faster planning and support. The integration with Confluence makes it easy to embed network diagrams into the applicable wiki for each office.