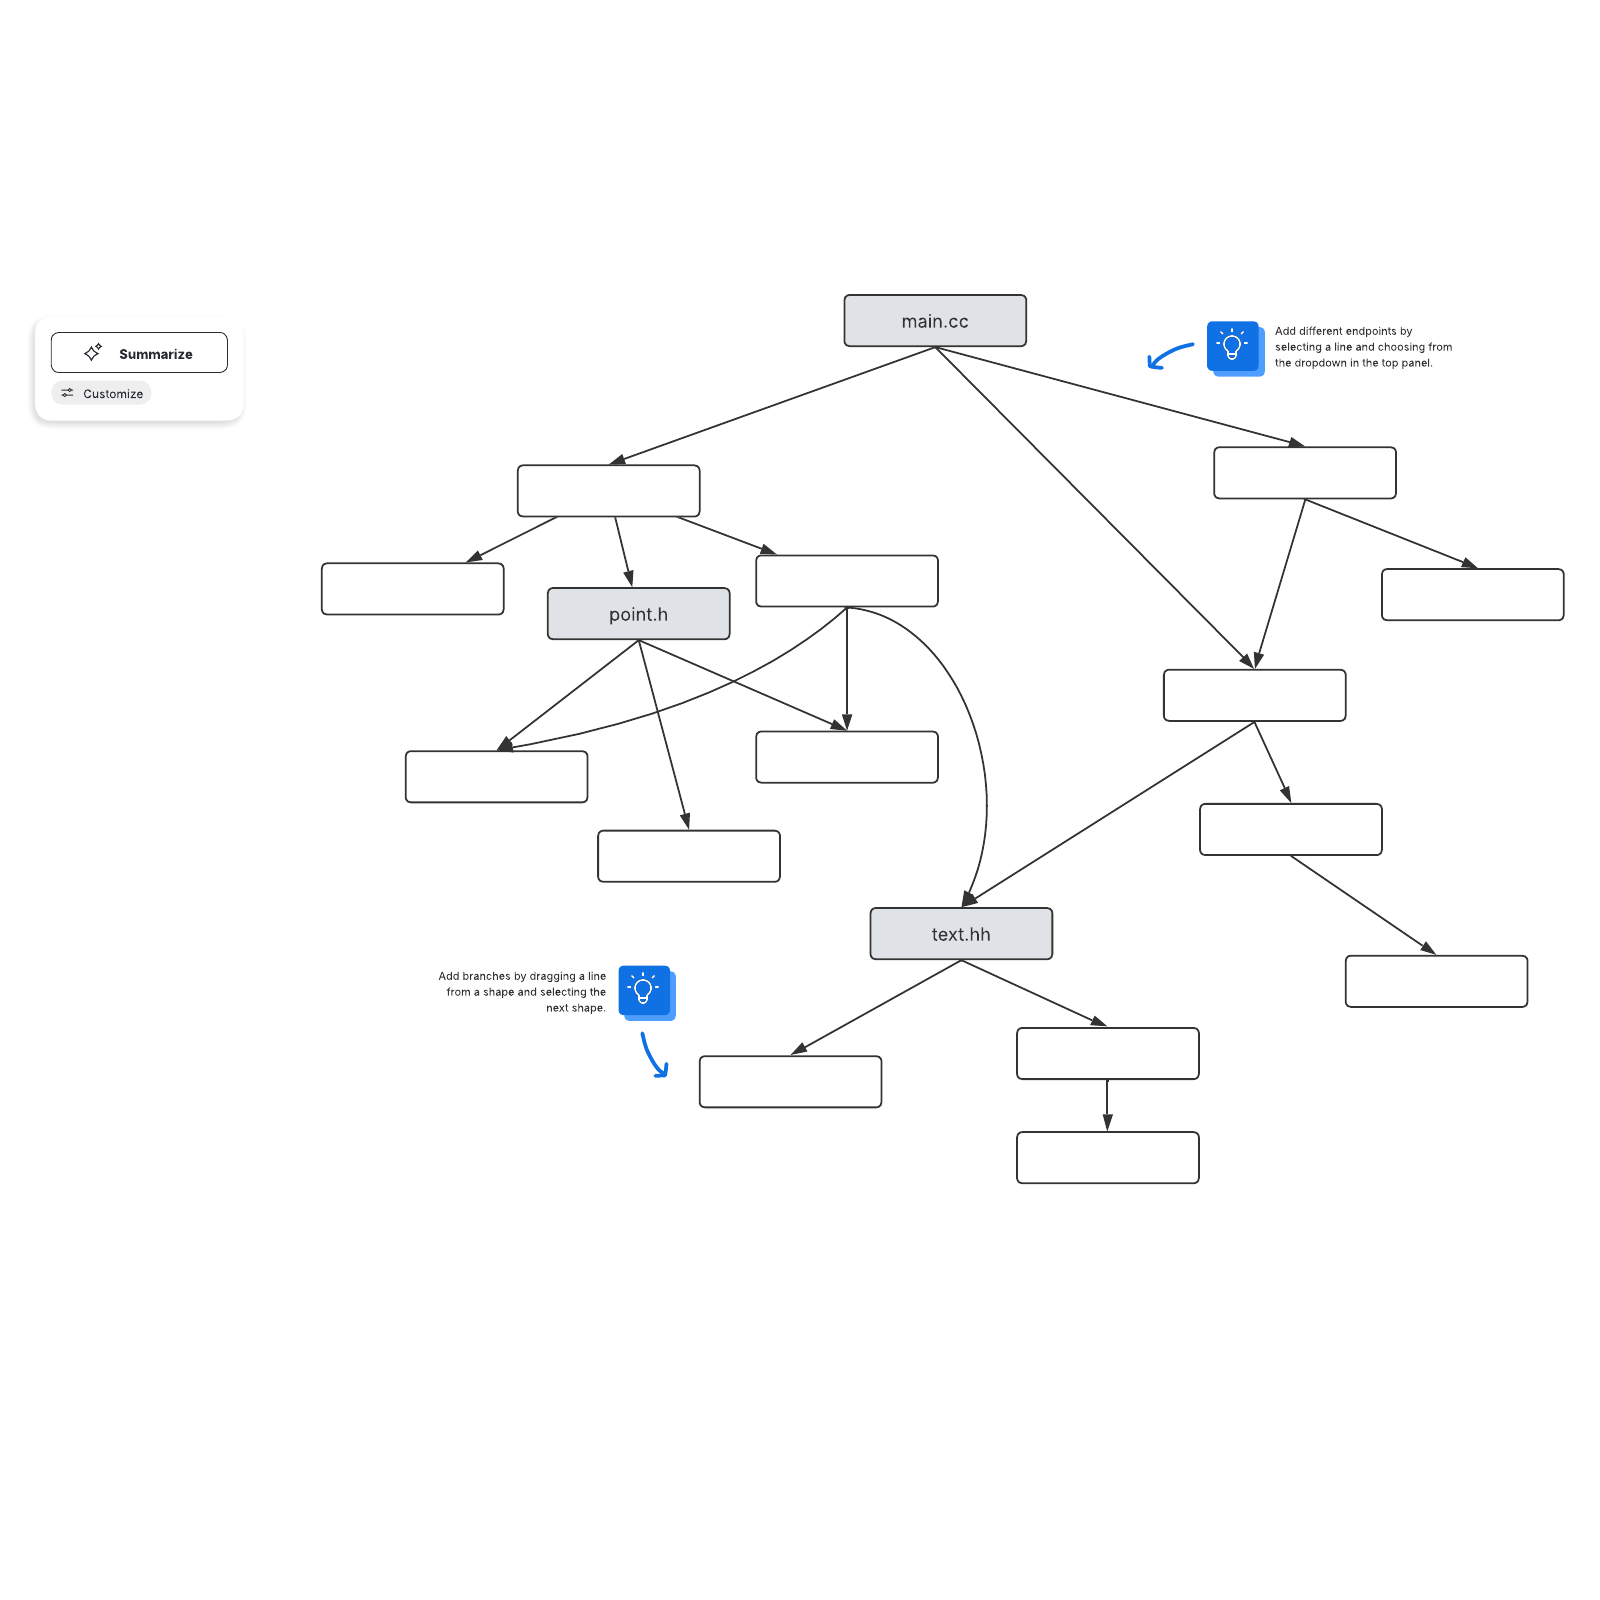
Dependency graph
This dependency graph template can help you:
- Visualize dependencies of different objects.
- Collaborate with colleagues.
Open this template to view a dependency graph that you can customize to your use case.
Examine your process in context with our Dependency graph template
When you are working with complex processes, it can be difficult to keep track of all the moving parts. Fortunately, you can simplify the complex with the help of a dependency graph, which will help you create a visual representation of what tasks or functions depend on others. Whether you need to map out the steps of your customer service process, figure out what must be done to improve a specific product, or determine the best order of tasks for a project, a dependency graph can be a useful tool. When you lay out the steps for a process with a dependency graph, you’re able to quickly identify any problems or bottlenecks that are complicating your process, as well as better align team members who are working on a given process.Use the Dependency graph template in Lucidchart
Lucidchart offers a convenient Dependency graph template that will allow you to collaborate with team members easily, no matter when or where they are working. To use the template:- Arrange the shapes and lines as you would like. To format shapes, click on a shape and then click “Shape Options” to select the fill or line colors. Hover over a shape and click on any red circle to add lines. Use the properties bar at the top of the canvas to format the lines.
- Add text to the graph to label different objects and define their relationships. Add text to a shape by double-clicking it and then typing. Add text to a line by double-clicking anywhere on the line and typing.
- To import data from another source to use in your template, click on “Import Data” on the bottom left. To learn more about customizing your graph to your specifications, click the tutorial button to the right of the document. As you and your team complete the graph, you’ll better understand the process you are engaged in and know how to perfect it. You’ll also create a convenient reference that can easily be kept updated as you further refine your process.


