
How Lucidites Use Lucidchart: Diagrams for Engineering
Lucid Content
Reading time: about 4 min
Many software engineers use diagrams to architect new applications and systems and to prepare documentation for troubleshooting and training. Our engineers at Lucid Software are no different. They diagram as they work hard to make diagramming in Lucidchart easier for you.
Check out how our engineers have applied Lucidchart in various aspects of their jobs—and get inspired to think visually in your own work.
Designing new features
As part of a major feature release, the product and engineering teams needed to determine how our products would interact with our billing system and other entities. Jared Yarn put together a swimlane diagram to show the entire workflow.

Use a similar process map template
When designing a new feature, sequence diagrams can help engineers document how different components in their systems will interact and in what order. Owen Krafft made the following sequence diagram to show what happens as a user configures the Lucidchart add-on for Confluence.

With UML sequence markup in Lucidchart, you can generate a professional sequence diagram like this one in no time.
When Chloe Sumsion and Joe Slinker wanted to add the ability to request a license to the Lucidchart iOS app, they realized that the workflow gets pretty complex. So they mapped it out in Lucidchart, even uploading screenshots of actions in the app. Chloe and Joe then passed that diagram over to our growth team to ensure this new feature resembled the current license request process on our web browser.
Lucidchart helped these teams avoid any miscommunication. With every detail of the process mapped out in front of them, they could visualize exactly how the user workflow should function.
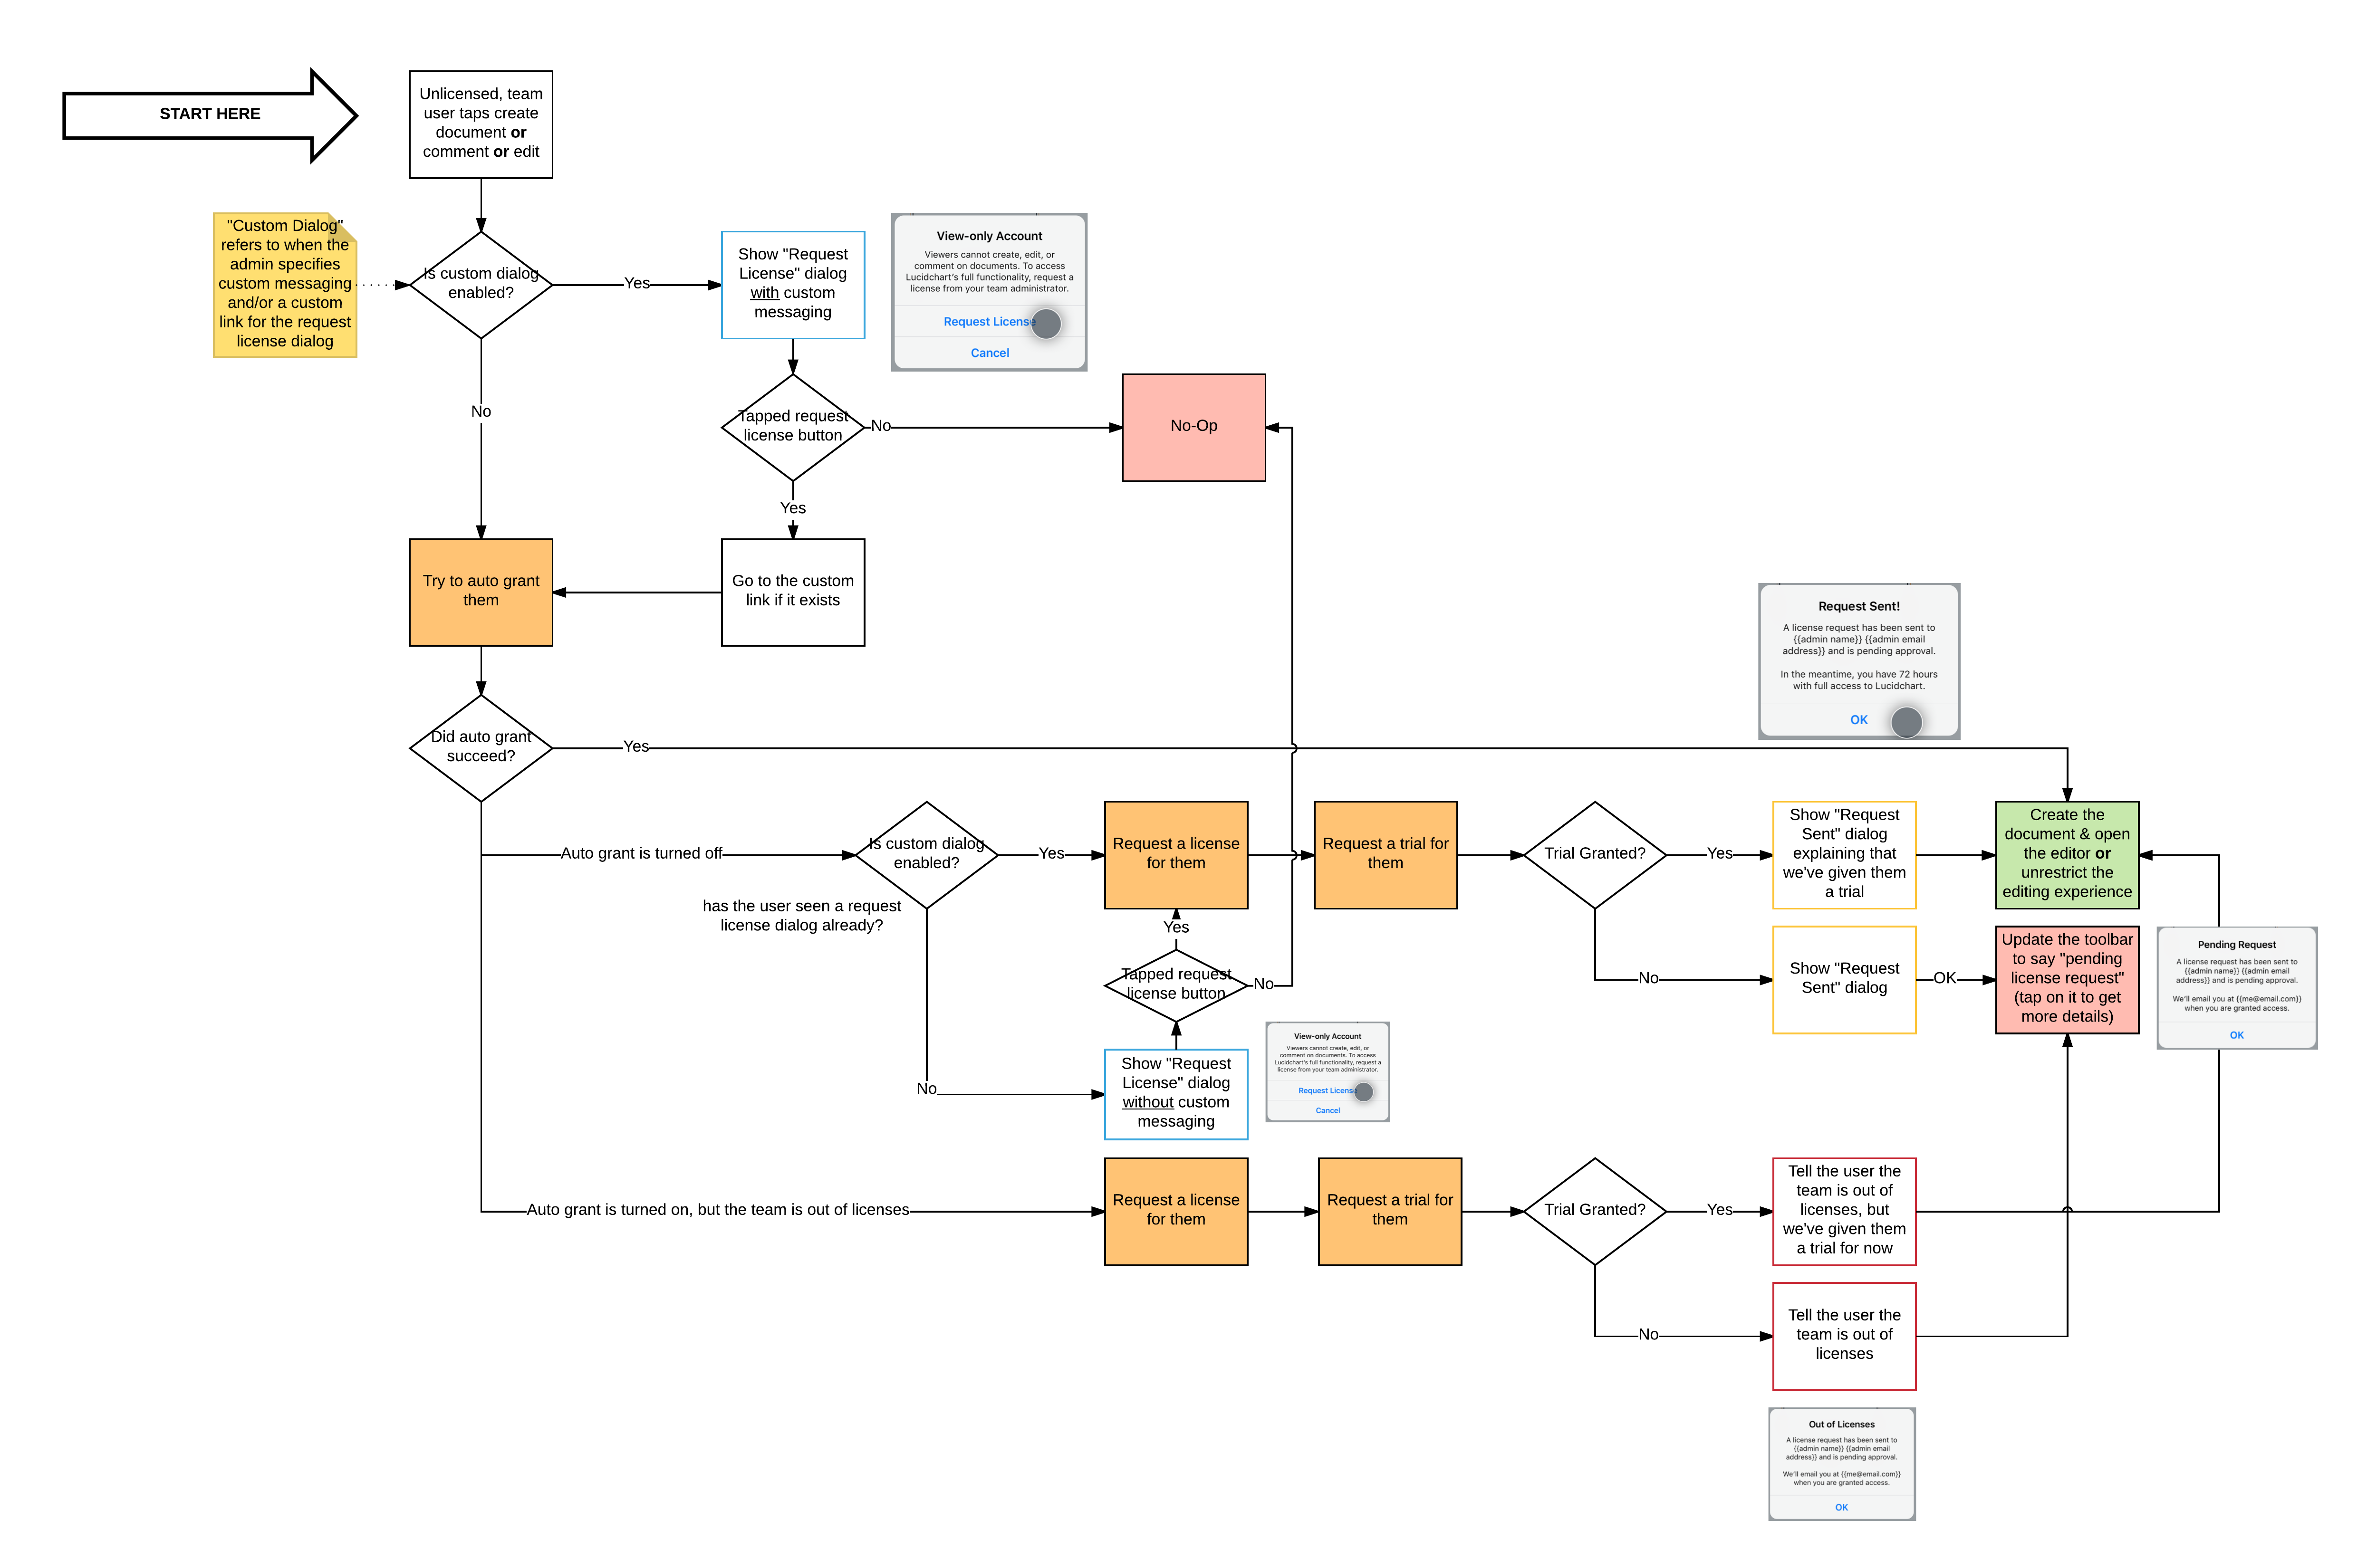
Chloe also created a modified sequence diagram to show what occurs in the system between two different parts of code. Between the two diagrams, the mobile team could better understand what the user sees and how the system actually operates.
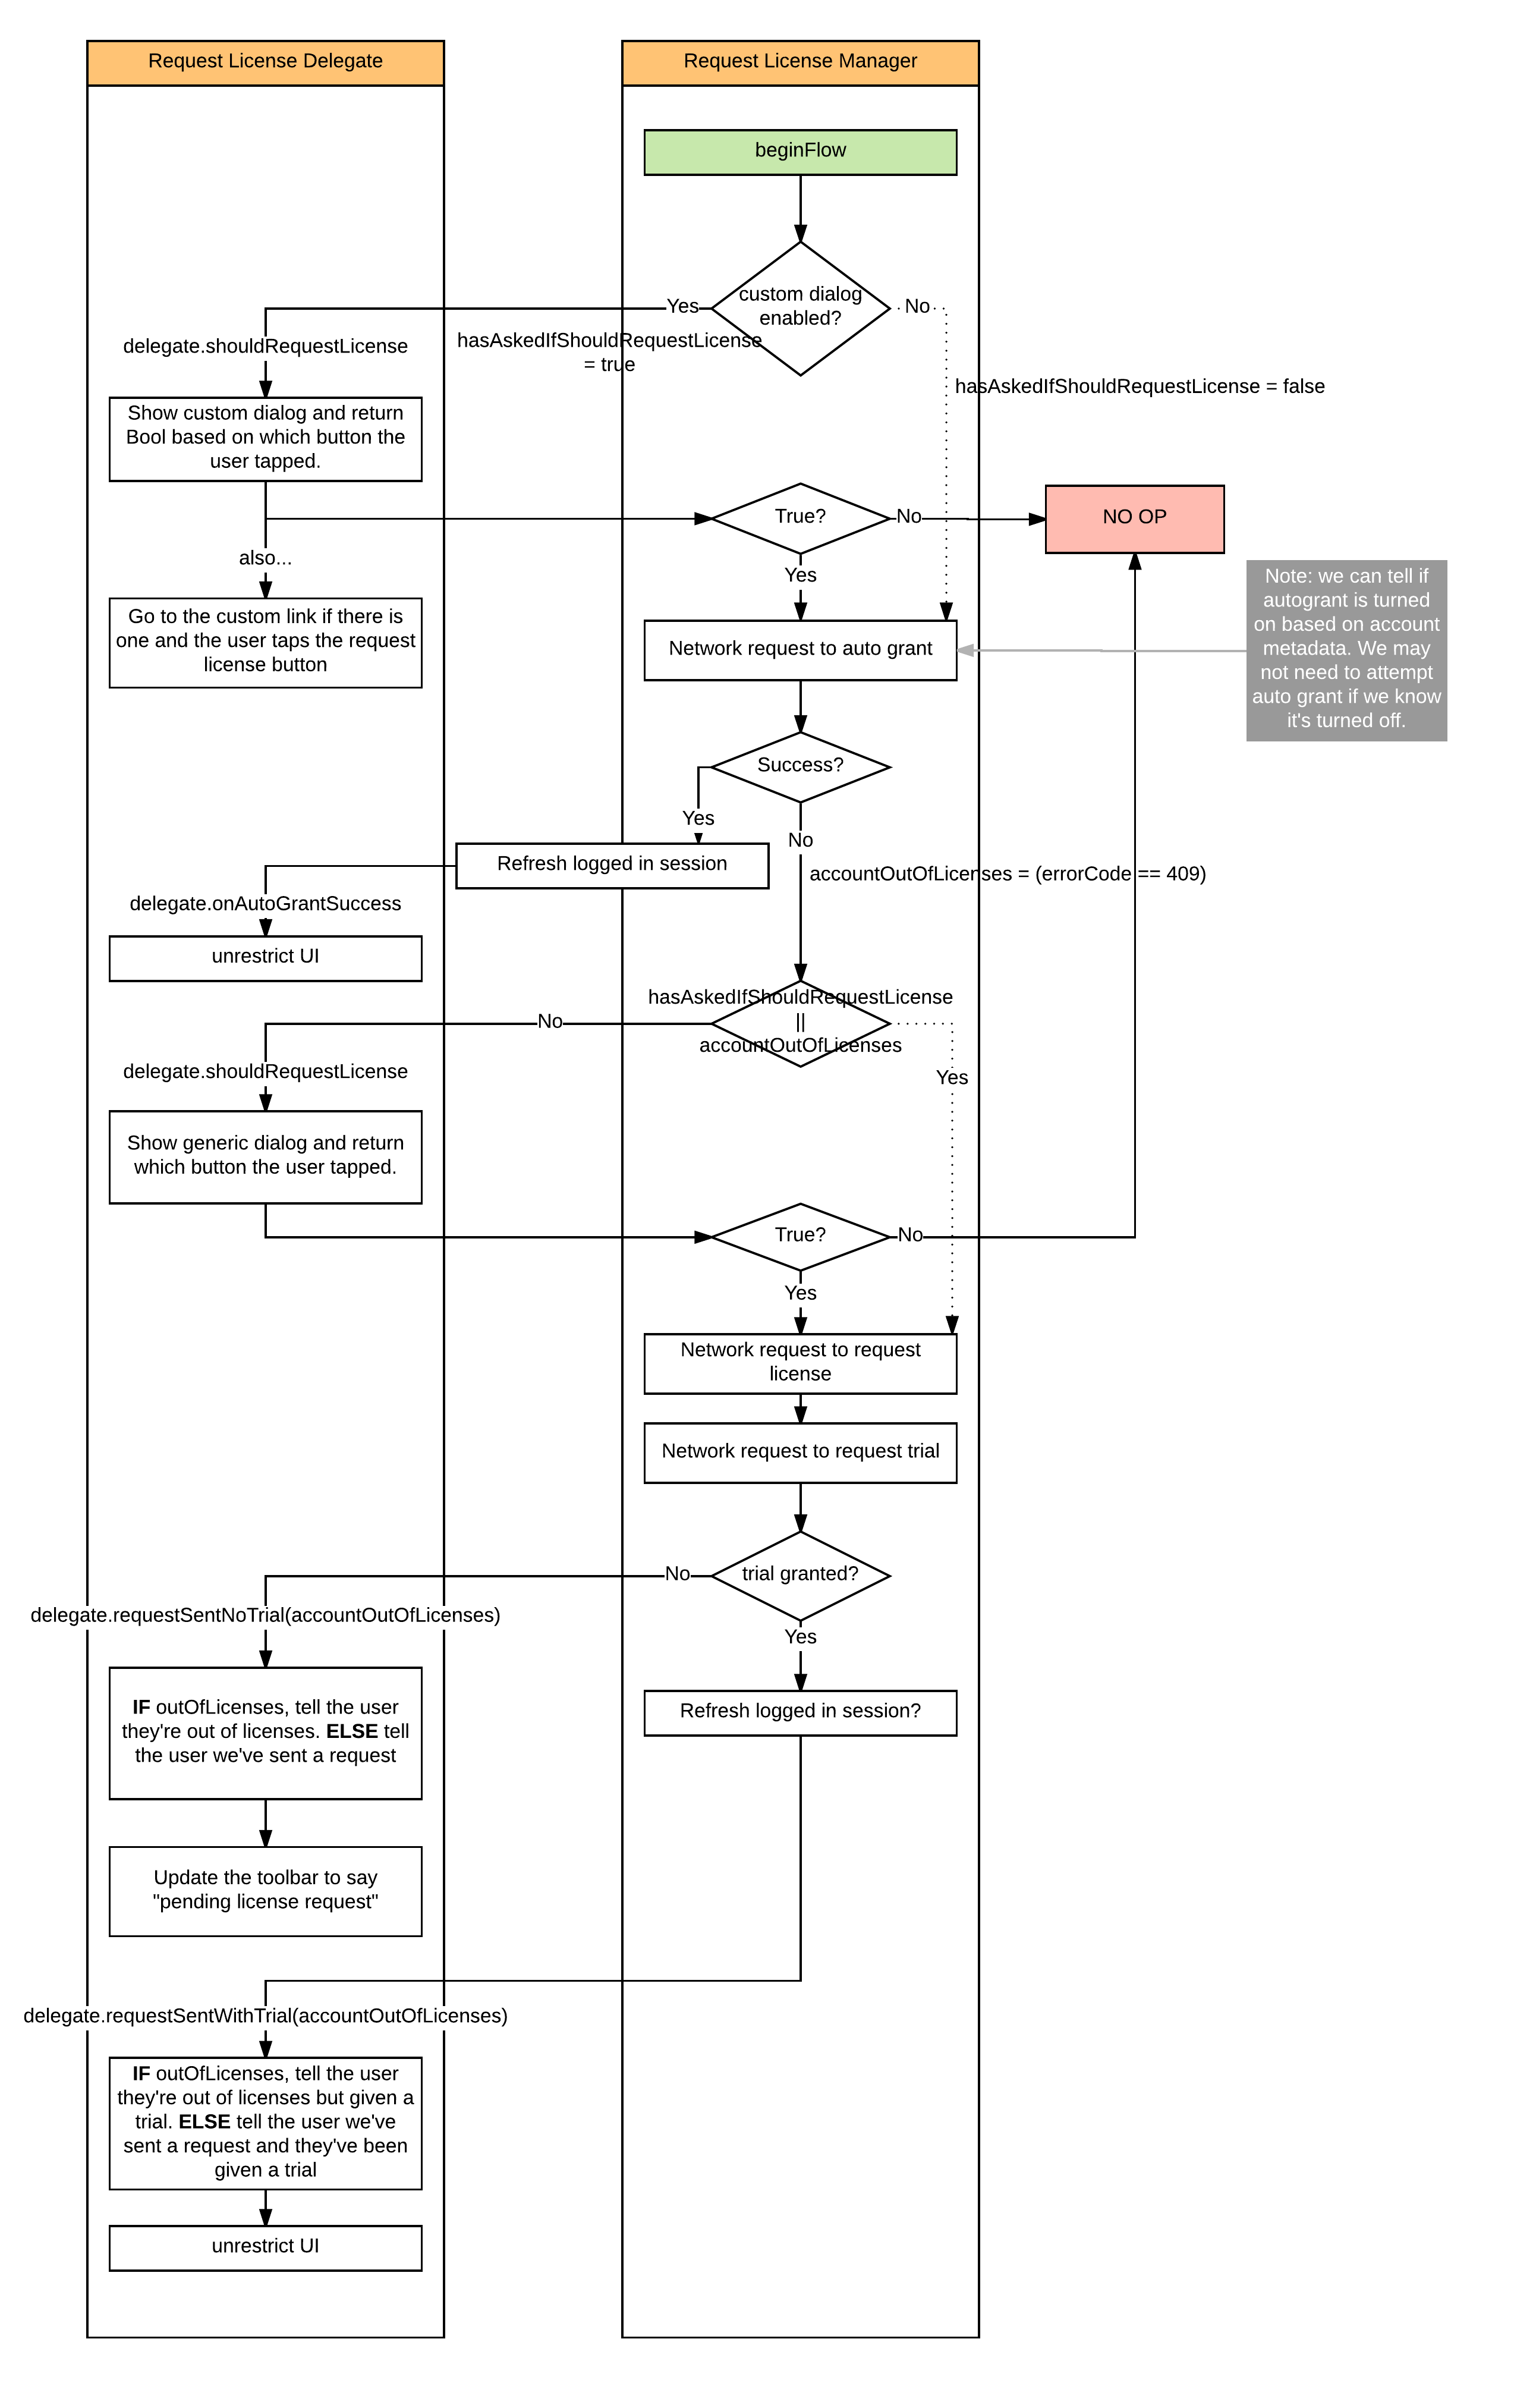
The team now refers back to this diagram as they build the same functionality in the Lucidchart Android app. They don’t have to look through lines of code again to build a similar feature—they have what Chloe calls a “mental model” on hand to effortlessly pick up where they left off.
Scheduling implementation
Even once they’ve documented technical architecture and workflows, engineers need to plan out the implementation process so they meet deadlines and stay organized with an entire team working on the same system at the same time.
Similar to our previous example, Jared Yarn turned to swimlanes again. This flowchart shows a column for each engineer working on the project and a row for each week before the release date.

Kamaron Peterson, Ben Dilts, and Brad Edwards have been using Lucidchart for a similar purpose: All three of them are rewriting a large chunk of code and need to coordinate their efforts.
They have used standard flowchart shapes to split the project into small, distinct parts and to mark the order in which these tasks need to be completed. This team also uses different colors to indicate tasks that are done, are in progress, or haven’t been started, and they use comments to add consideration notes on certain tasks.

Sharing knowledge
Visuals give your documentation a higher chance of being read and understood quickly, so when our engineers pass on their knowledge, they often incorporate diagrams to get the point across.
In an effort to help co-workers better develop their skill sets, many Lucid Software employees give Tech Talks on various subjects. Dmitry, along with some fellow engineers, gave a presentation on writing deploy-resistant code and used diagrams to show the overall concept and some examples. They created the diagrams in Lucidchart before importing them into Google Slides.

If you’re an engineer, try out Lucidchart yourself and see how diagrams can help you build and document your systems.
Like what you read? See how other Lucidites use Lucidchart in their respective fields:
Diagrams for Product Development
Diagrams for Quality Assurance
Diagrams for Marketing
Diagrams for Sales
Diagrams for People Operations
Lucidchart
Lucidchart, a cloud-based intelligent diagramming application, is a core component of Lucid Software's Visual Collaboration Suite. This intuitive, cloud-based solution empowers teams to collaborate in real-time to build flowcharts, mockups, UML diagrams, customer journey maps, and more. Lucidchart propels teams forward to build the future faster. Lucid is proud to serve top businesses around the world, including customers such as Google, GE, and NBC Universal, and 99% of the Fortune 500. Lucid partners with industry leaders, including Google, Atlassian, and Microsoft. Since its founding, Lucid has received numerous awards for its products, business, and workplace culture. For more information, visit lucidchart.com.