
How Lucidites use Lucidchart: Diagrams from sales
Lucid Content
Reading time: about 4 min
Topics:
We have about made it through all the teams at Lucid Software. Our product managers set a strategy and determine what new features would most benefit our customers. Our engineers build those features. Our QA team tests the software prior to release to squash any bugs. Our marketing team presents the product’s value to drive leads.
Finally, the sales team comes in to nurture those leads and close deals. Learn how Lucidchart diagrams have been beneficial across our entire sales org.
Adding incoming leads to Salesforce
Before the sales reps even get on the phones, diagrams allow Sales Operations to visualize team organization, strategy, and more efficient processes. The following chart shows how the leads collected from HubSpot online forms are added into Salesforce and assigned to a sales representative.
This process involves a number of custom-built solutions. By creating a diagram, the Sales Operations team can visualize how multiple steps come together to deliver leads. Diagrams like this one have kept Sales Operations from making mistakes as they introduce new lead sources and grow the operations and marketing teams. The marketing team also has access to this diagram so they will understand how potential HubSpot changes affect the lead flow.

Processing leads
Once the leads come in, how does our sales team convert them into customers? We have a process for that, too, and it keeps everyone on the same page. Matthew Gillrie, Senior Manager of Sales Enablement, explained that Lucidchart made it easier to develop a sales process flow—all stakeholders could create the process together in the editor, and they can make and implement changes easily even now because they are editing the very document their team has access to.
The diagram shown below acts as a training/reference guide for all the sales reps. Early on, the team even printed out the process flow and gave a copy to each sales rep. Even if sales representatives can recall the process from memory, a document like this can help them remember small nuances in the process that only happen now and then.
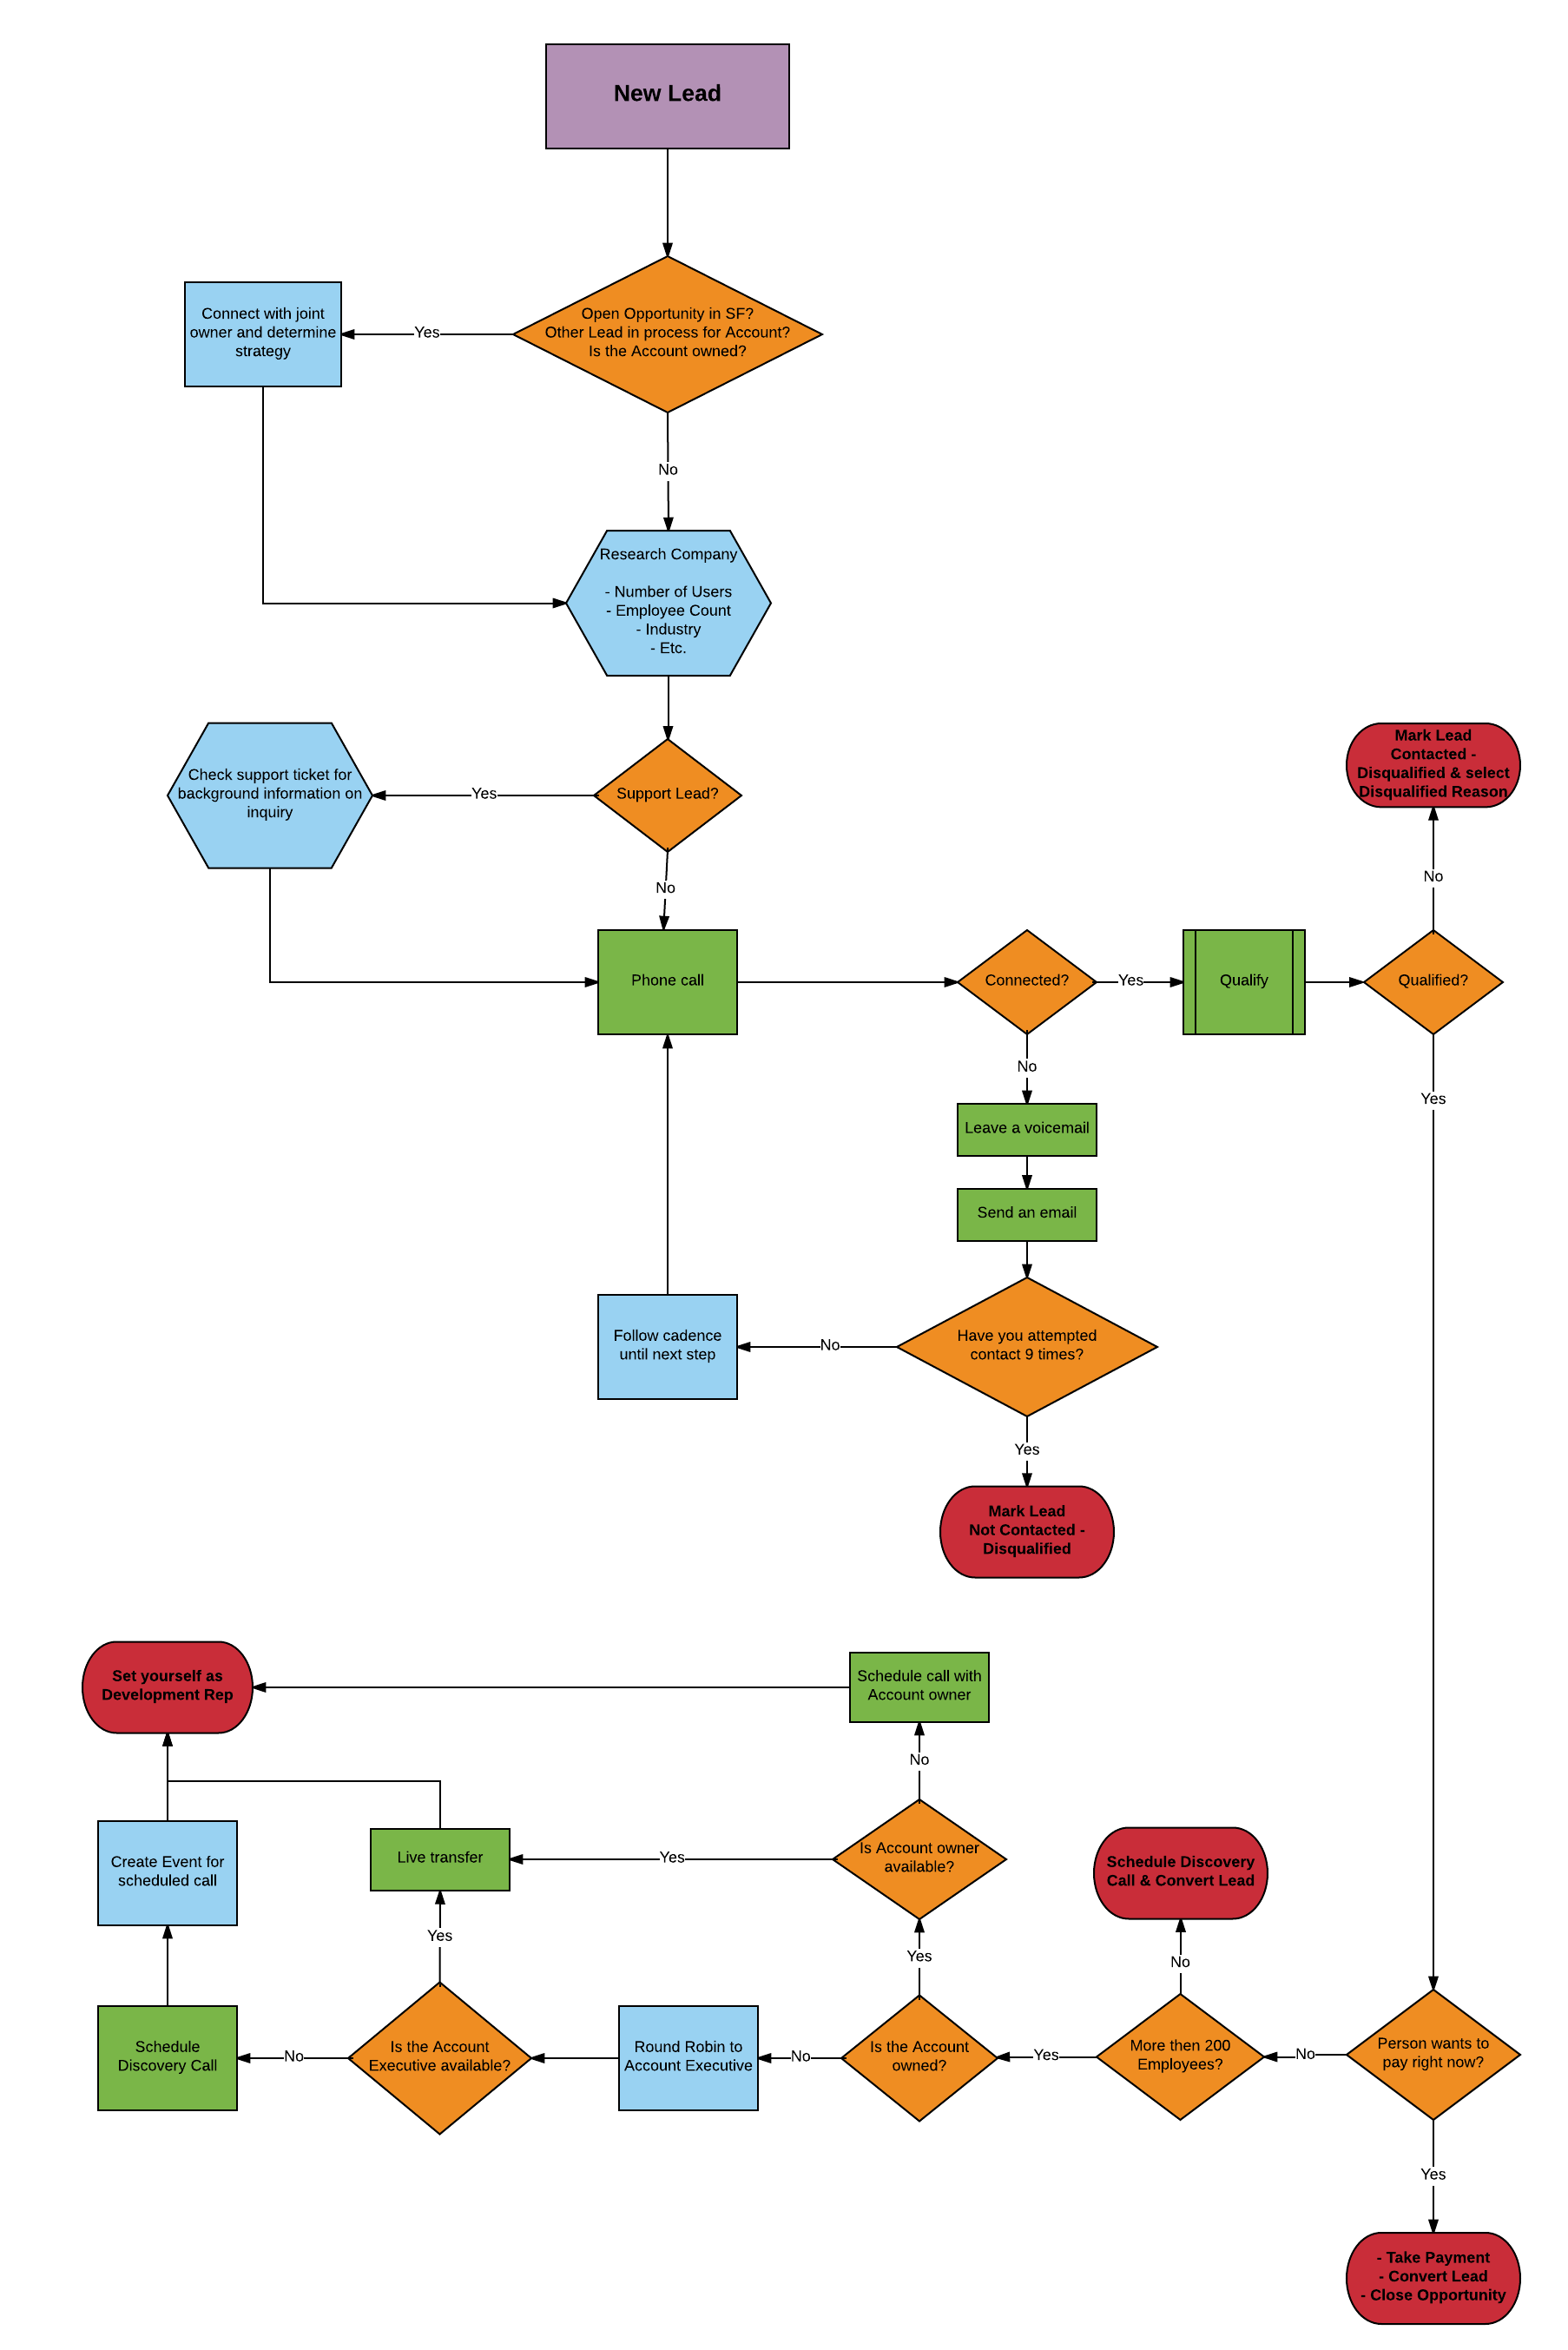
As the sales organization continues to grow, documents like this become invaluable. Recently, one of our rockstar managers was promoted, and the sales team used this actual document to onboard his replacement.
A visual representation of a complicated process keeps everyone on the same page. Any time we want to discuss potential changes, the sales team can bring up this document to ensure everyone is on the same page.
Want to build out your own process? Use our sales process map template to get started.
Documenting rules of engagement
For those who are less familiar with sales, the rules of engagement determine the strategy for connecting with customers—they clarify who gets the lead and how the team works together to close a deal. Our sales org at Lucid Software mapped out these rules in Lucidchart. The full document also includes exceptions, so there’s never a question of who should contact a certain customer. With a fast-growing team, the sales team references this document regularly and avoids any confusion for new hires.

This documentation is important for the happiness of the sales reps. Since their paychecks depend on the number of deals they close, sales reps could feel like they missed out on hitting their quotas or receiving payment if someone “stole” their leads. Not so with the process flow explaining rules of engagement. Sales managers have already made decisions for each scenario, and the entire sales org should be aware of those decisions.
Sales Trainer Rob Yuen explained another benefit to this documentation: Sales managers can spend a lot of time solving disputes, rather than coaching their teams to sell more and faster. With less confusion over the rules of engagement, sales managers have more time to train.
Making the sale
Since the concept of selling value is dynamic—what’s valuable will change from customer to customer—our sales org doesn’t use flowcharts as much for scripting. However, they do use conversation trees in Lucidchart to create a discovery framework. Similar to the other process flows shown, the conversation tree leads sales reps through a series of questions that prompt them to ask about the potential customer’s use case.
From directing incoming leads to delivering the perfect pitch, Lucidchart diagrams have helped our sales organization at Lucid Software succeed. See how visualization can impact your sales.
And if you want to hear more about our sales team, read Peter Chun’s article and learn how to build your own sales process flow.
Lucidchart
Lucidchart, a cloud-based intelligent diagramming application, is a core component of Lucid Software's Visual Collaboration Suite. This intuitive, cloud-based solution empowers teams to collaborate in real-time to build flowcharts, mockups, UML diagrams, customer journey maps, and more. Lucidchart propels teams forward to build the future faster. Lucid is proud to serve top businesses around the world, including customers such as Google, GE, and NBC Universal, and 99% of the Fortune 500. Lucid partners with industry leaders, including Google, Atlassian, and Microsoft. Since its founding, Lucid has received numerous awards for its products, business, and workplace culture. For more information, visit lucidchart.com.