Affinity diagram software
Lucidchart is a visual workspace that combines diagramming, data visualization, and collaboration to accelerate understanding and drive innovation.
Supercharge your brainstorm with an affinity diagram
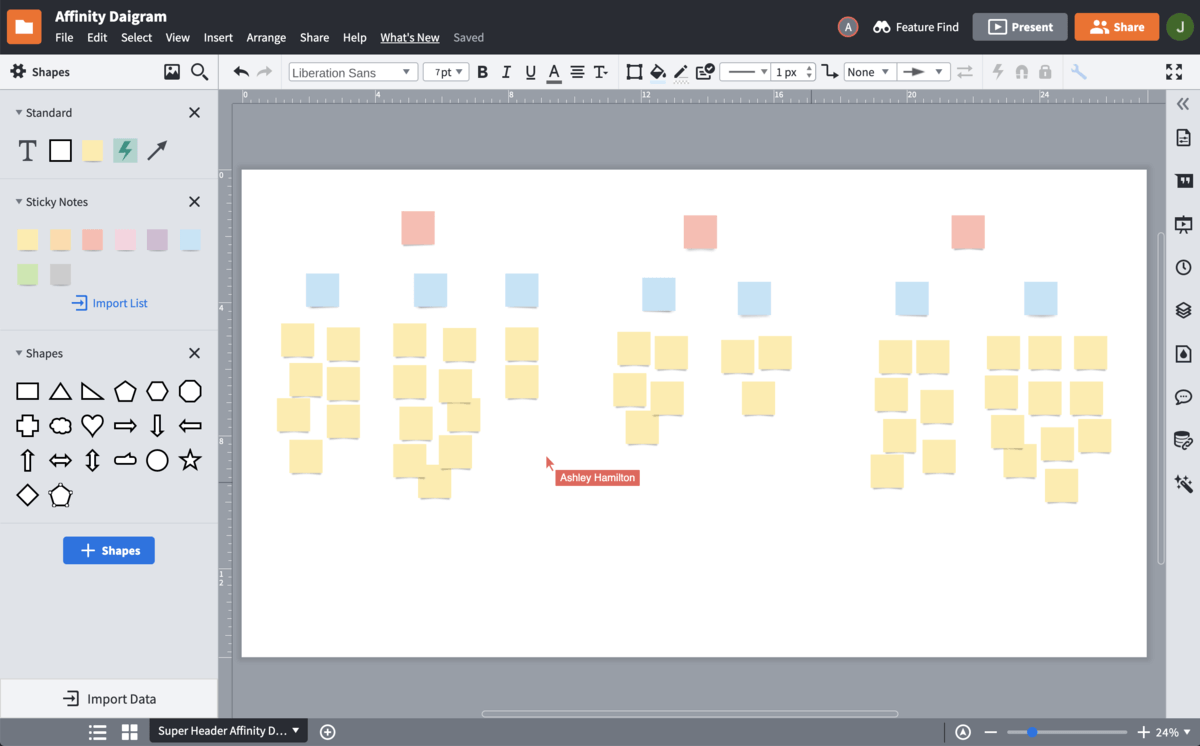
Facilitate powerful brainstorming and collaboration
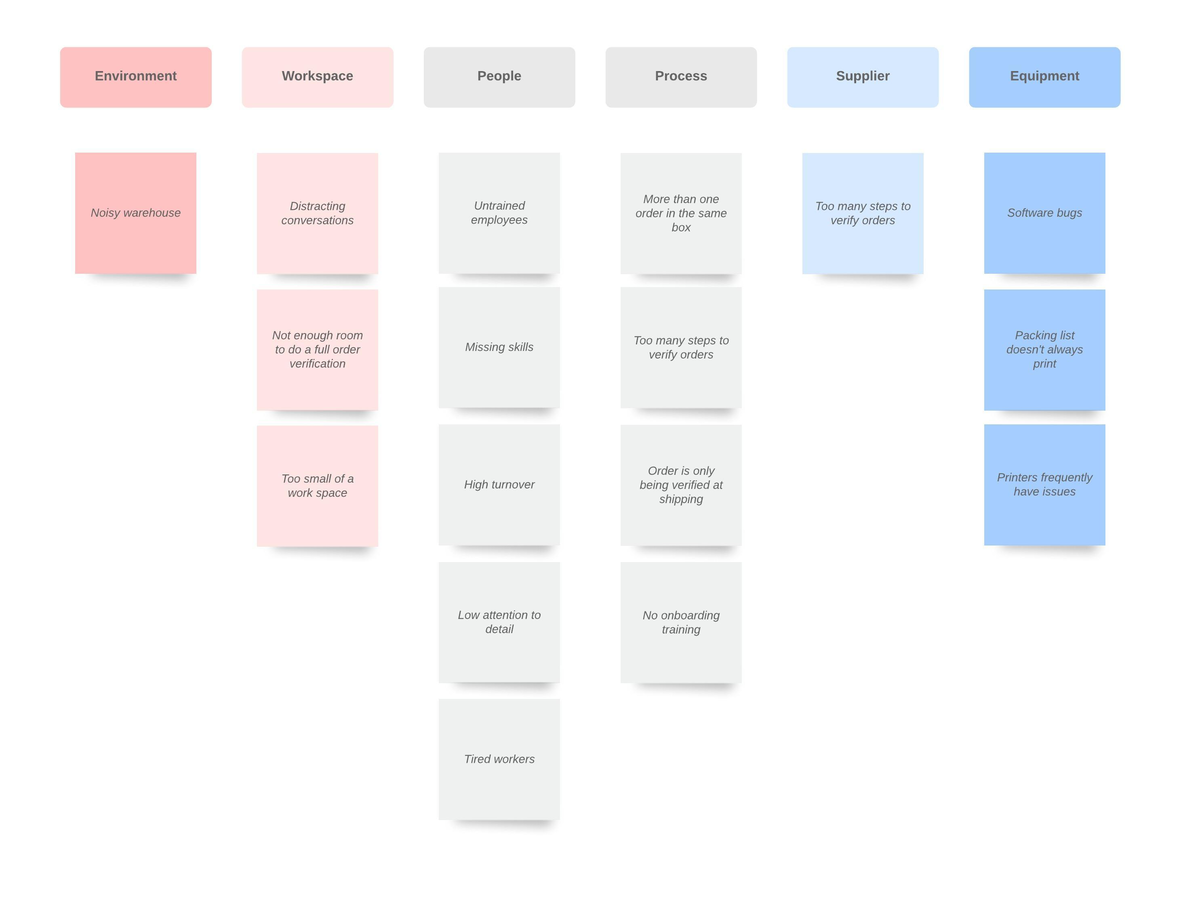
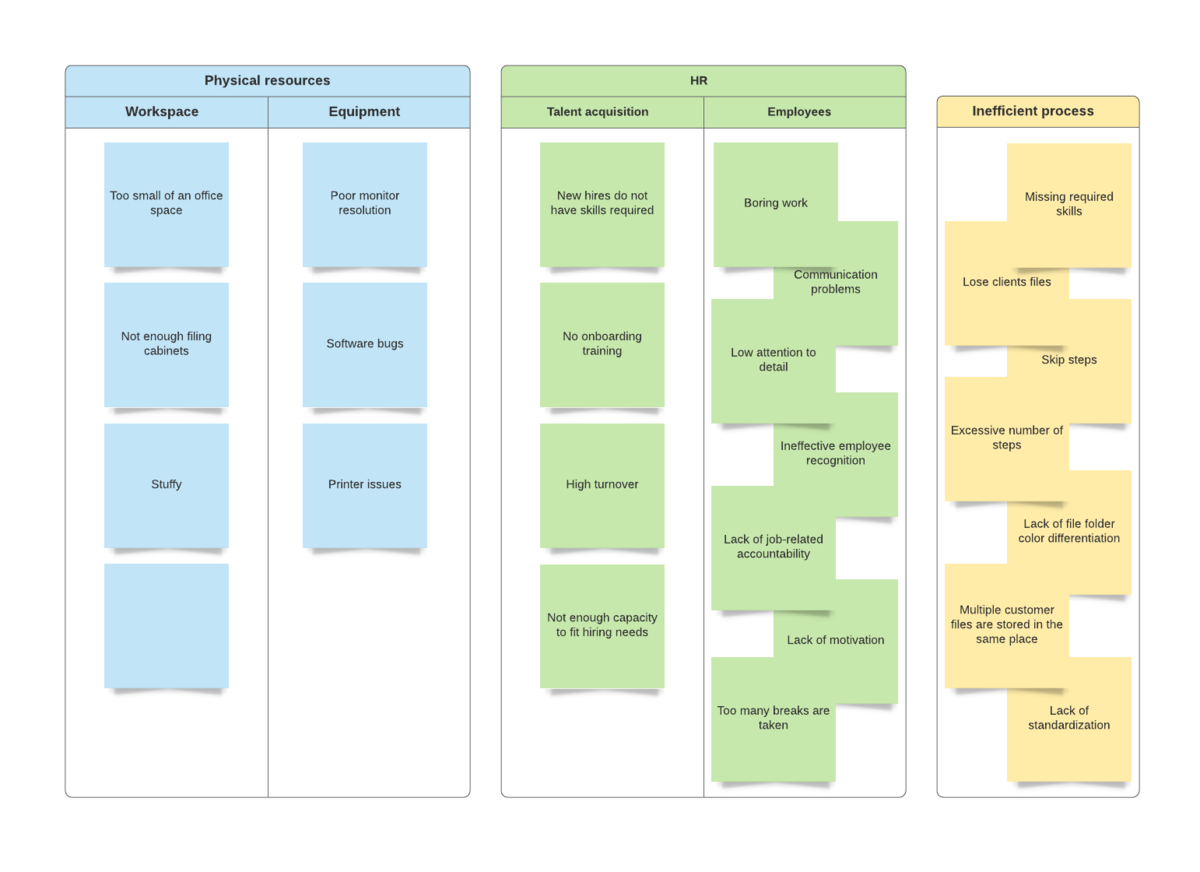
Affinity diagrams are the ideal brainstorming tool for projects involving large teams, large data sets, or a wide range of ideas. Teams can use affinity diagrams as a means of consolidating ideas and information into manageable groups for further prioritization, analysis, and understanding. With Lucidchart, the leading visual workspace, your entire team can instantly share ideas and collaborate on your affinity map in real time.
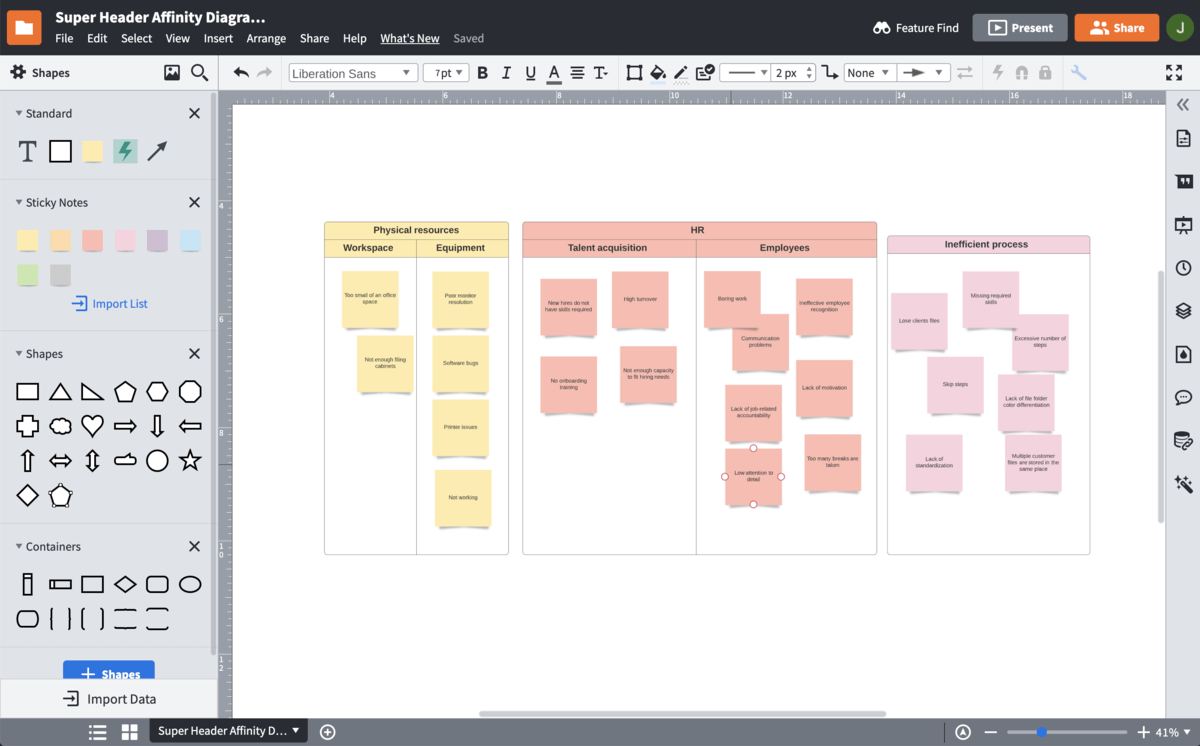
Take charge of process improvement and quality control
Project managers and product developers can employ affinity analysis to improve processes and enhance quality control, and UX teams can more easily identify the factors that contribute to effective design for customers. Gain instant understanding of relationships between information, opinions, problems, and solutions, so you can prioritize actions and simplify group decision-making. With Lucidchart’s intuitive canvas at your disposal, you and your team can easily organize ideas regarding processes that need attention, so you can quickly set in motion any improvements.
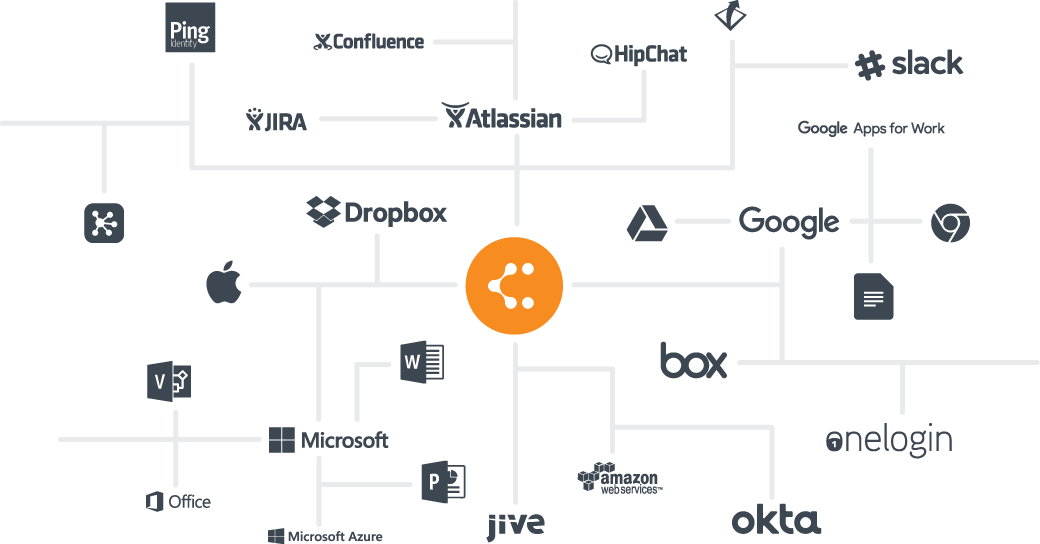
Easily customize and share your affinity diagram
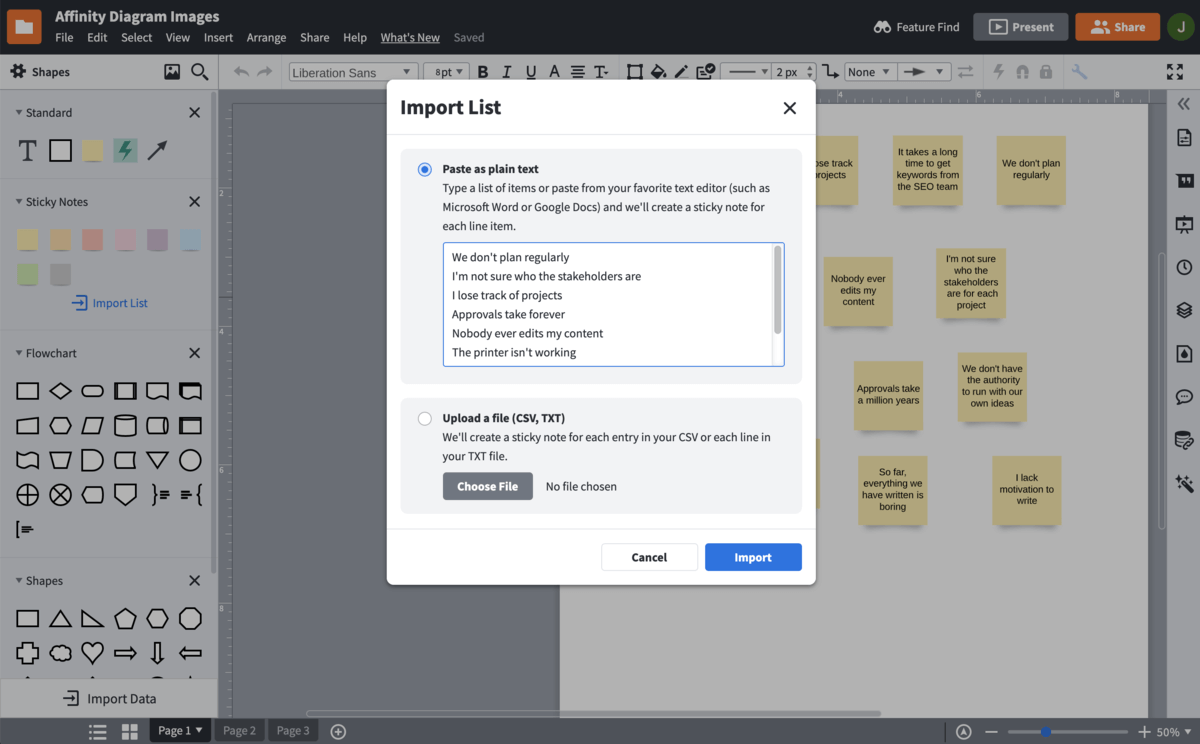
Due to its simple construction, the affinity diagram has virtually no learning curve, making rapid brainstorming sessions easy and effective. Lucidchart simplifies affinity mapping even further with features like hotkeys, drag-and-drop shapes, and even a sticky note import that turns long lists of concepts into individual sticky notes for faster grouping. For a seamless brainstorming experience, use our integrations to share your affinity map across platforms like G Suite, Microsoft Office, Confluence, and Slack.
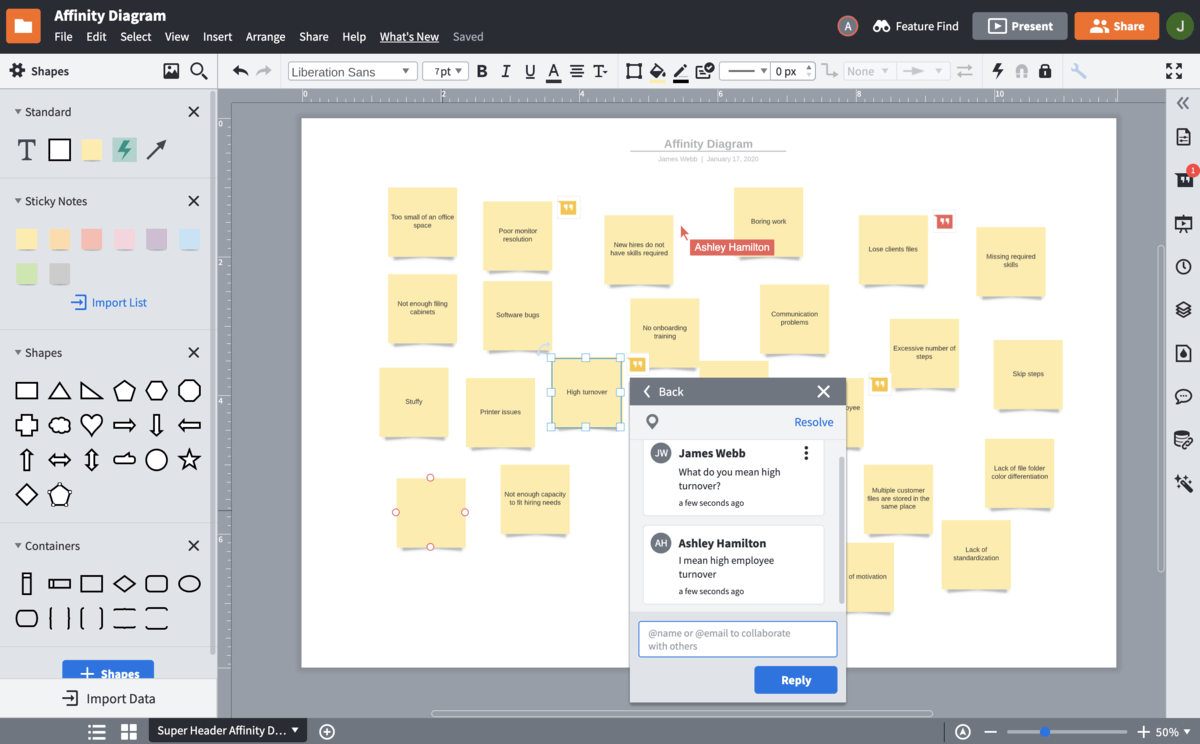
Start affinity diagramming with your team in real time
Make your affinity diagram the ultimate collaborative experience with Lucidchart. Easily incorporate feedback and ideas from team members and stakeholders with in-editor chatting, @mention comments, sticky notes, and collaborative cursors to show who’s contributed to your affinity chart. Real-time collaboration means you see changes as they’re made, so you never have to worry about version control. Since Lucidchart operates in the cloud, your collaborators can access and edit your affinity map from any device, any time.
Turn data into visuals
Affinity grouping is especially useful in helping teams grasp large or complex ideas that might otherwise be hard to organize or understand. With Lucidchart, you can easily turn collected data into a shared affinity diagram to help you visualize related categories and analyze information. Add and organize concepts or ideas manually into shapes or use our data linking feature to import a CSV or text file to incorporate already compiled data instantly into your brainstorm.
How to make an affinity diagram
Identify the purpose or objective
Determine the focus topic and use that to title your affinity diagram.
Determine group categories
Create categories below the title. These categories will be used to arrange multiple solutions or factors into logical groups.
Add contributing factors within each category group
Jot down all major information, ideas, or issues that relate to your objective and add them to your affinity diagram as closely within a related group as possible.
Organize your factors within their groups
As you add your contributing factors, go back and organize them as needed so each factor is placed within its most appropriate category. There will likely be more than one factor within each category.
Analyze and share
Once your factors are organized, share your diagram with others that may want to contribute their input. Analyze the diagram with your team to understand key issues and prioritize.
Frequently asked questions about affinity diagrams
Descubre Lucidchart en menos de 5 minutos
Used by millions across the globe
"Lucidchart helps me and my team chart a pathway that puts our thoughts in one place and enables our colleagues to develop our ideas using the technology Lucidchart offers."

4.5/5 stars 650+ reviews
