
Value stream mapping software
Lucidchart is an intelligent diagramming application that takes Value stream mapping to the next level. Customize shapes, import data, and so much more. See and build the future from anywhere with Lucidchart.
Make a free value stream map


By registering, you agree to our Terms of Service and you acknowledge that you have read and understand our Privacy Policy.


A VSM software to visualize and optimize any process
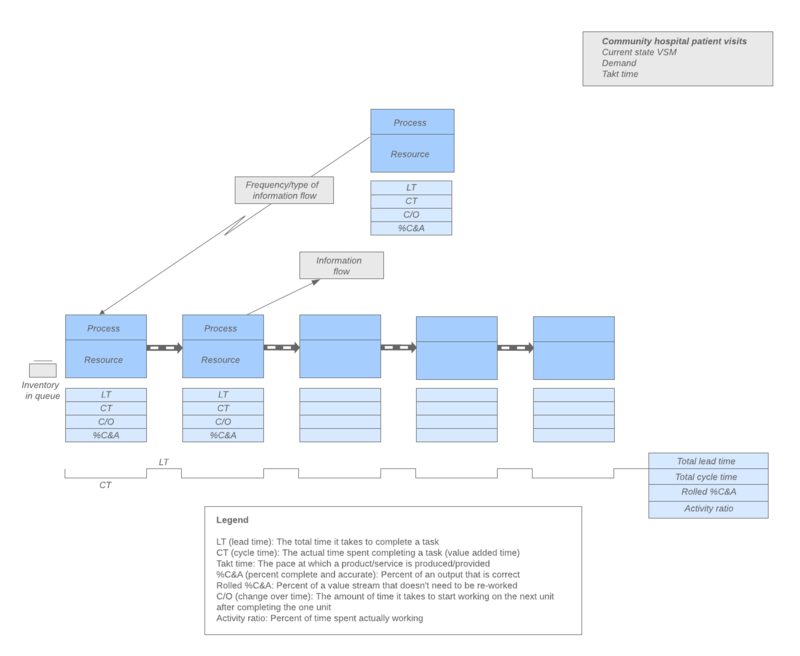
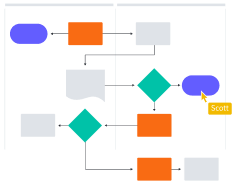
Better understand the flow of production and information
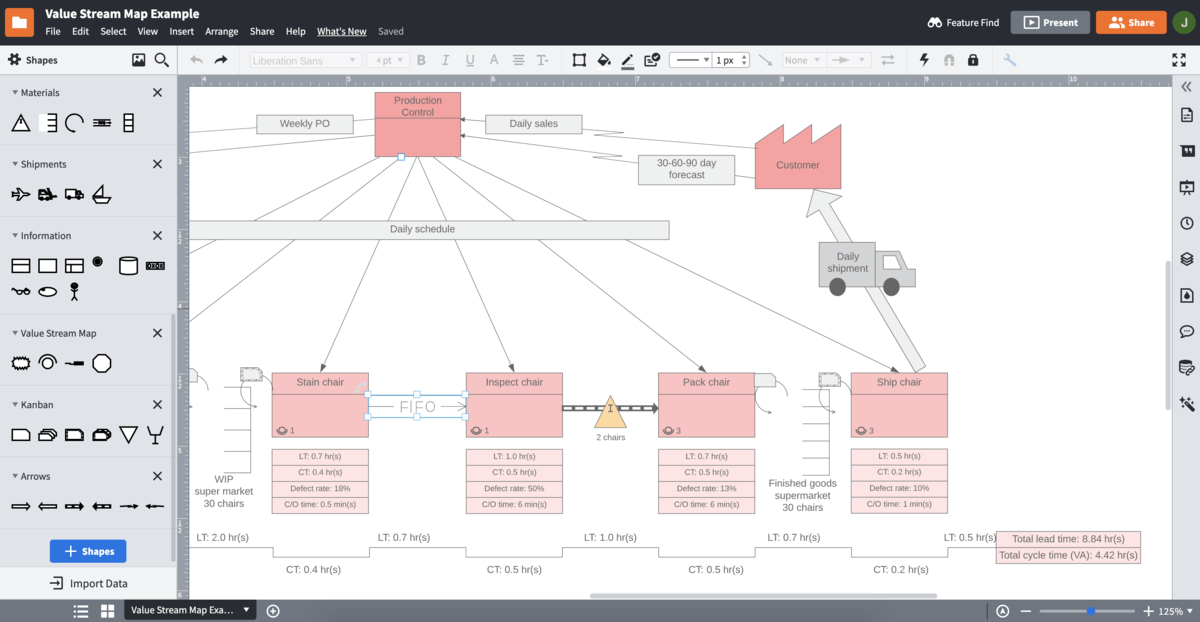
A value stream map is a lean visual tool designed to represent the flow of material and information through the production process of a product or service. With roots in the manufacturing industry, a VSM can be used to demonstrate information and customer flow within business services, patient flows within healthcare, and so much more.
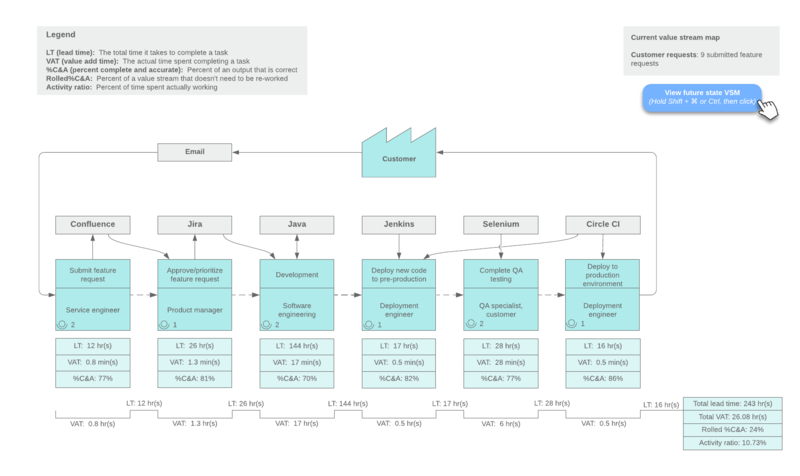
Add real value by eliminating waste and inefficiencies
A well-constructed value stream map can create universal understanding regarding the ins and outs of your process. Once the details of your process are clearly laid out, you can easily identify value added and non-value added steps, including those that produce waste, create excess inventory, waste time, or lead to QA issues.
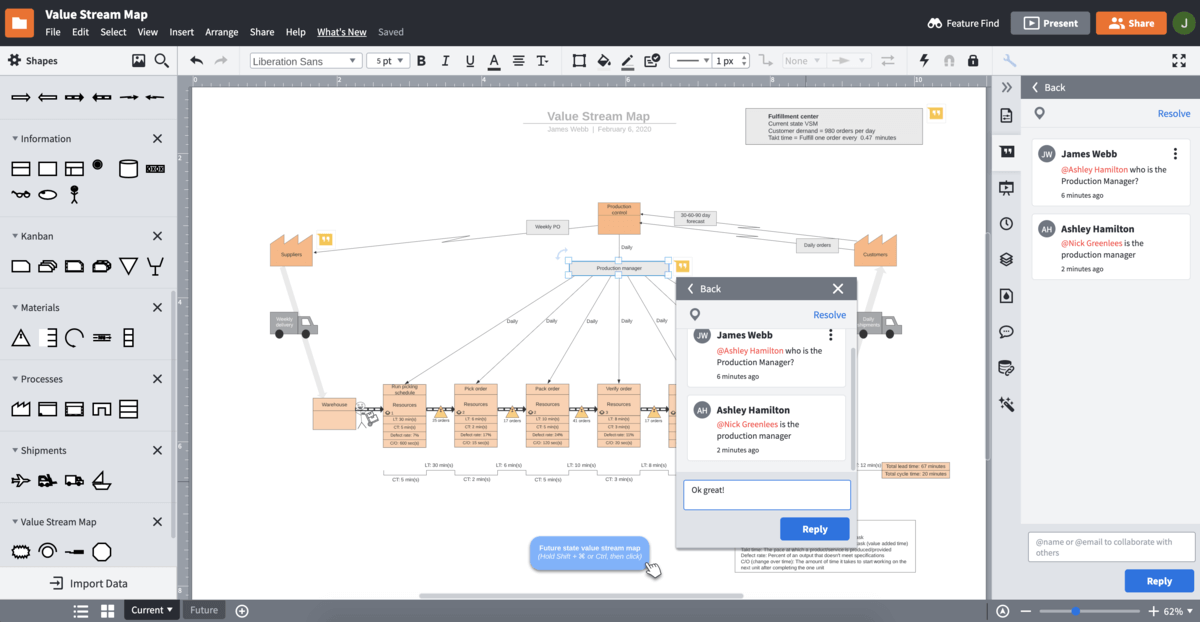
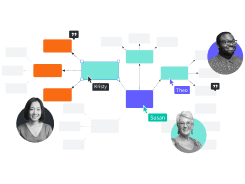
Collaborate across departments for maximum efficiency
Lucidchart makes value stream mapping online a simpler, more inclusive process with its built-in collaborative functionality and by giving collaborators an always up-to-date version of the diagram. Use @mention comments, in-editor chat, and advanced sharing options to get instant feedback regarding your processes. Our cloud-based value stream mapping software means you can work from any operating system or device and see all of your updates in real time.
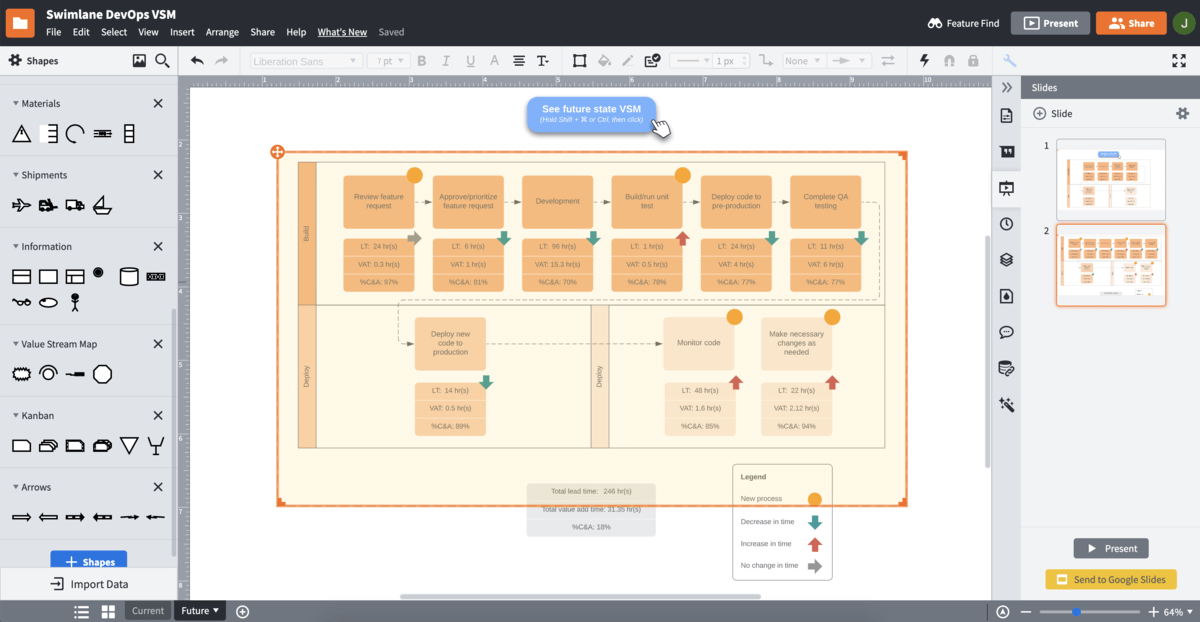
Instantly present your value stream map to any audience
Share your VSM with employees, managers, and executives without ever leaving the editor with Lucidchart’s presentation mode. Use presentation mode to provide your audience with a clear and complete overview of your value stream and zero in on key steps and information within your process as needed. You can also import your entire presentation to Google Slides or PowerPoint for additional presenting options.
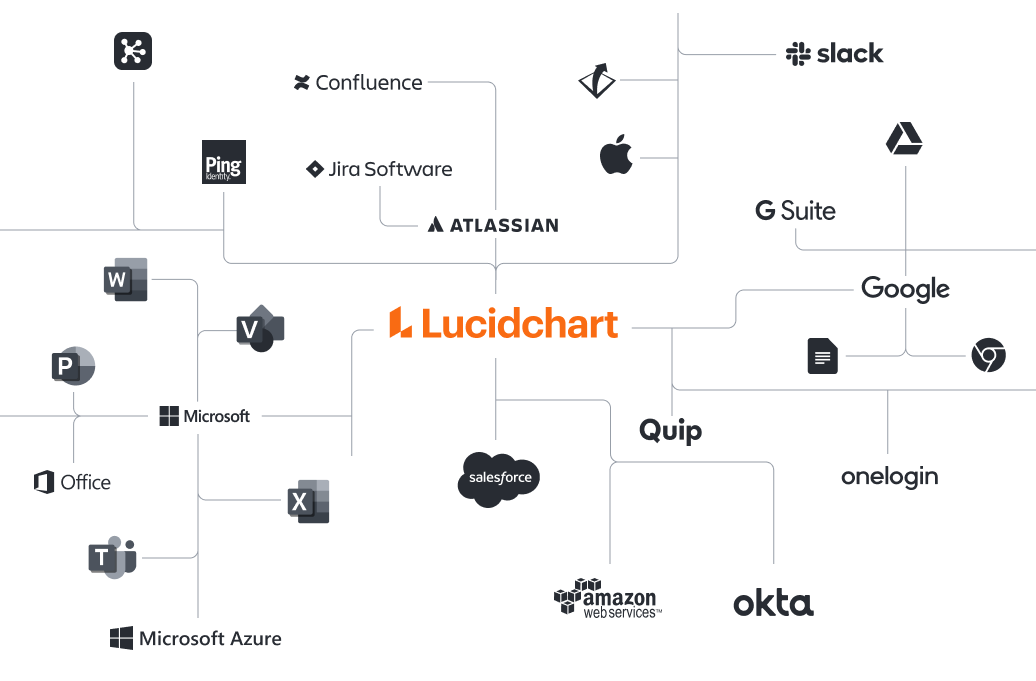
Work with, not against, your workflow with popular integrations
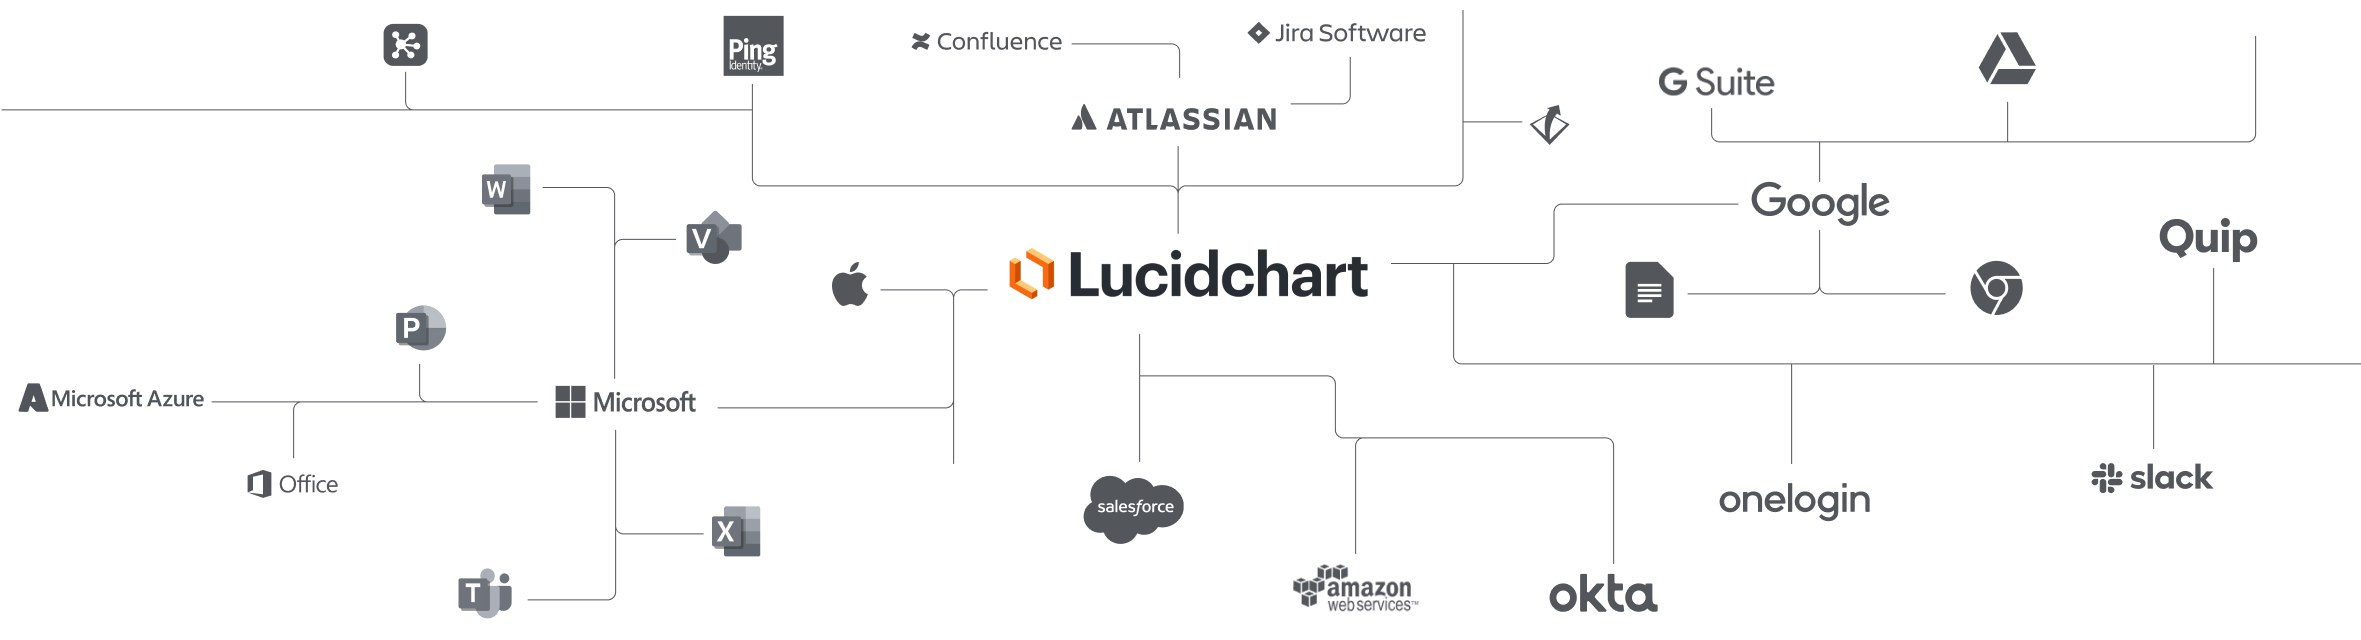
Our VSM software works seamlessly with Google Workspace, MS Office, Confluence, Slack, and more, giving you endless options for sharing your work. Easily embed your VSM into your favorite app to create an accessible reference for your team, manage editing privileges to prevent unwanted changes, and collect feedback from collaborators—without ever disrupting your team’s workflow.
Master the basics of Lucidchart in 3 minutes
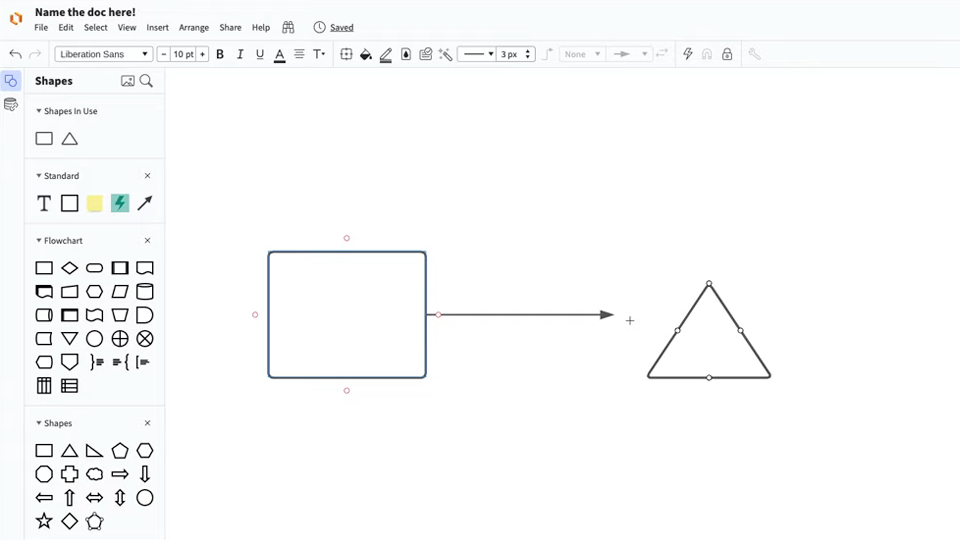
master the basics of Lucidchart in 5 minutes
- Create your first VSM diagram from a template or blank canvas or import a document.
- Add text, shapes, and lines to customize your diagram.
- Learn how to adjust styling and formatting.
- Locate what you need with Feature Find.
- Share your diagram with your team to start collaborating.
Free value stream mapping templates

Lucidchart integrations
Connect Lucidchart to your favorite industry-leading apps.
See why teams choose Lucidchart
Diagram, visualize data, and collaborate all in one platform.
Collaboration
Create VSM diagrams on any device with ease. Lucidchart helps teams collaborate in real time from anywhere in the world. Enhance productivity while working together with your team to achieve your product goals.
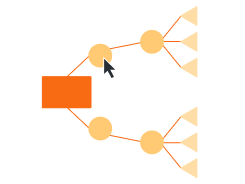
Clarity
Lucidchart brings clarity to the complex. Intelligent diagramming allows you to quickly visualize projects and processes from start to finish.
Alignment
Drive alignment with your team by collaborating in the same space. Quickly map out processes and ideas together in real time so that you never miss a beat.

Better Together
The Lucid Visual Collaboration Suite transforms the way you work from ideation to project completion. Brainstorm and plan in Lucidspark then map it out in Lucidchart. Create a living blueprint of your organization.