What is a fishbone diagram?
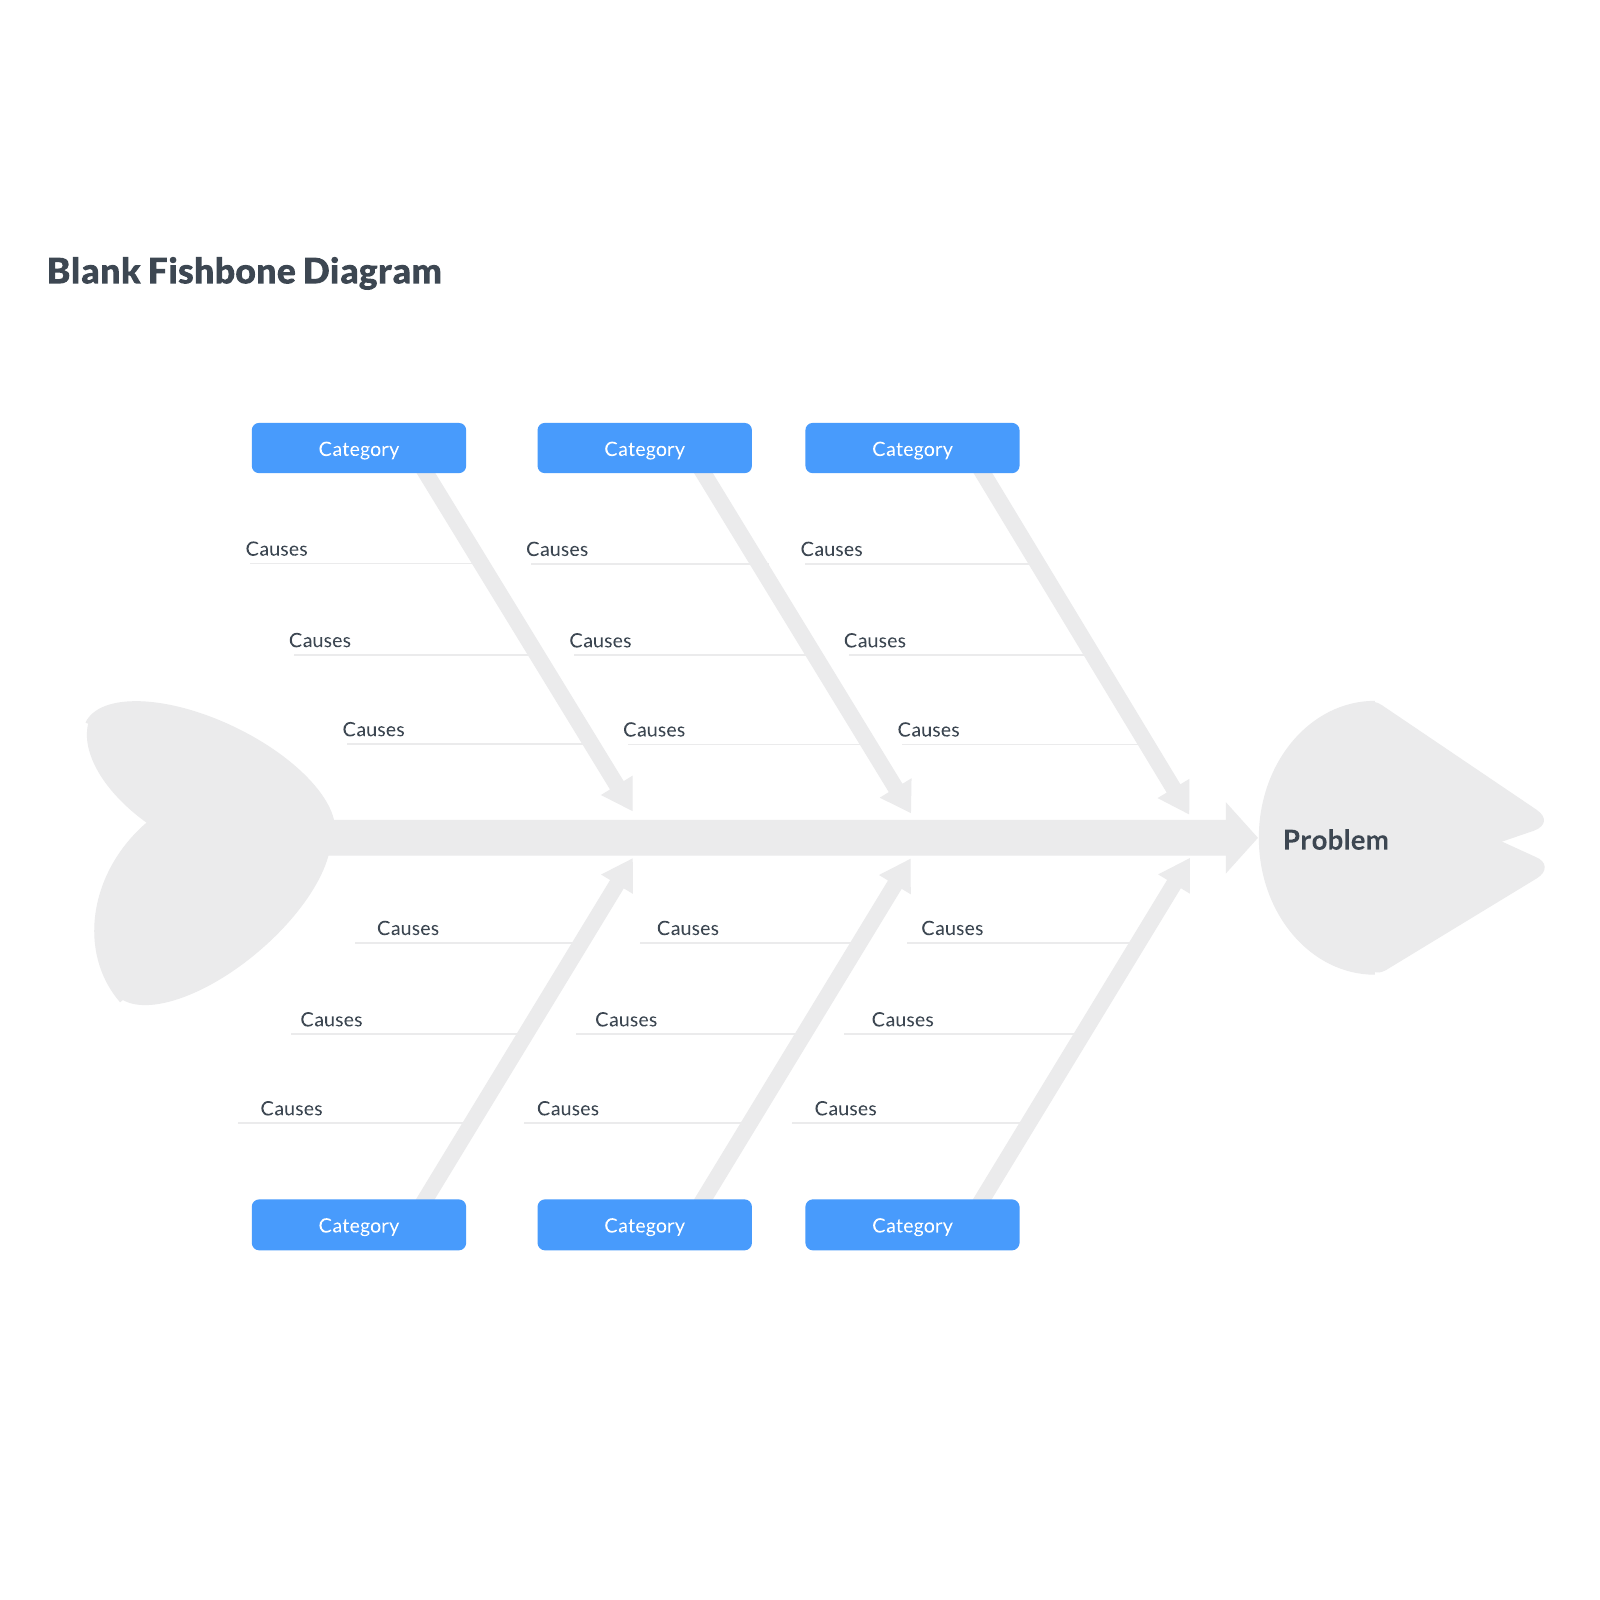
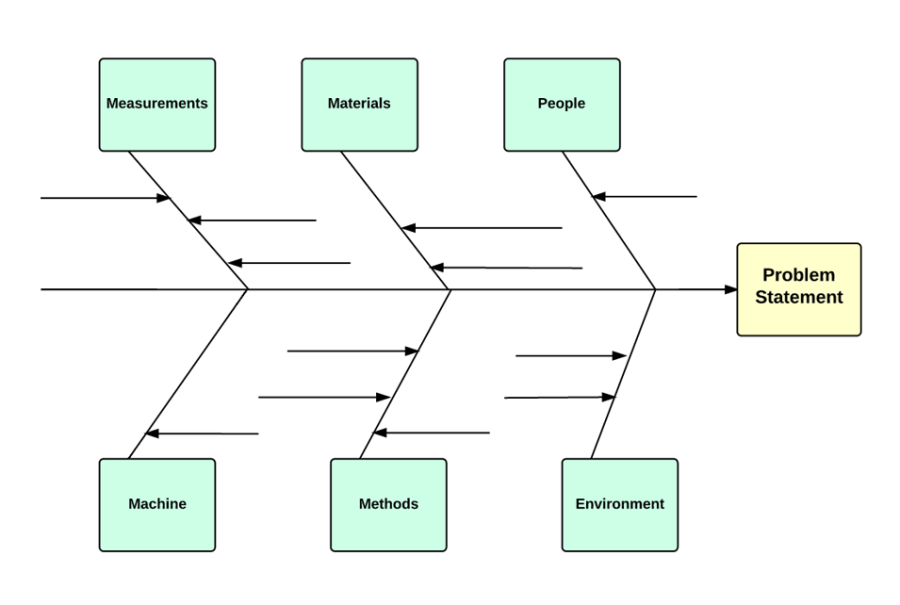
A fishbone diagram is also known as an Ishikawa diagram, herringbone diagram, or cause-and-effect diagram. This is because it describes the potential causes of a given problem or outcome. The diagram resembles an actual fish bone, with a long line running down the center pointing to the main outcome, also called the "problem statement". The other bones branch out from the middle bone and represent different categories of causes. In the template below, we've shown the six standard categories, Measurements, Materials, People, Machine, Methods, and Environment. However, feel free to swap these out for categories that best fit your problem.
Master the basics of Lucidchart in 3 minutes
- Create your first diagram from a template or blank canvas or import a document.
- Add text, shapes, and lines to customize your diagram.
- Learn how to adjust styling and formatting.
- Locate what you need with Feature Find.
- Share your diagram with your team to start collaborating.
How to create a fishbone diagram from a template or new document
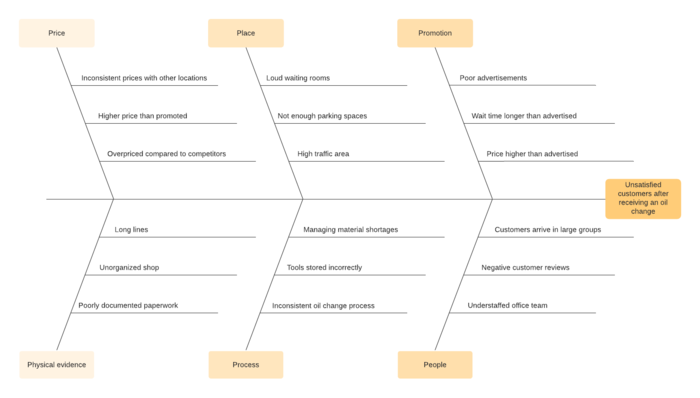
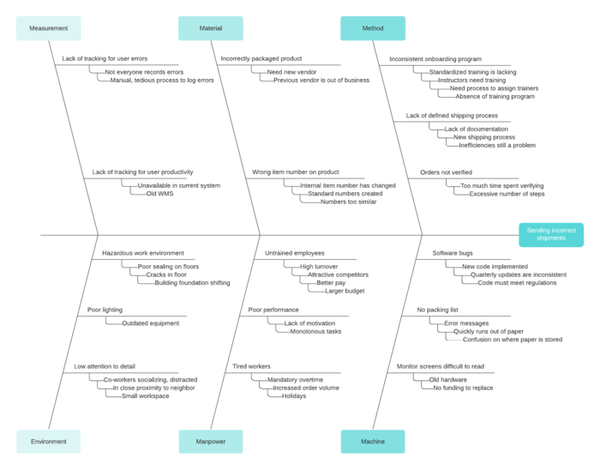
It’s simple to create your own cause and effect analysis example by using Lucidchart. It’s professional diagramming software that runs seamlessly in your browser. This example shows the brainstorming process for a marketing team that’s trying to understand why website traffic has dipped. Open our editable template to start tackling your own business’s obstacles.

Get started in Lucidchart
- Register for a Lucidchart account.
- Navigate to My Documents.
- Click Create > New Document.
- Explore and start with a fishbone diagram template or create a new document in Lucidchart.
Lucidchart has several fishbone diagram templates, covering various levels of complexity. Click the arrow next to “+Document” to open Lucidchart’s template library. To read about a template, simply click on it once—this will give you a closer look at the template and recommended uses. When you’ve found a template that suits your needs, select it and click “Create Document.” (To use the template below, click on the image.)
Determine your problem statement
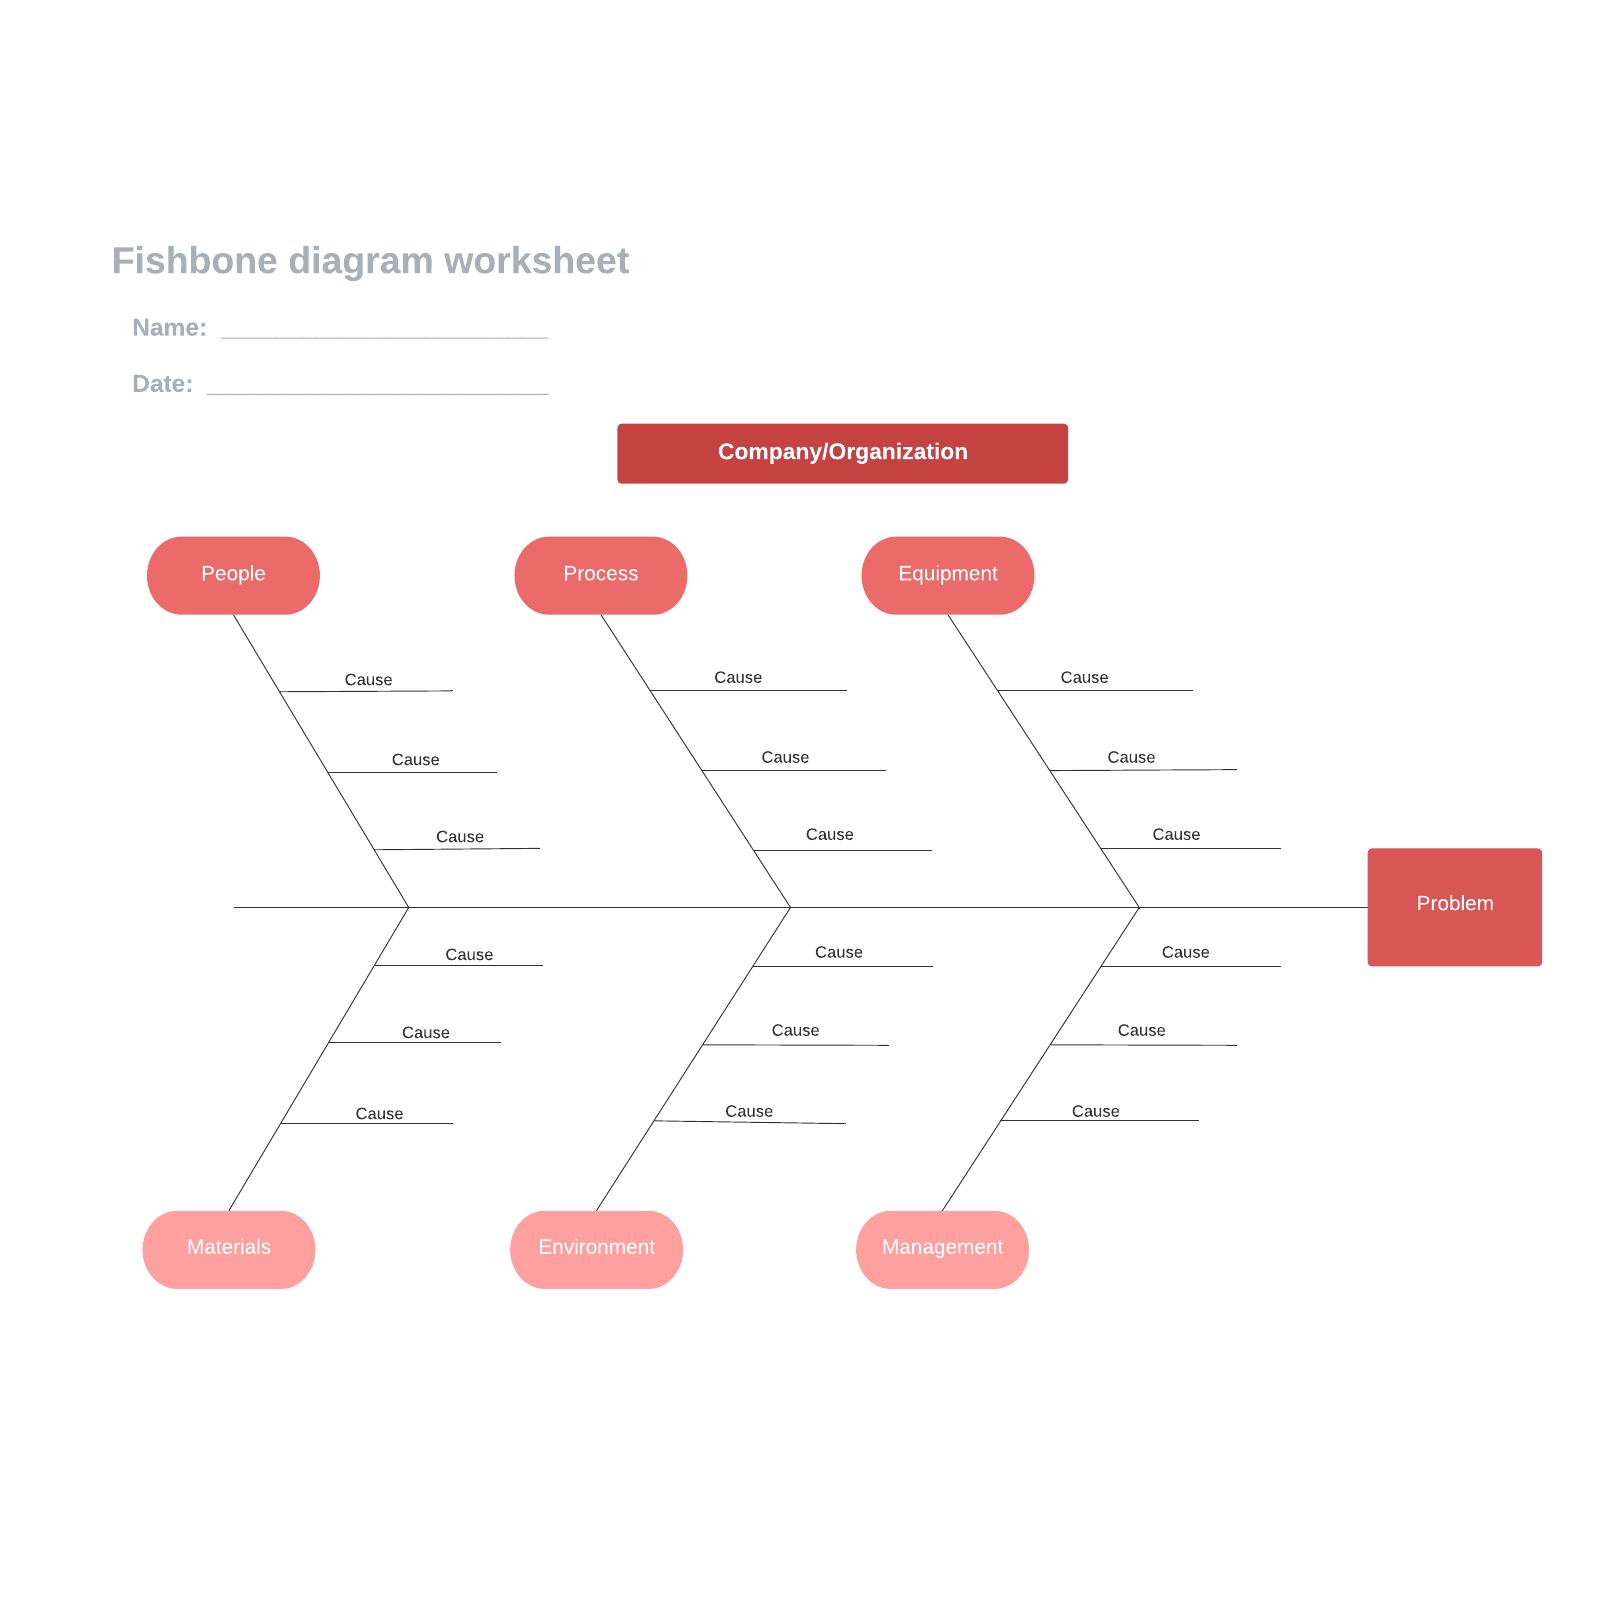
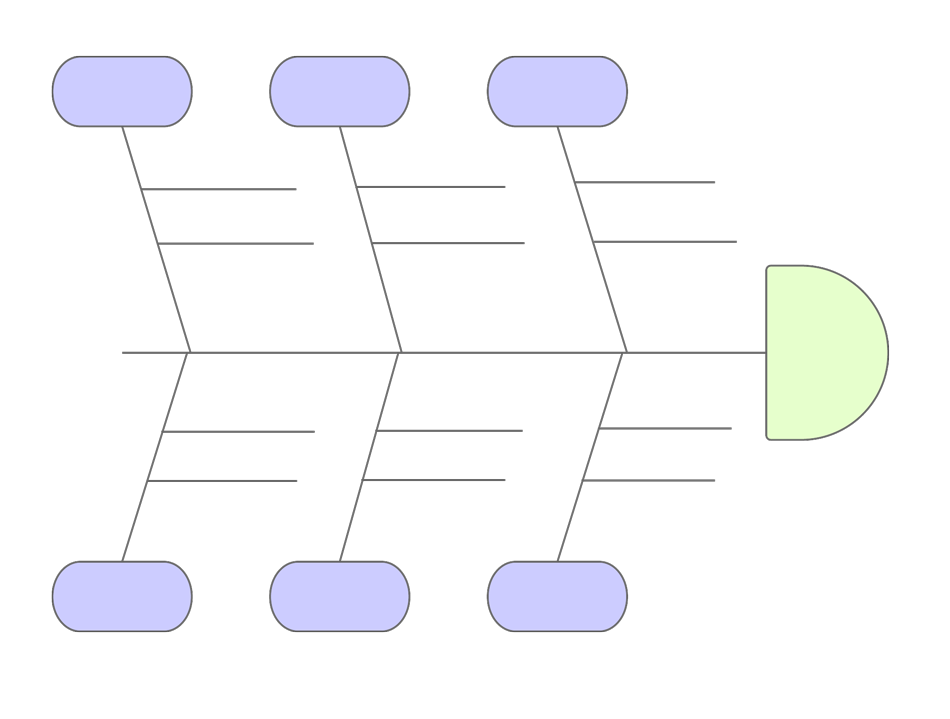
5. The first thing you need for your fishbone diagram is a problem statement. Since fishbone diagrams are used to analyze cause-and-effect relationships, the problem statement is your final effect or result. Drag out a box from the toolbox in Lucidchart (it’s accessible from the left side of the screen), then double-click to label it accordingly. Depending on your industry and use case, the problem could be anything from “shipments arrive late” to “patient readmitted to the hospital.” Once you have the problem statement, draw a line out from it. Your line will be shorter or longer depending on how many categories you want to include.

List categories
6. Next, you’ll add lines and corresponding boxes to show the categories of causes for your problem statement. It might be helpful here to think backwards. First, determine all the potential causes for a problem, and then group them into categories. The traditional categories for a fishbone diagram are the six M's:
- Machines
- Methods
- Materials
- Measurements
- Mother Nature
- Manpower
If you’re not sure what to include, these categories are a great first step. You are also free to choose your own, more specific categories, depending on what best fits your diagram.
Add causes
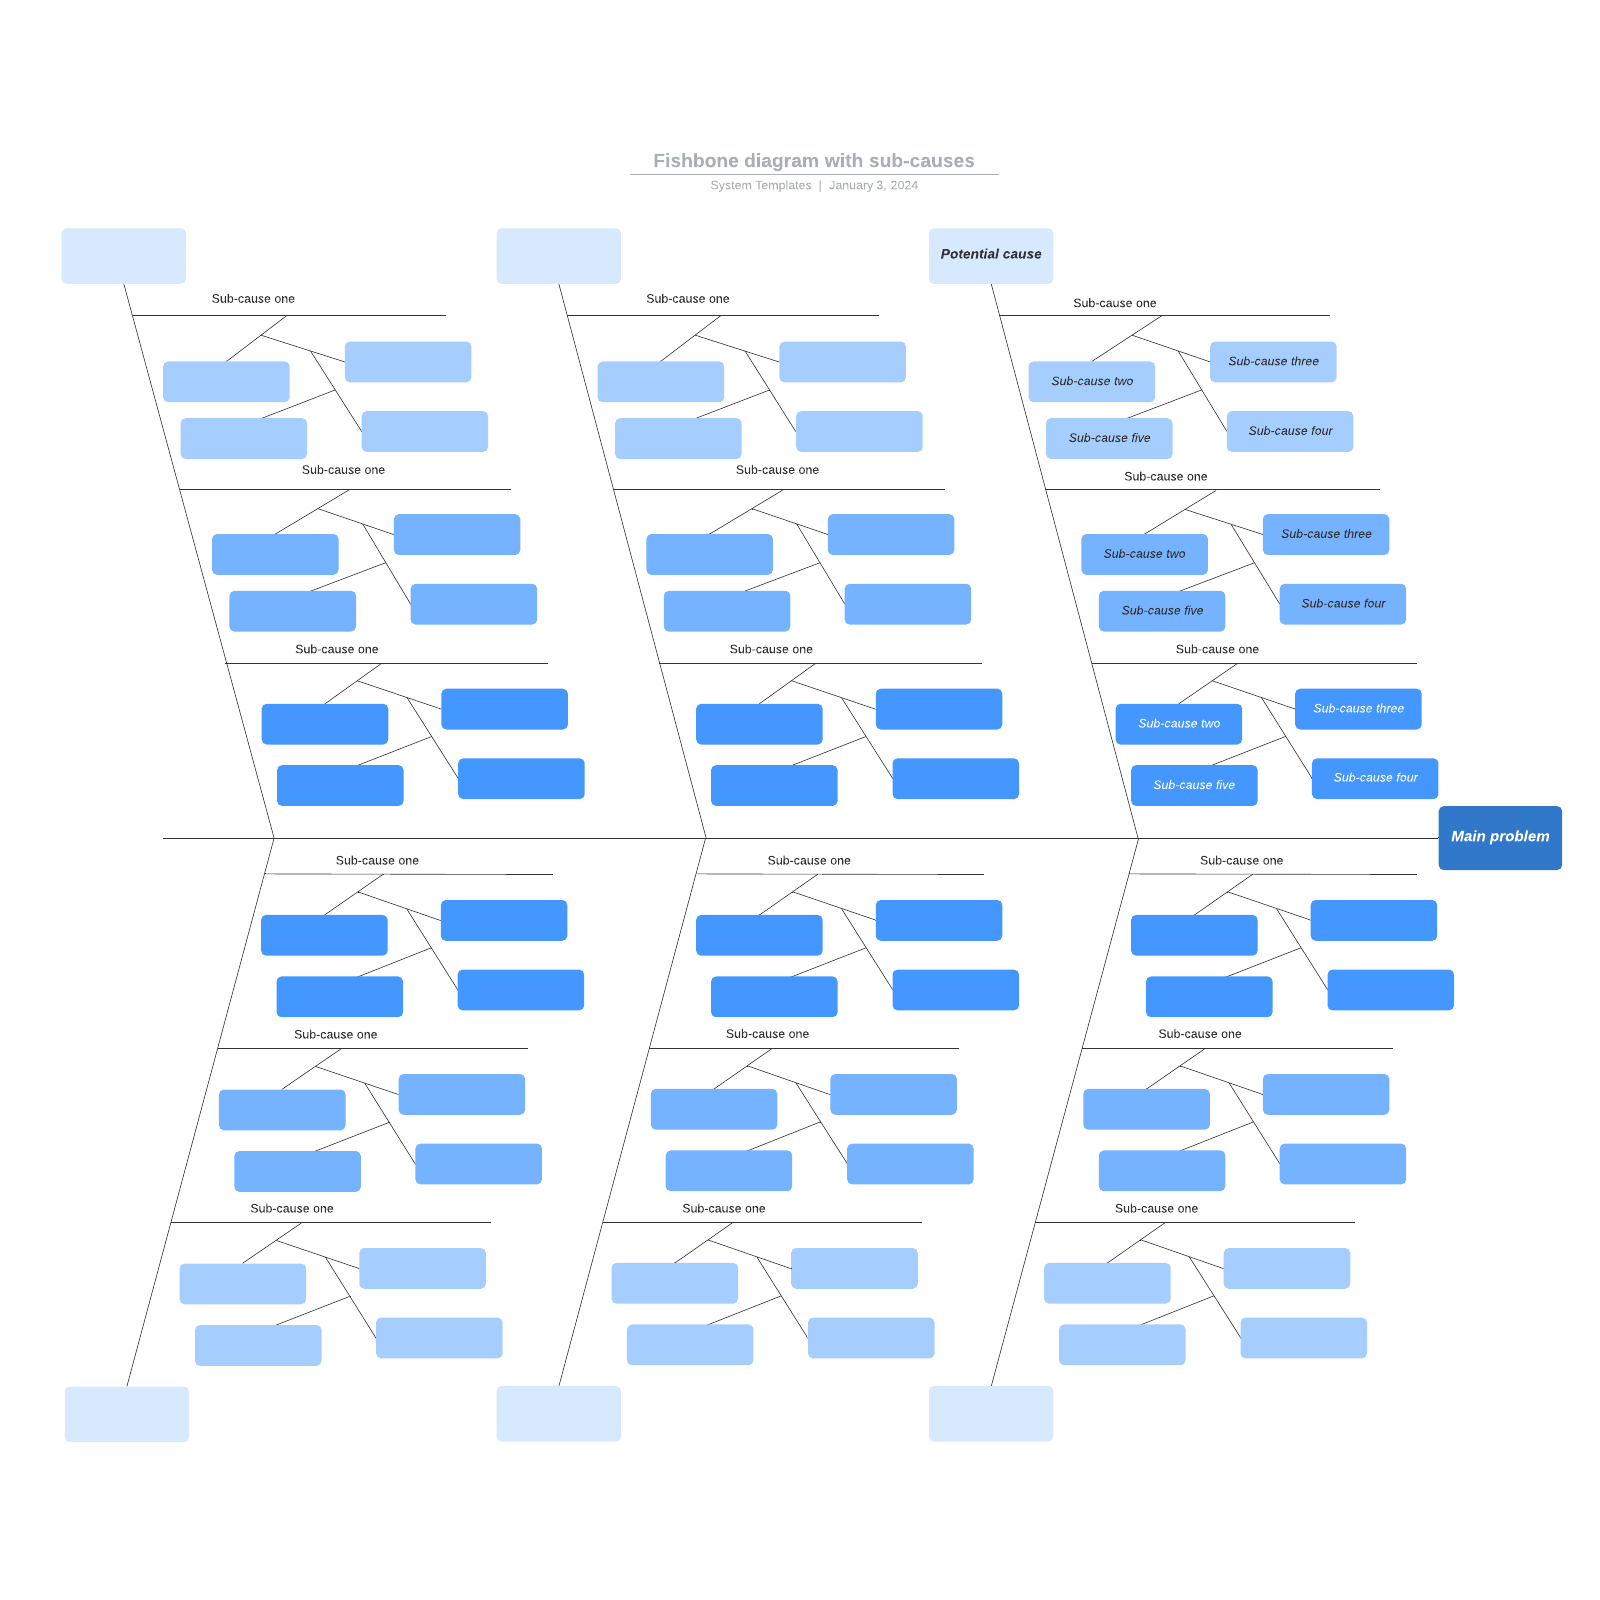
7. To add causes, draw new lines from the category lines and label them with text boxes. To draw a line without dragging it out from a shape, simply hold down the L key and crosshairs will appear. Click on any line again to angle it or rotate it. Remember to add as many causes as you can think of, even if some of them are less likely to occur than others. The more details you have, the easier it will be to analyze your problem.
Review your work
After you’ve completed the document, it’s time to review. Make sure your text is error-free and large enough to read. Did you include all relevant information, and is it organized under the right categories? Try sending a URL to a colleague and inviting them to comment or collaborate with you.
Make a fishbone diagram in Lucidchart
You can make your own fishbone diagram with Lucidchart. To design the skeleton, simply use the line tool by clicking the "L" key. A crosshair will appear and let you draw a line. Easily add lines to the template below, and then drag out text boxes onto the lines to properly label them. Lucidchart also supports a variety of convenient features that make diagramming easy, like draggable resizing, pop-out context menus, and custom image upload. And once you’ve finished perfecting your diagram, you can share or publish it online.
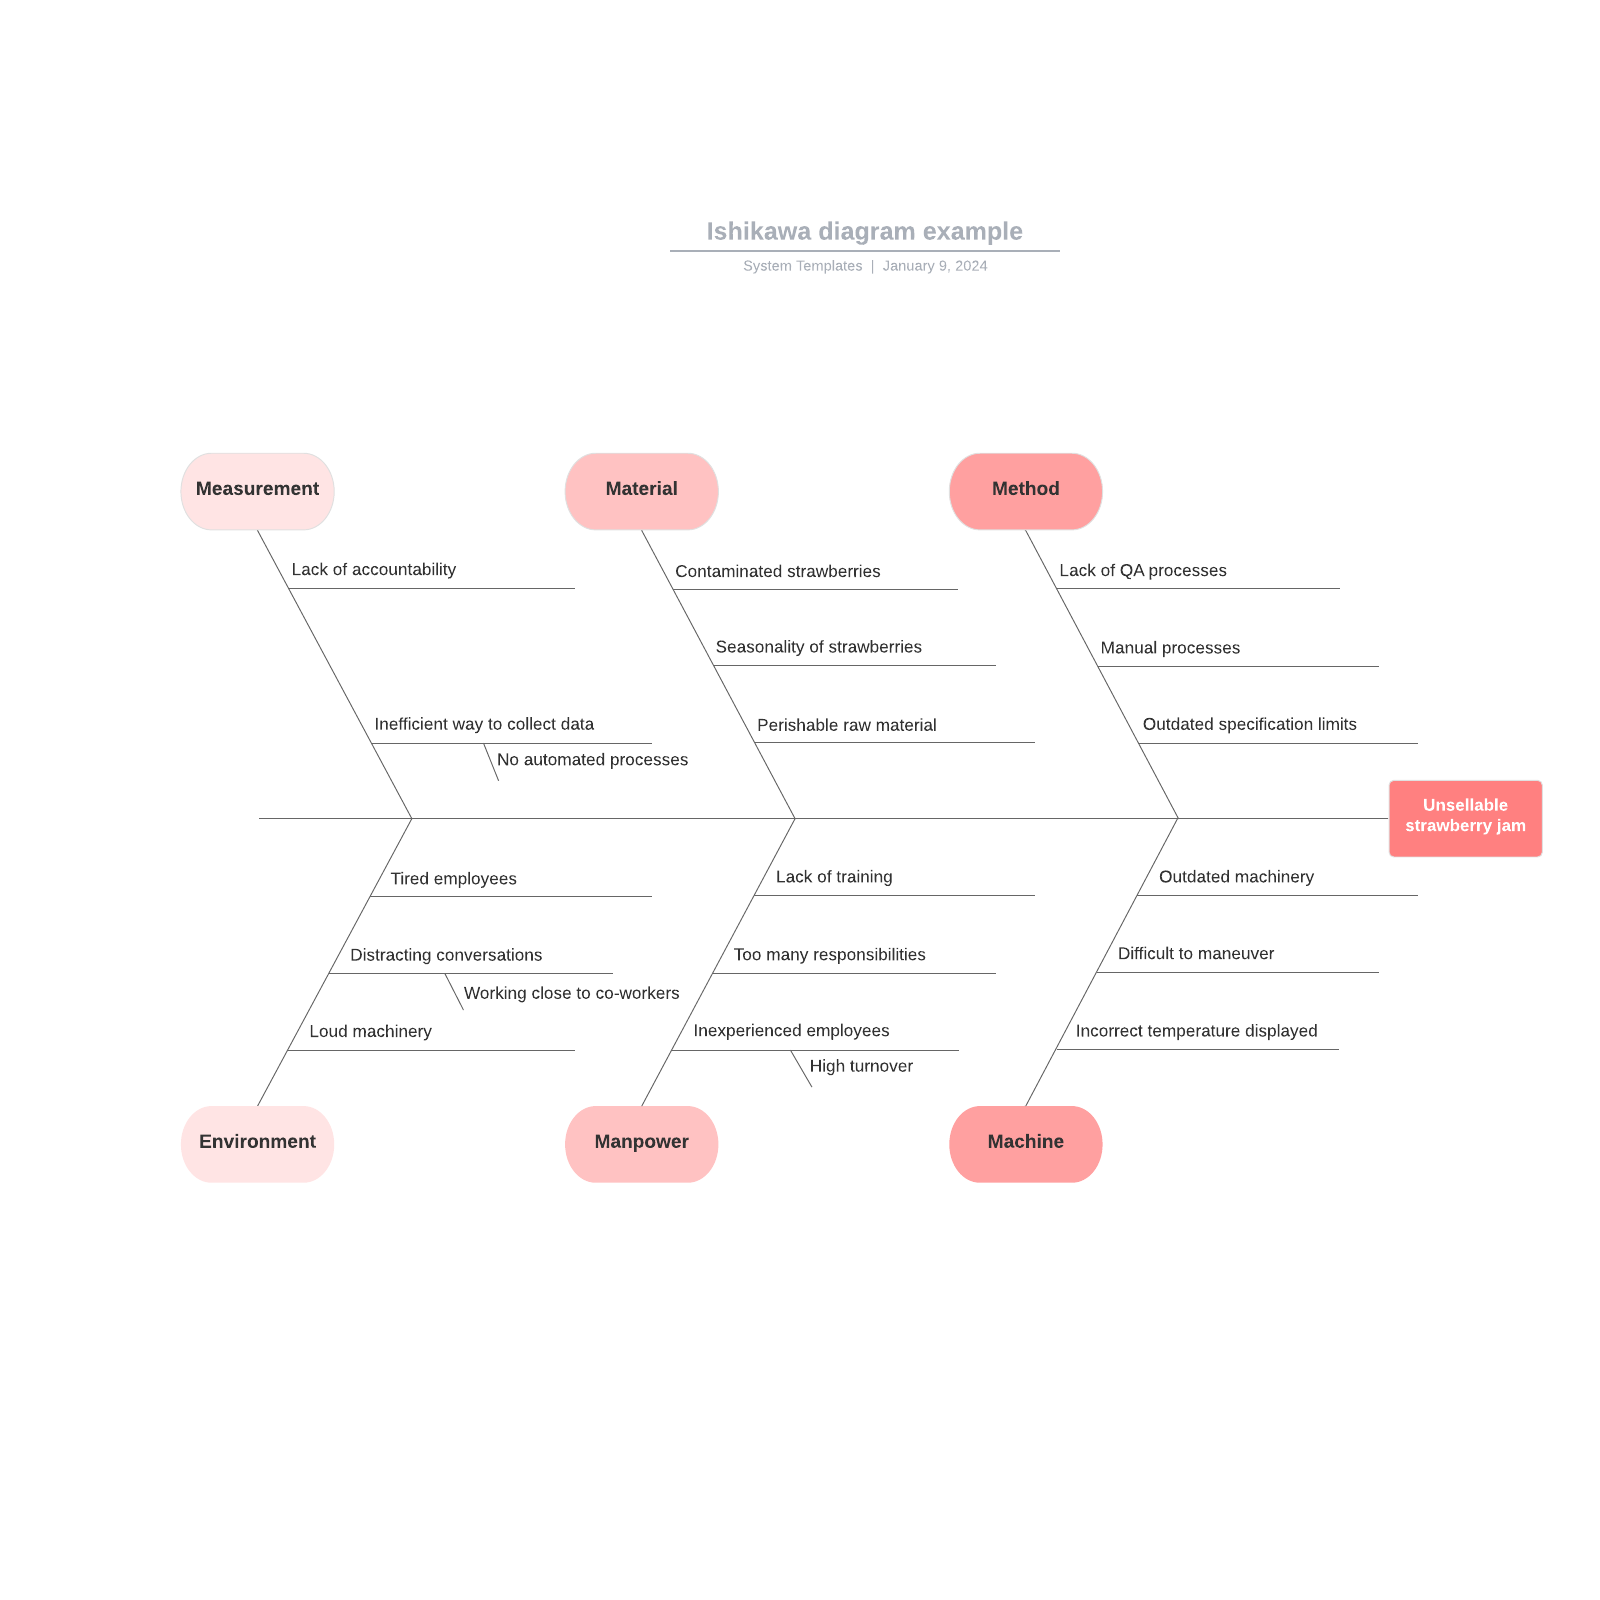
What is a cause and effect analysis?
A cause and effect diagram is also known as a fishbone diagram due to its appearance. Cause and effect analysis can be used in a wide variety of industries, including engineering, marketing, and manufacturing. It was invented by Kaoru Ishikawa as a way to pinpoint contributing factors in business problems, especially in the field of industrial manufacturing. When conducting cause and effect analysis, teams start with a problem or challenge, then look at which roadblocks stand in the way of success.
Compatible with Microsoft Visio
If you’re concerned about choosing Lucidchart over Visio, rest assured that our program is fully Visio-compatible. As the best Visio alternative, you can open nearly any Visio file that’s sent to you with Lucidchart’s Visio import option, which is free for everyone. With a Pro account, you can also edit the document or export a Lucidchart document to .vdx format. You’ll never regret switching to Lucidchart: it’s more affordable, easier to use, and built for true collaboration.
How to add a fishbone diagram in Excel
1. Download the MS Office Add-On if you haven’t already
2. Use a template like the one below or create a new fishbone diagram in Lucidchart.Use this guide to learn how to make a flowchart in Lucidchart if you need help getting started.
3. Open your Excel sheet, go to your Lucidchart Add-In.
4. Select your diagram from your list of Lucidchart documents and insert it into your Excel sheet.
If you want to learn more about creating fishbones with Lucidchart, check out our in-depth tutorial. If you’d like another free fishbone template, try our fishbone example page. It’s easy to make these diagrams your own; simply drag and drop elements to rearrange them. Several types of images, including JPGs, PNGs, and SVGs, can be uploaded for even more customization.