How to make a fishbone diagram in PowerPoint
1. Locate PowerPoint’s shape library
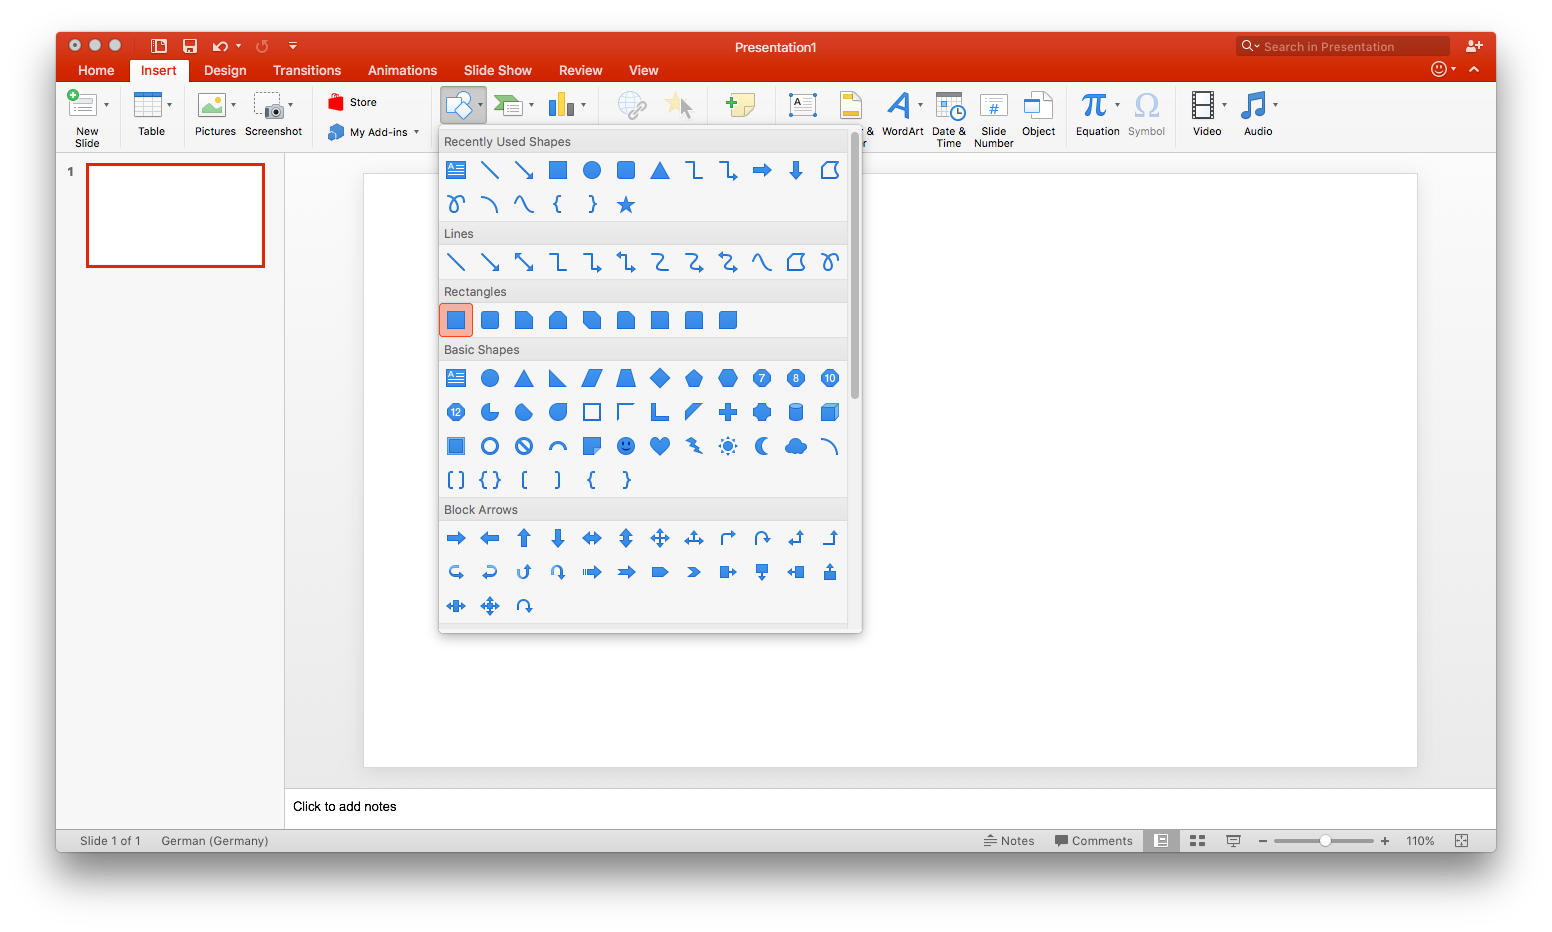
PowerPoint doesn’t offer any fishbone diagram templates, so you’ll have to start from scratch. All of the shapes that you’ll need can be found in PowerPoint’s shape library, located on the insert tab. Click “Shapes” to open the library.
To insert a shape or line, select it from the drop-down library, then click and drag your cursor to draw it on your slide.
2. Draw the “head” and “spine” of your diagram
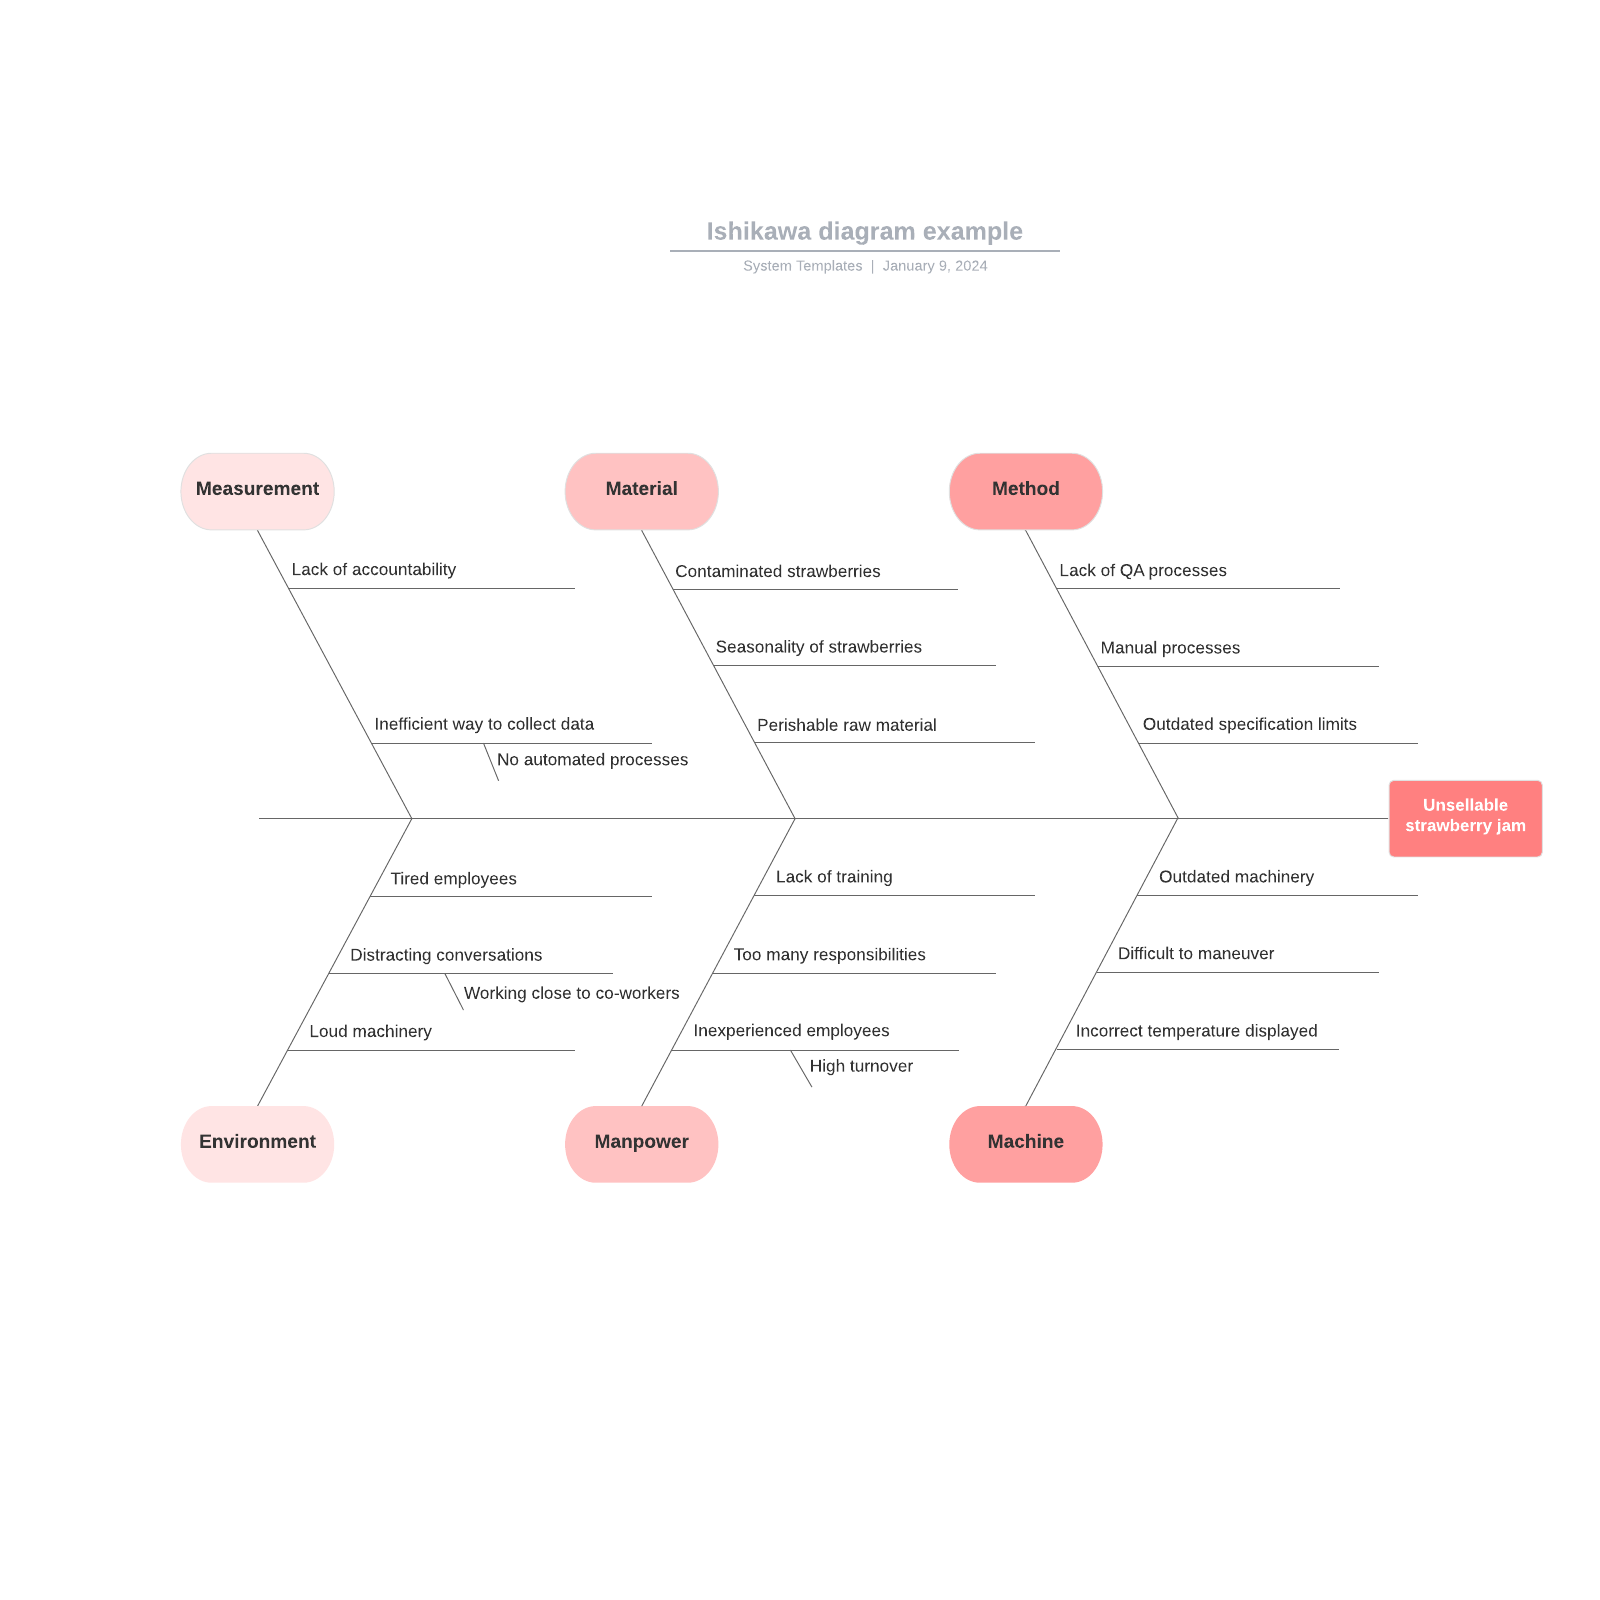
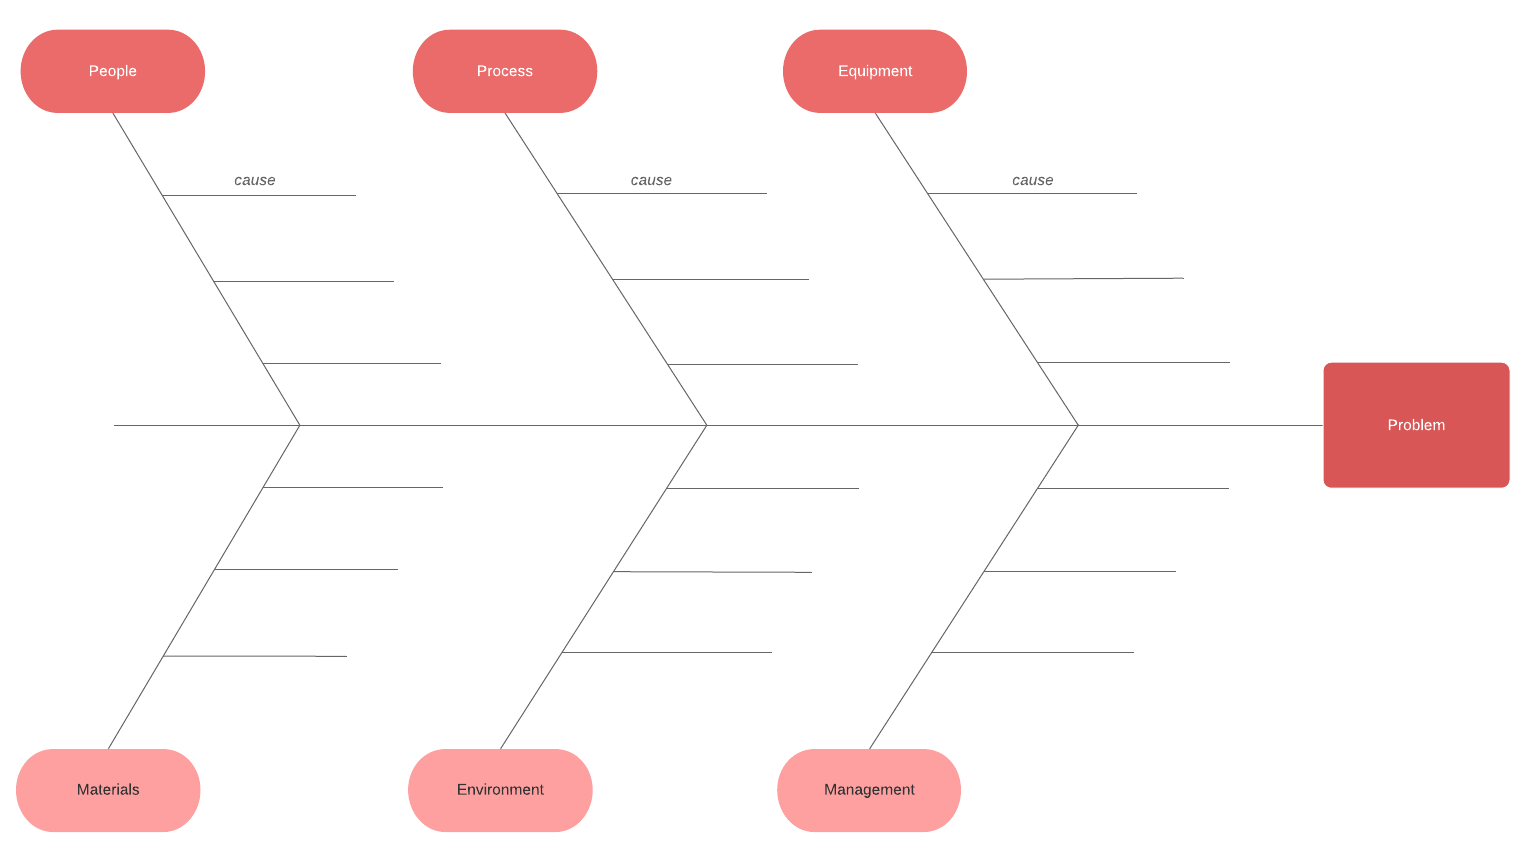
Fishbone diagrams are named for their shape, which resembles a fish skeleton, and each element of the diagram is named accordingly.
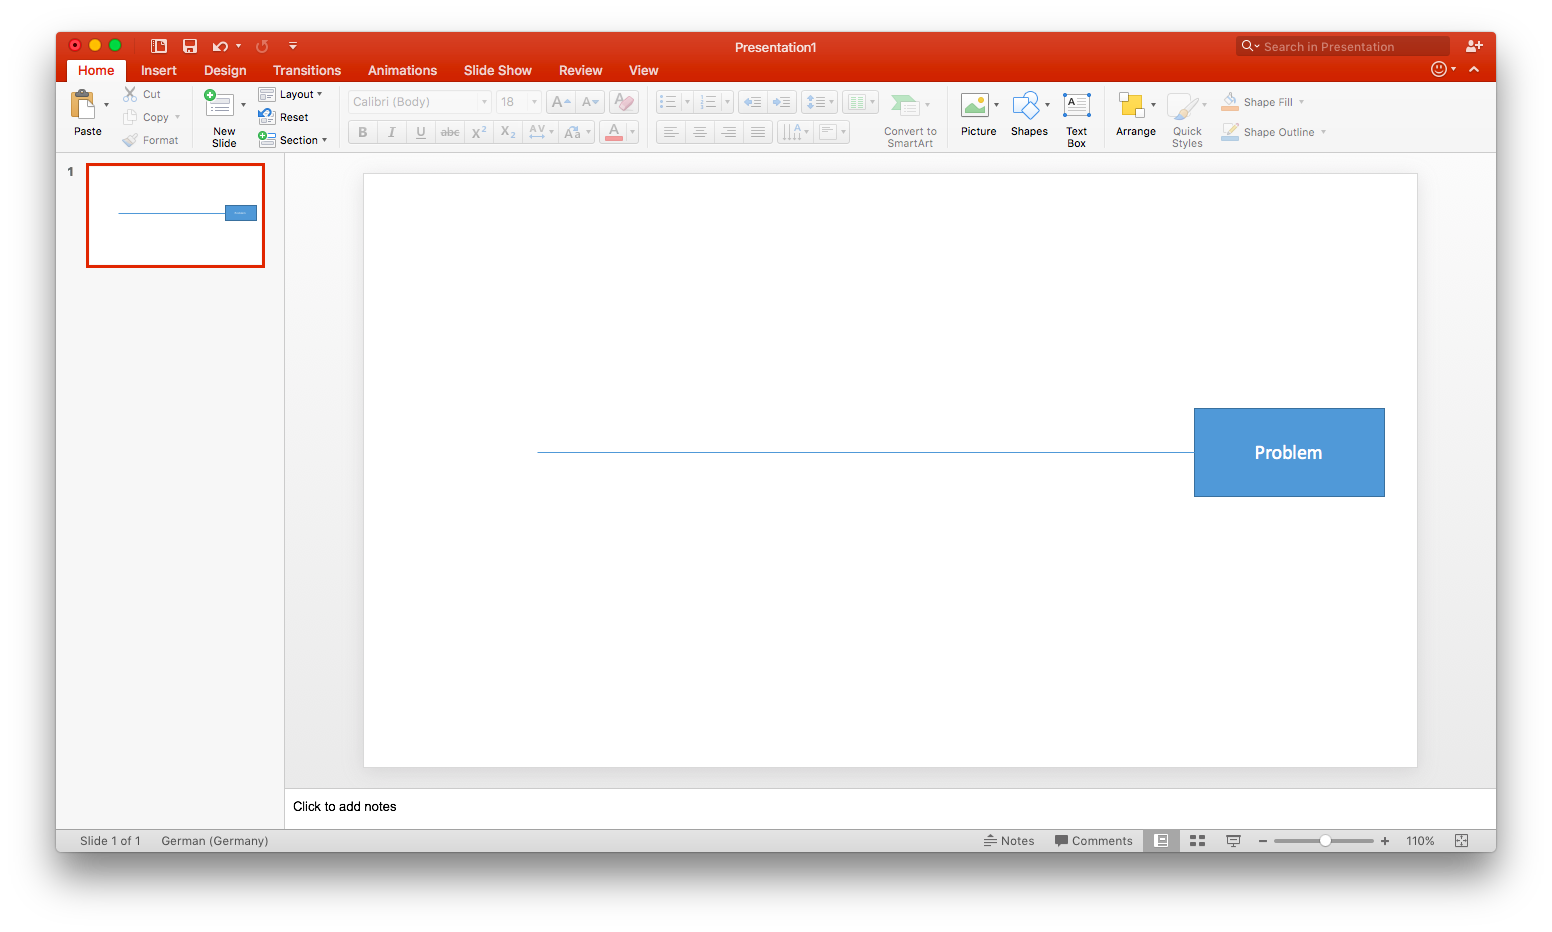
The head of a fishbone diagram—the rightmost rectangle—contains the diagram’s central problem statement. Select a rectangle from the shape library and add it to the right side of your slide. Single-click the rectangle and begin typing to add text (for now, you can simply type “Problem” as a placeholder).
Once you’ve added the head, draw a horizontal line extending out from it to the left—this is your diagram’s spine.
3. Add causes and subcauses
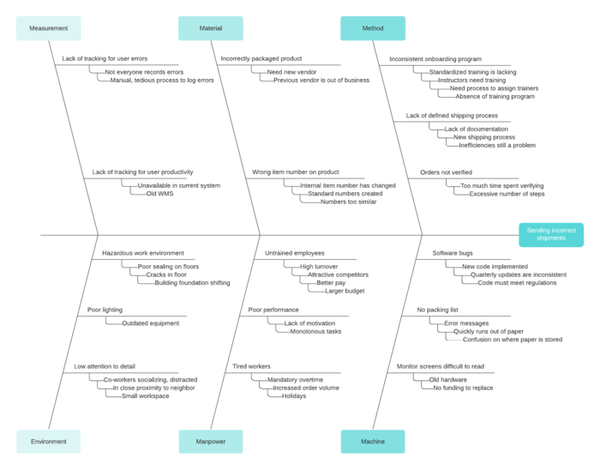
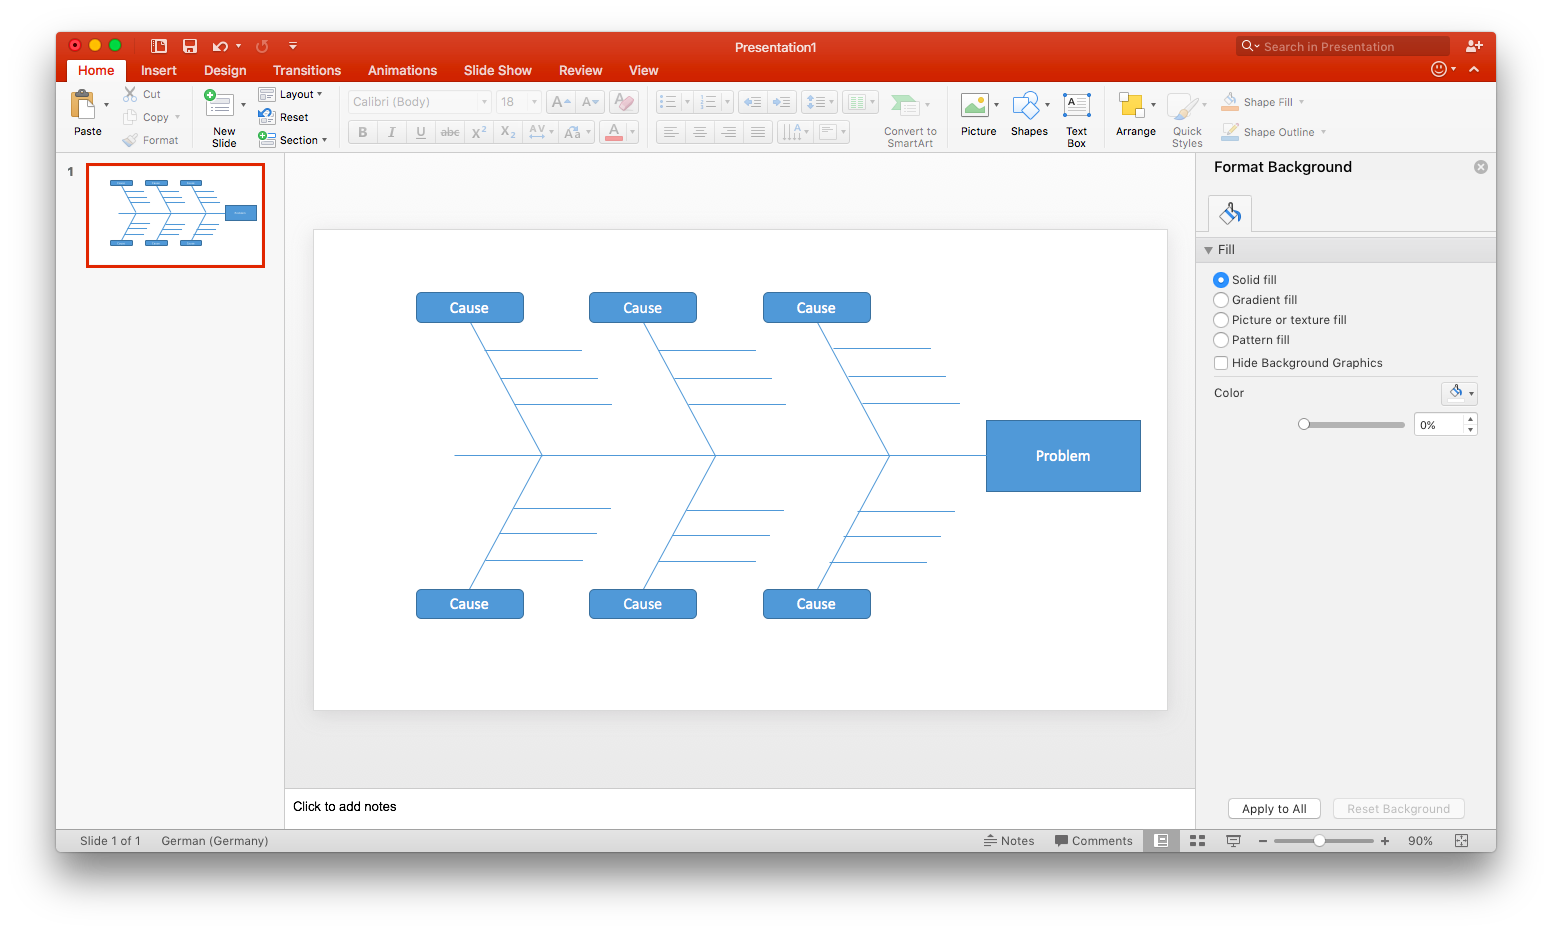
Next, draw additional lines extending from the center line at an angle. (These are the “ribs” of the skeleton.) Each of these lines represents a cause contributing to your problem statement. Typically, a fishbone diagram includes six of these cause lines.
At the tip of each line, add a small rectangle—these will serve as labels. Single-click the rectangle and begin typing to add text. As before, simply use a generic placeholder for now.
Add horizontal lines (two to three, depending on your need) extending from each cause line. These lines represent subcauses.
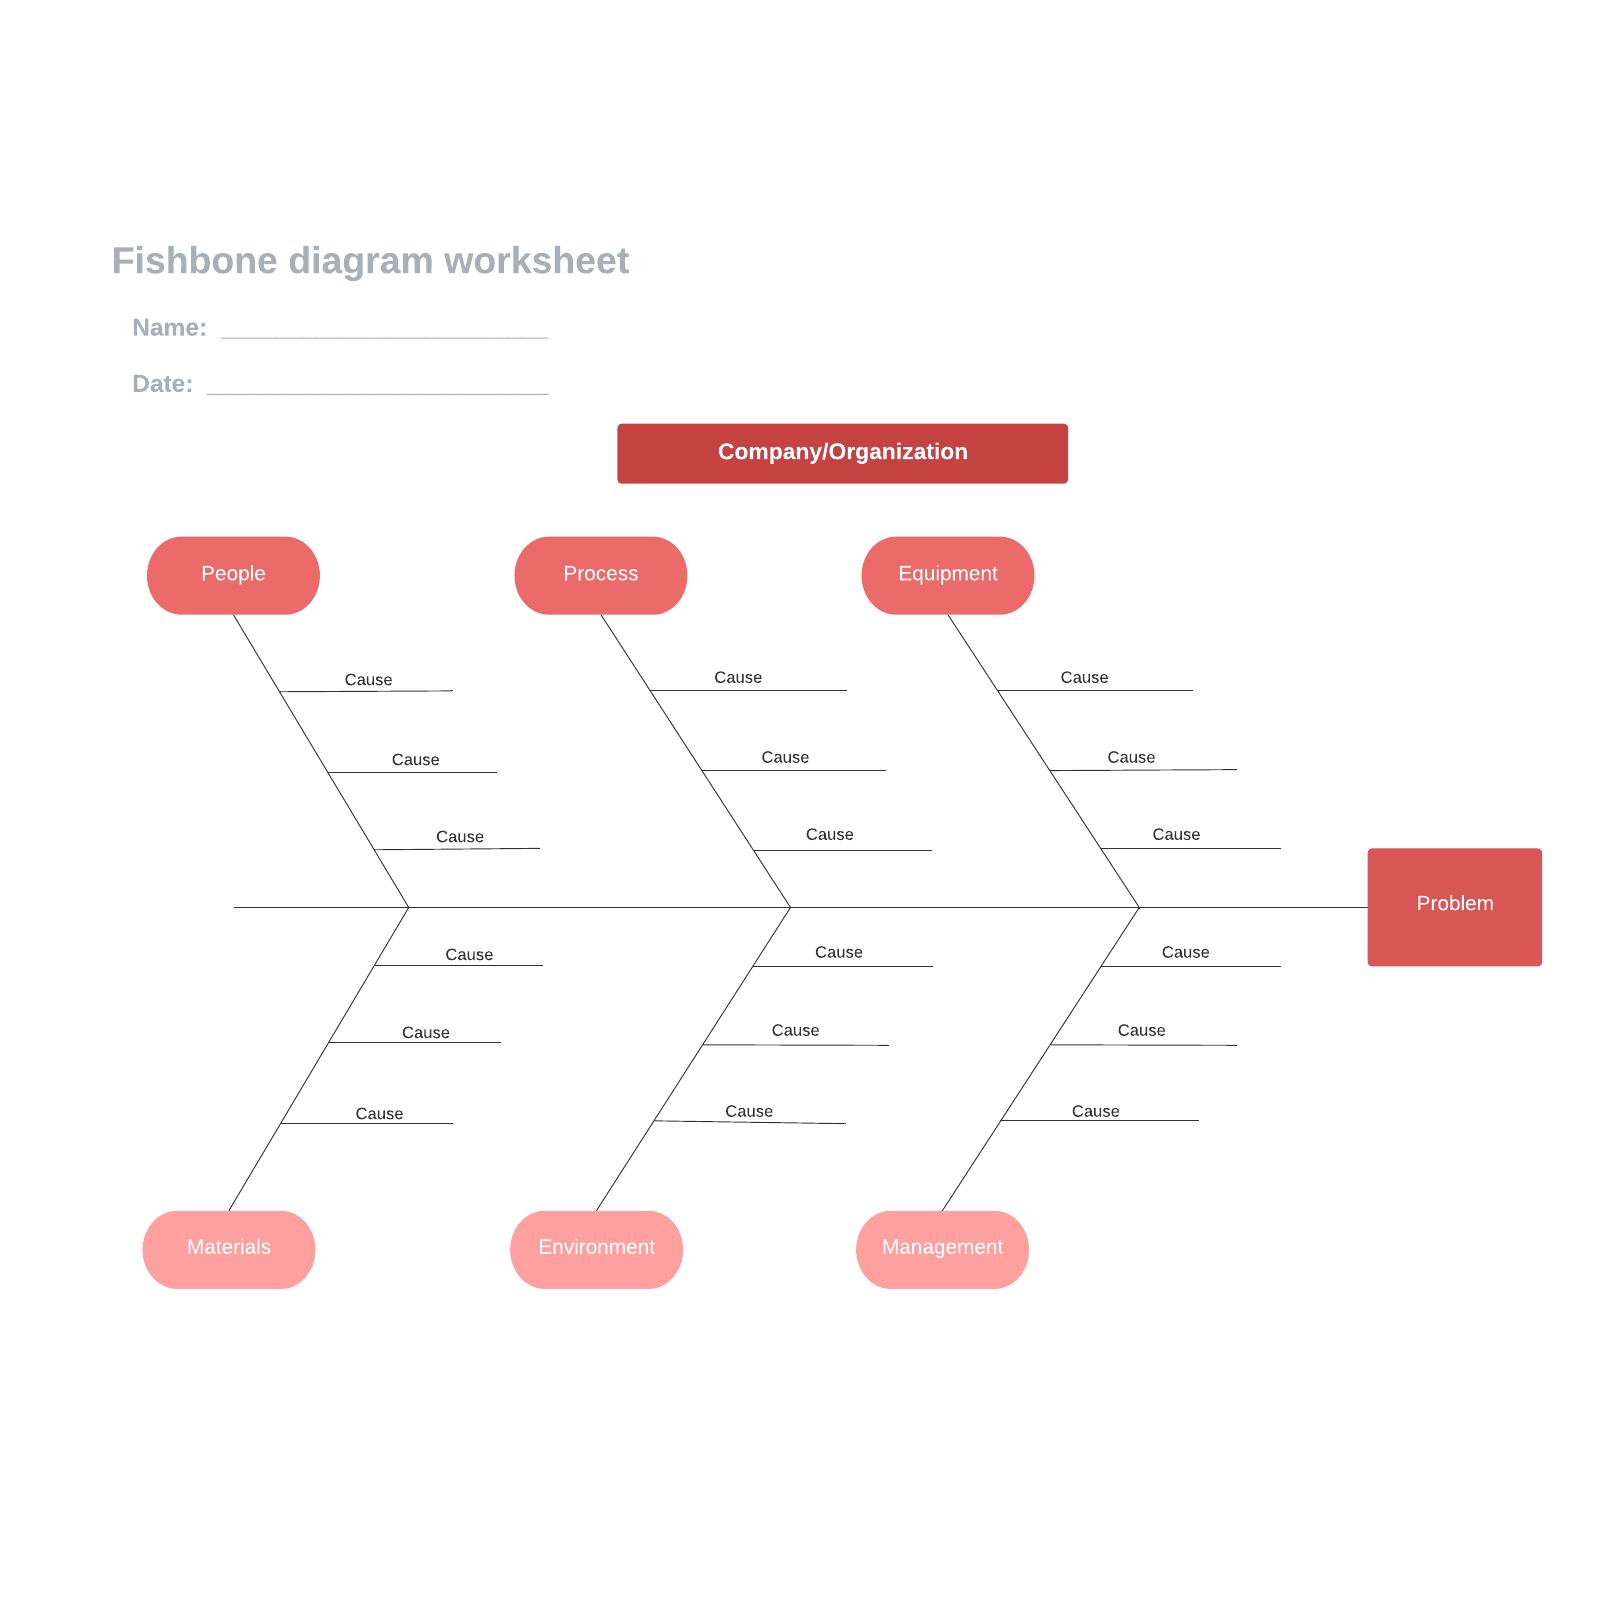
At this point, the structure of your fishbone diagram is complete. If you’d like to leave it blank to print or save as a template, save your PowerPoint as is—you can go ahead and skip the remaining steps.
4. Label your diagram
Now that you’ve finished the structure of your diagram, it’s time to tailor it to the problem you are addressing. Replace any text placeholders with actual content—this includes your specific problem statement, as well as contributing causes.
To label your subcauses, you’ll need to add text boxes. On the home tab, select “Text Box.” Click and drag to draw and size the text box. Position these labels over each subcause line. (Tip: Once you’ve added one text box, you can save time by using copy and paste to add more.)
5. Format and style your diagram
As you add shapes to your document, they are styled according to Microsoft’s presets. If you’re happy with the way your diagram looks, you can save it and skip this step.
To adjust the fill color, opacity, or other stylistic aspects of a shape, double-click it. This opens the shape formatting pane. Hold Shift as you click on shapes to select multiple—this way they can be edited simultaneously. Adjust the visual elements of your diagram until you’re satisfied with its look. Once you’ve finished, you’re ready to save your completed fishbone diagram!
Master the basics of Lucidchart in 3 minutes
- Create your first diagram from a template or blank canvas or import a document.
- Add text, shapes, and lines to customize your diagram.
- Learn how to adjust styling and formatting.
- Locate what you need with Feature Find.
- Share your diagram with your team to start collaborating.
How to add a Lucidchart fishbone diagram in PowerPoint
Follow the steps below to add your Lucidchart fishbone diagram to your PowerPoint slide.
1. Install the Lucidchart add-in
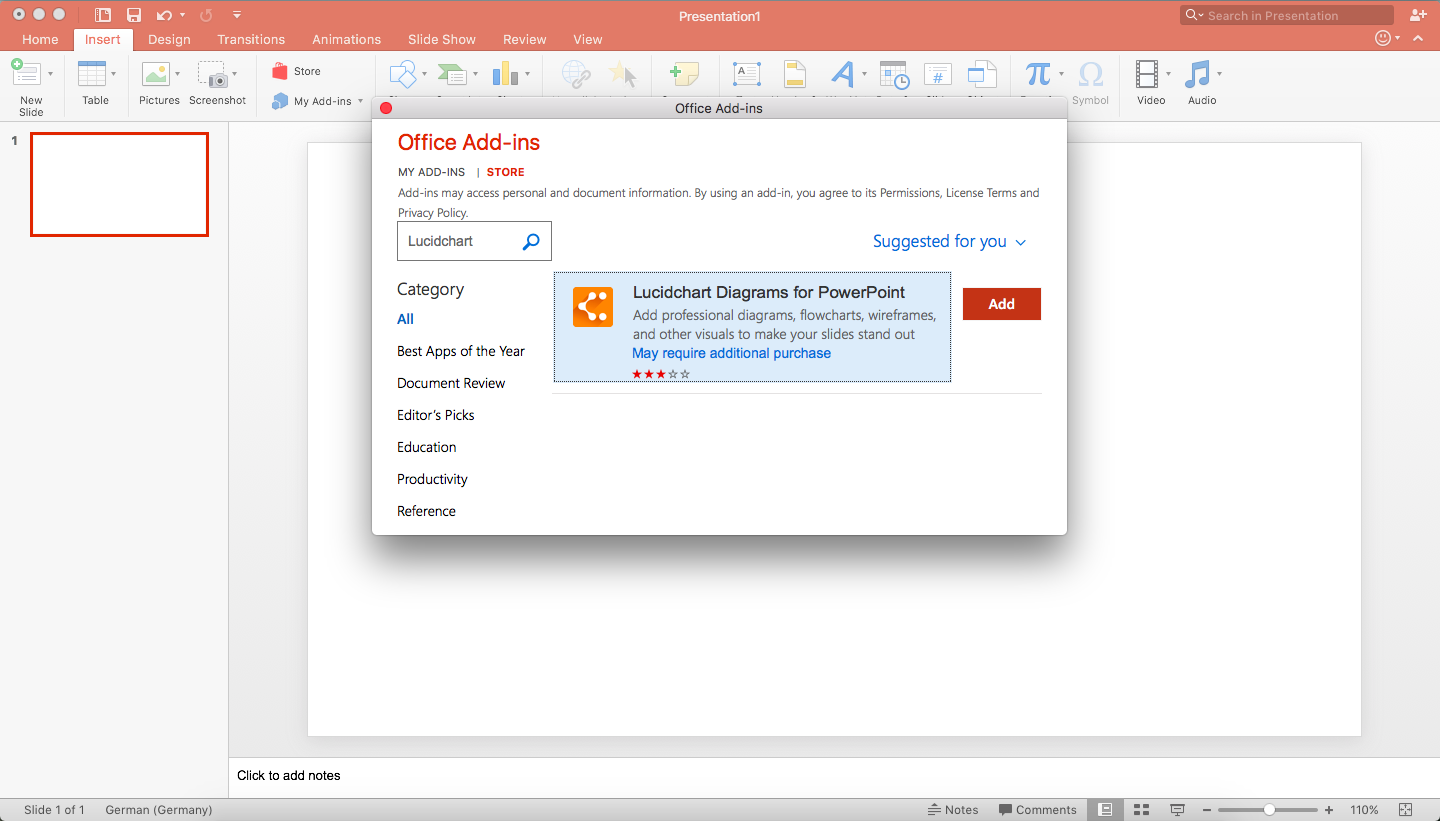
Installing the add-in takes only a few clicks! Open PowerPoint and go to Insert > My Add-ins > Store. Type “Lucidchart” in the search bar and click “Add.”
If the Lucidchart add-in doesn’t open when you download it, don’t worry. Simply go to Insert > My Add-ins > Lucidchart. (You may be prompted to enter your Lucidchart login info—once logged in, you can view all of your Lucidchart documents.)
2. Select a diagram to add to your PowerPoint slide
With the Lucidchart add-in open, you can view all of your Lucidchart documents in PowerPoint. To insert a diagram, hover your mouse over the diagram you wish to add and click “Select” to add the diagram to the current slide.
If you edit the diagram after inserting it, simply click the refresh icon (located on the toolbar below the inserted diagram), and any changes will be applied.
For more info on how to use the Lucidchart add-in, watch our video tutorial.
If you’re struggling to make a fishbone diagram in any MS Office programs, Lucidchart can help. Just like with PowerPoint, you can import diagrams into MS Word and Excel with the Lucidchart add-in—it’s quick, easy, and free!
How to create a fishbone diagram in Lucidchart from a template
With Lucidchart, a modern visual workspace, creating even the most complex diagrams is a straightforward, seamless process. Whether you choose to use one of our fishbone templates or start from scratch, you’ll have a polished fishbone diagram in no time! You can then easily add your fishbone diagram to your PowerPoint presentation—but more on that later.
Before getting started in Lucidchart, you’ll need to register for a Lucidchart account. Don’t worry—it’s quick, easy, and free!
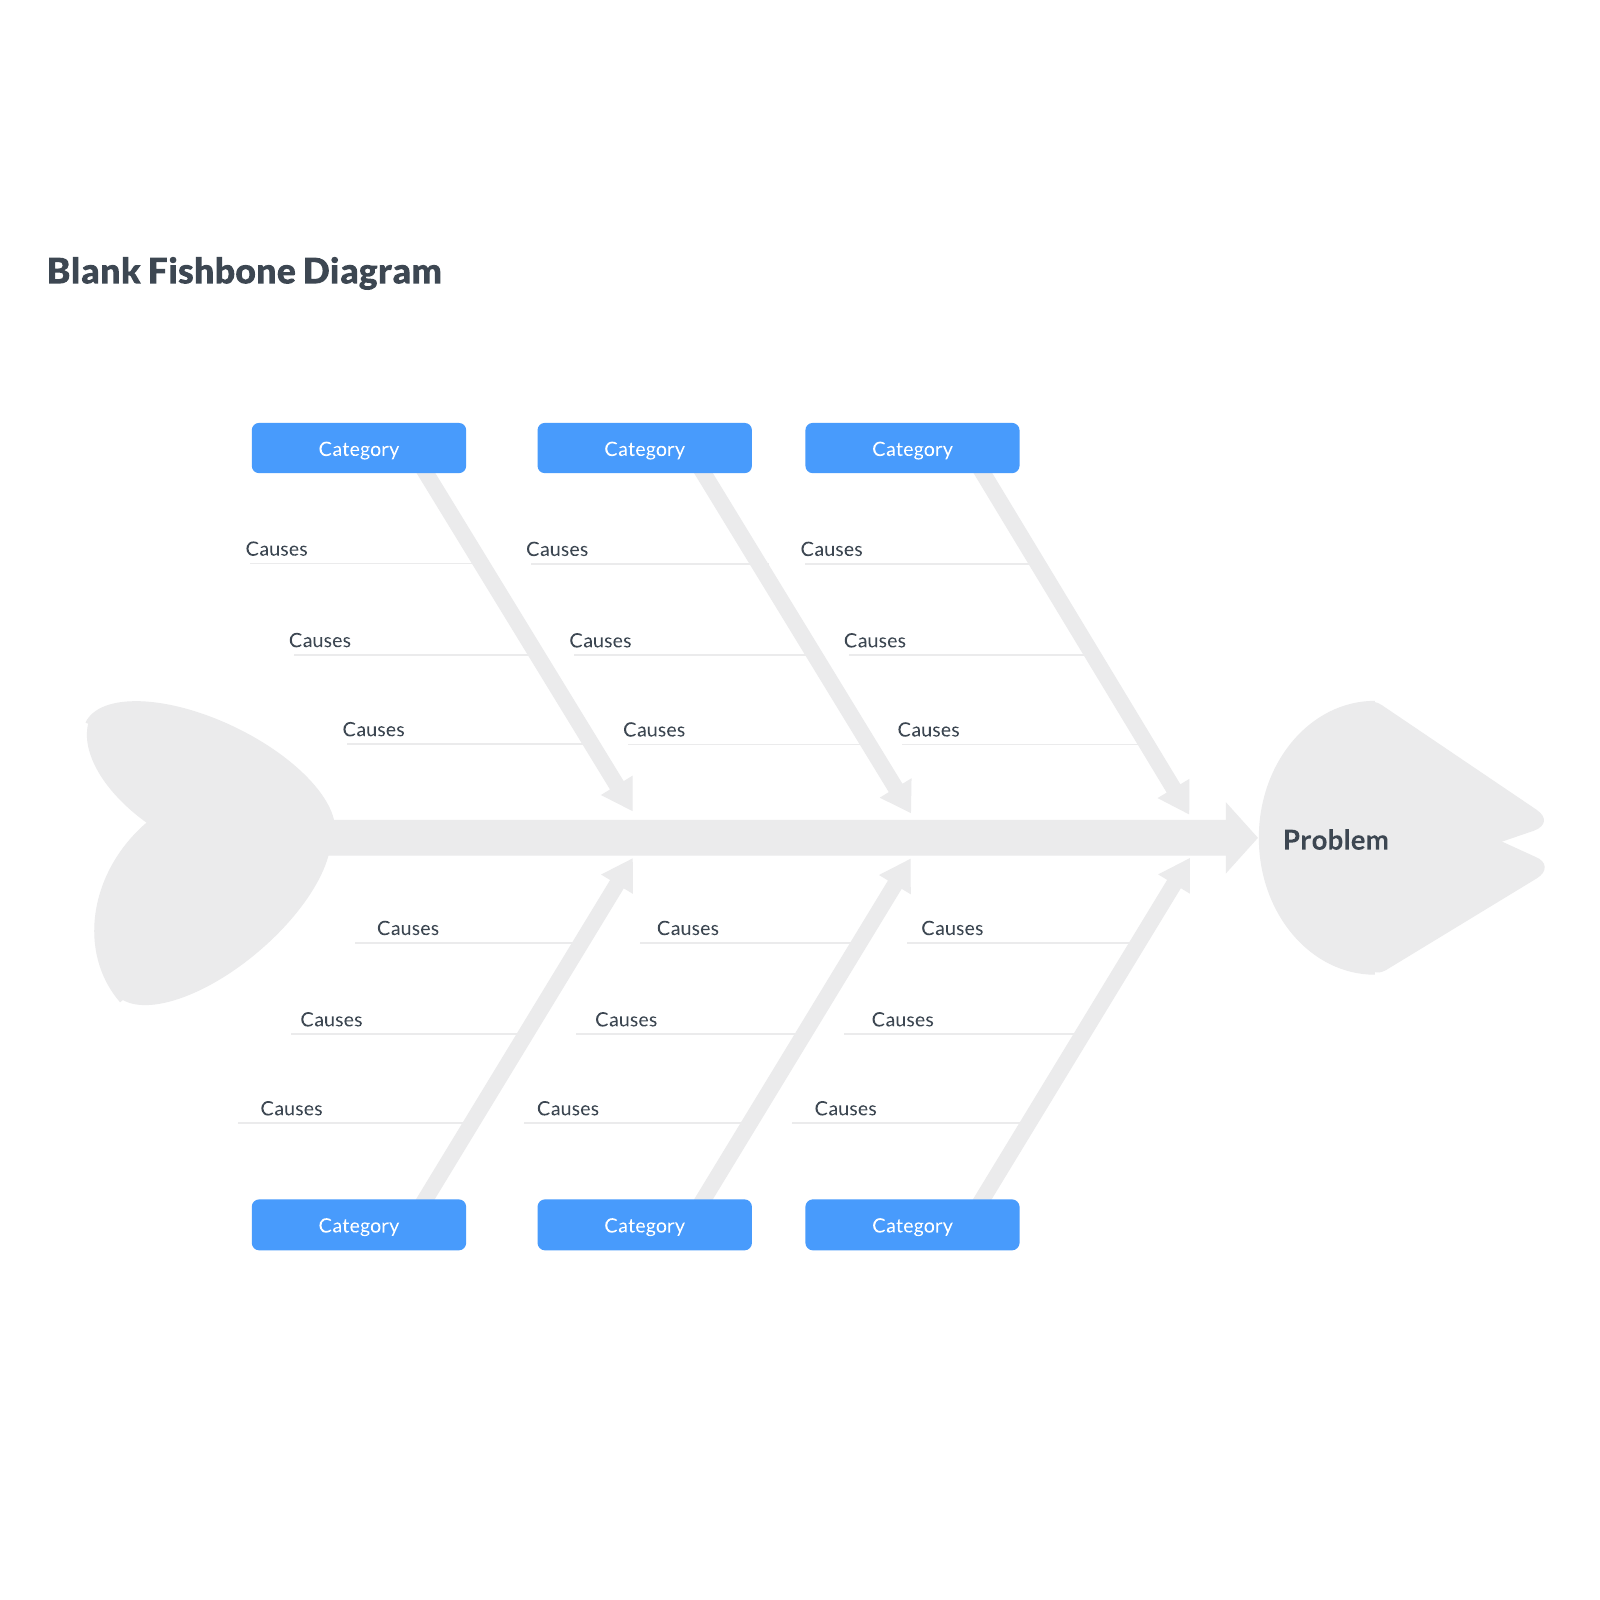
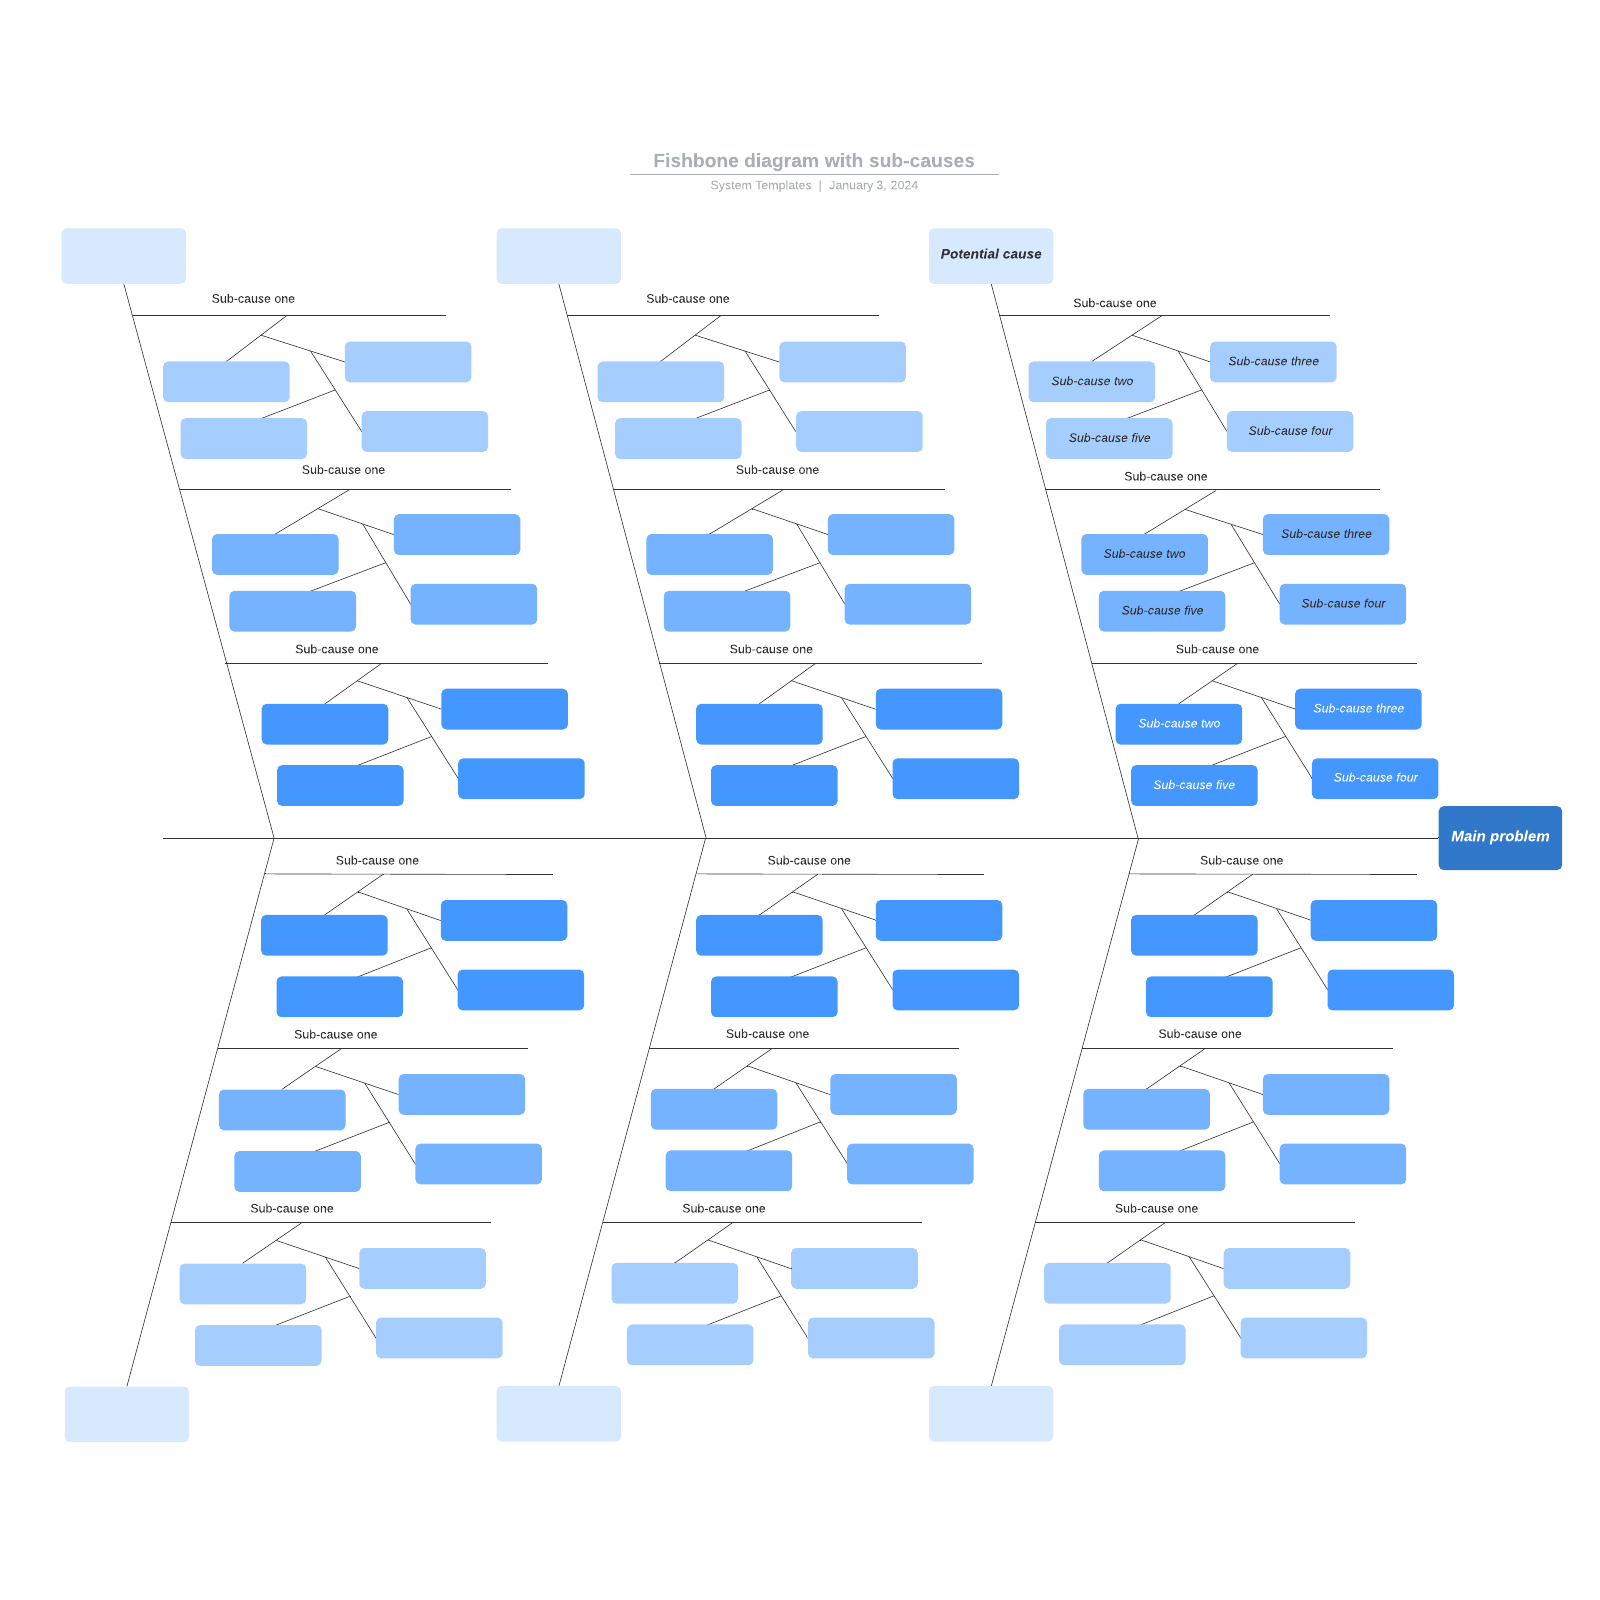
1. Choose a fishbone template
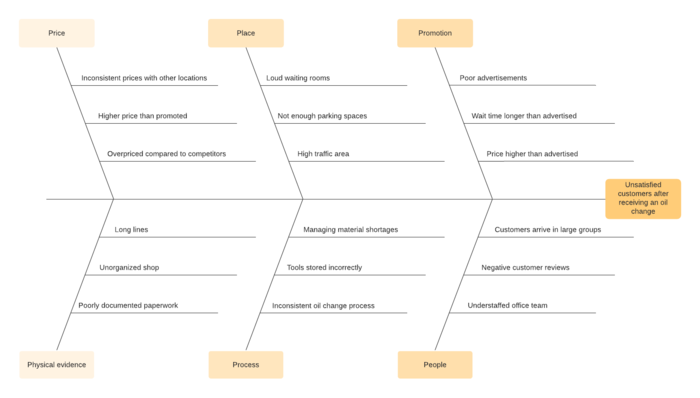
To open Lucidchart’s template library, click the down arrow next to “+Document.” Type “fishbone” into the search bar and press “Enter.” Lucidchart offers a number of fishbone templates of varying complexity (some may be called Ishikawa or cause and effect diagrams).
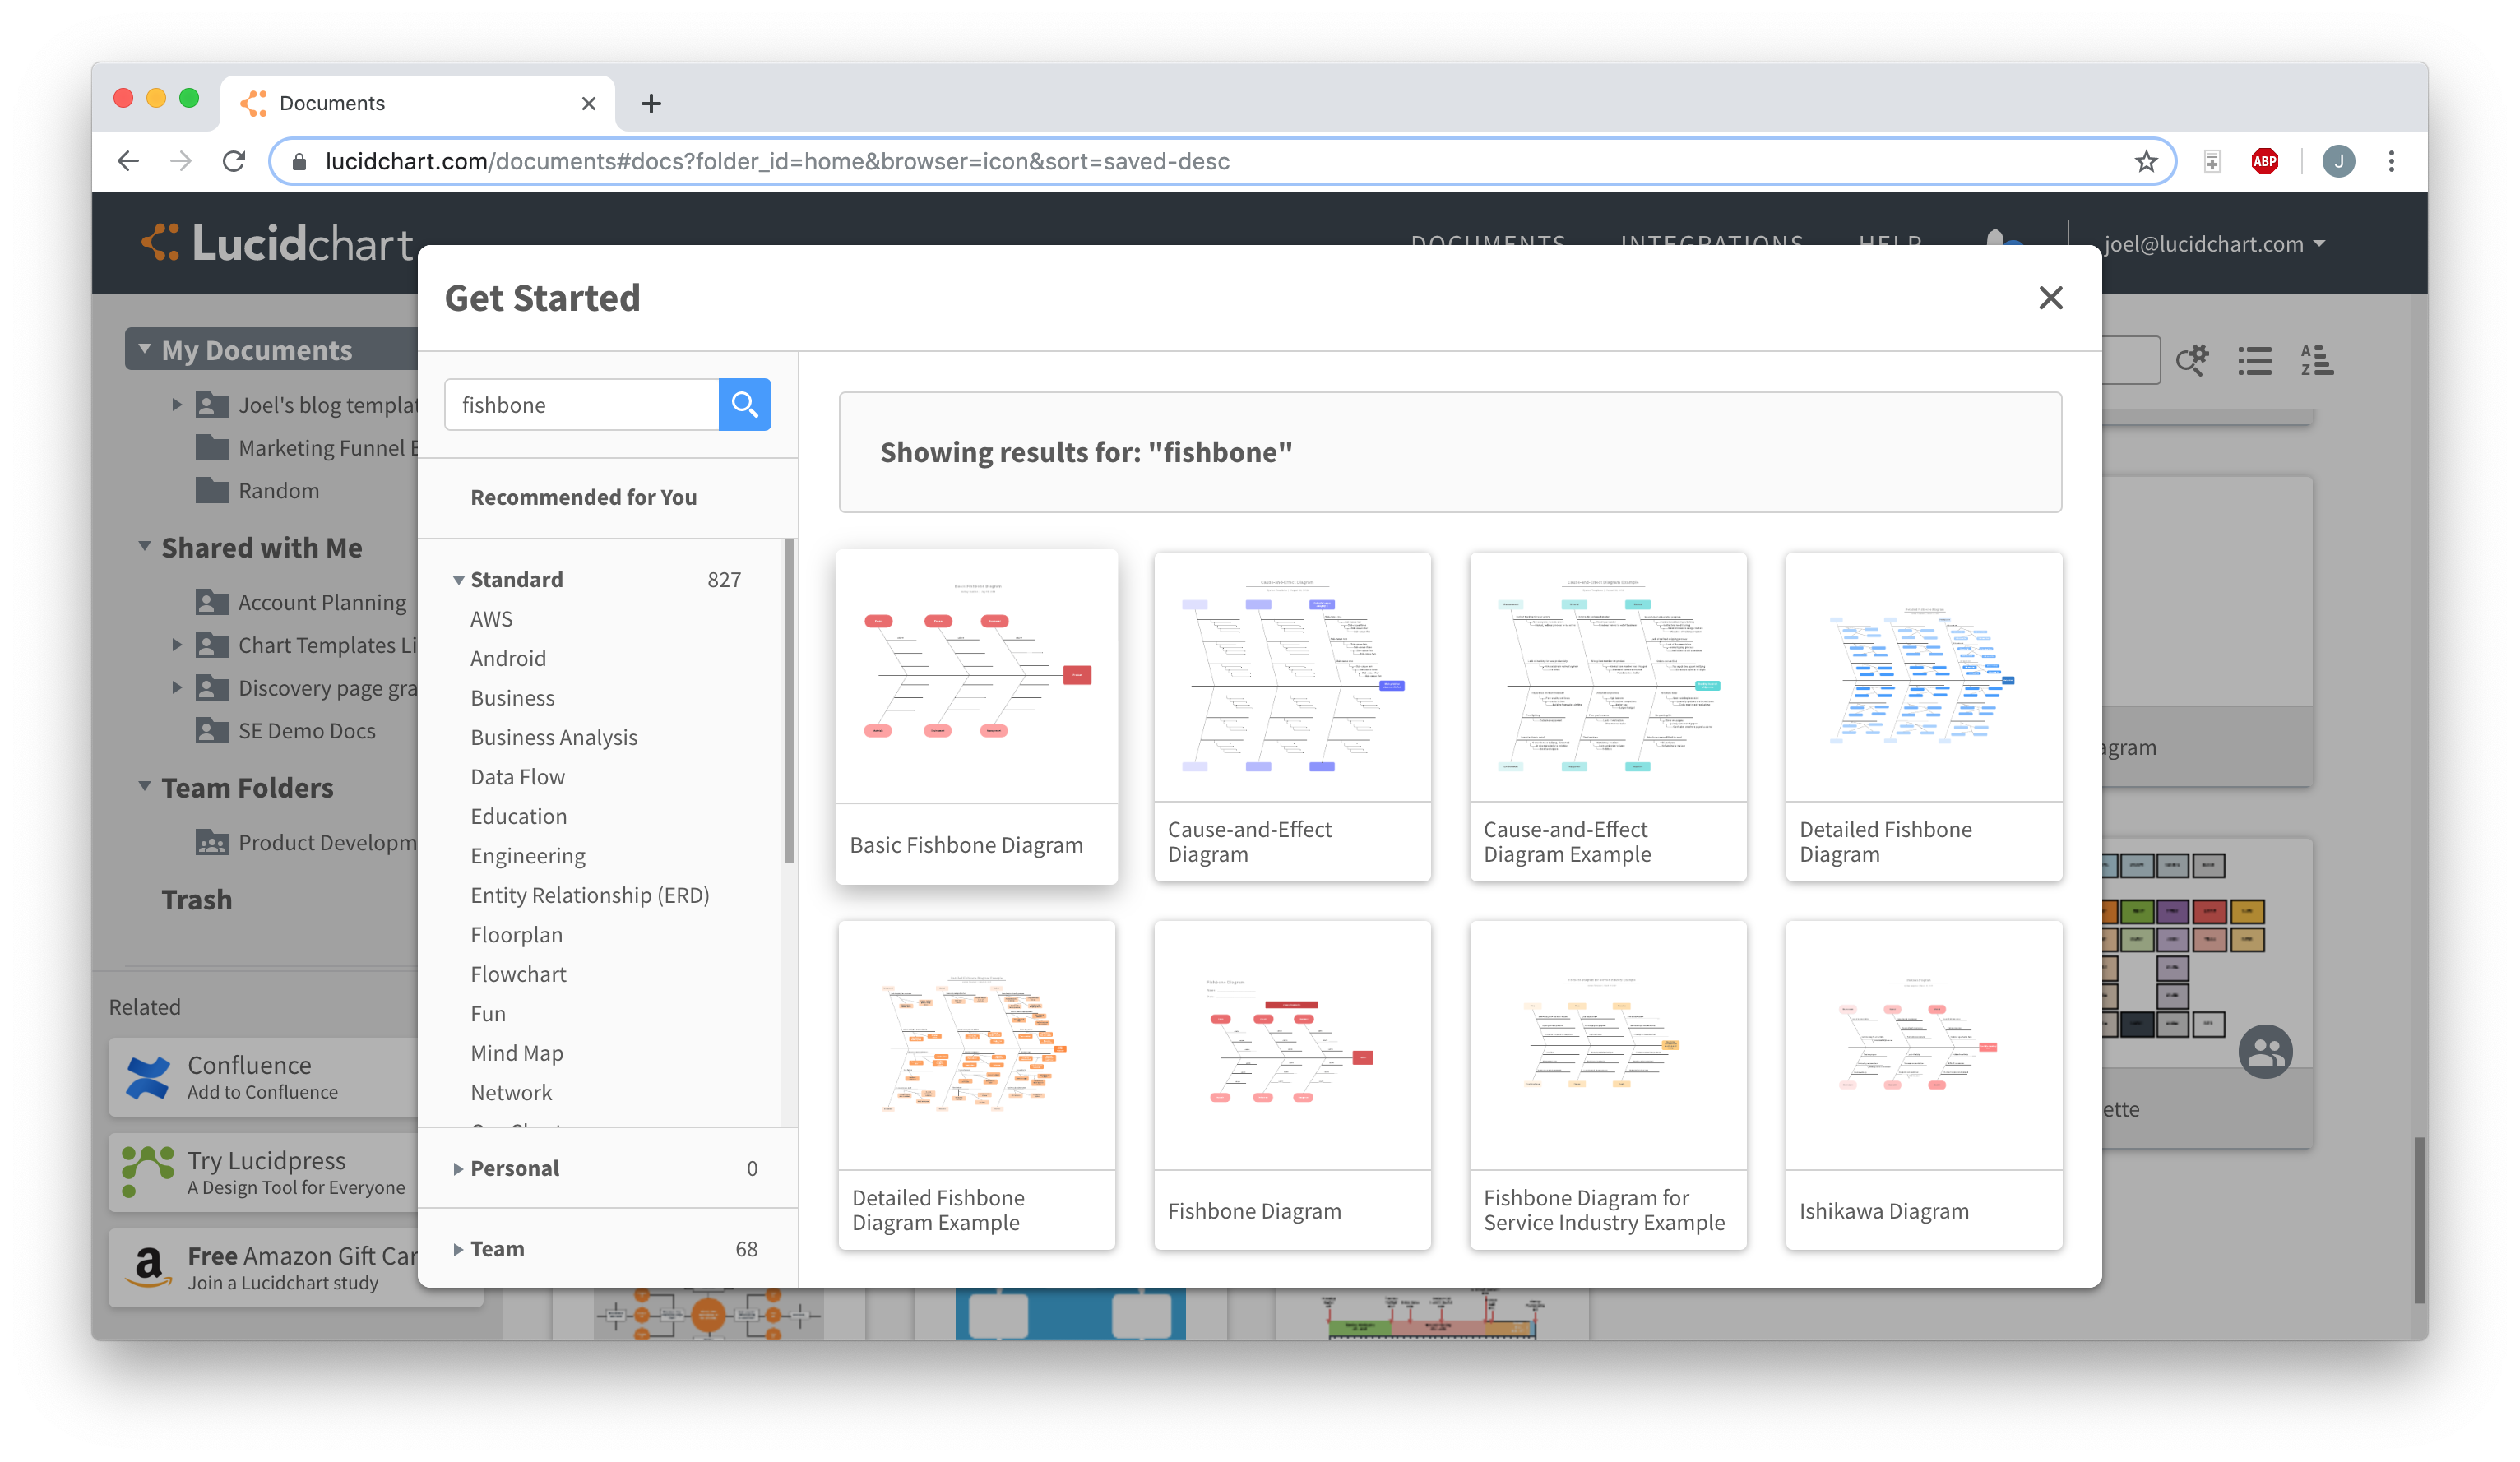
Single-click a template thumbnail to read more about it—if you choose to use that template, click “Create Document.” You can also double-click a thumbnail to create a new document from that template.
If you’d rather start your fishbone diagram from scratch, simply click “+Document.” All of the shapes that you’ll need can be found in the flowchart shape library, which is automatically pinned to the shapes menu on the left side of the editor.
(Click the template below to open it in Lucidchart!)
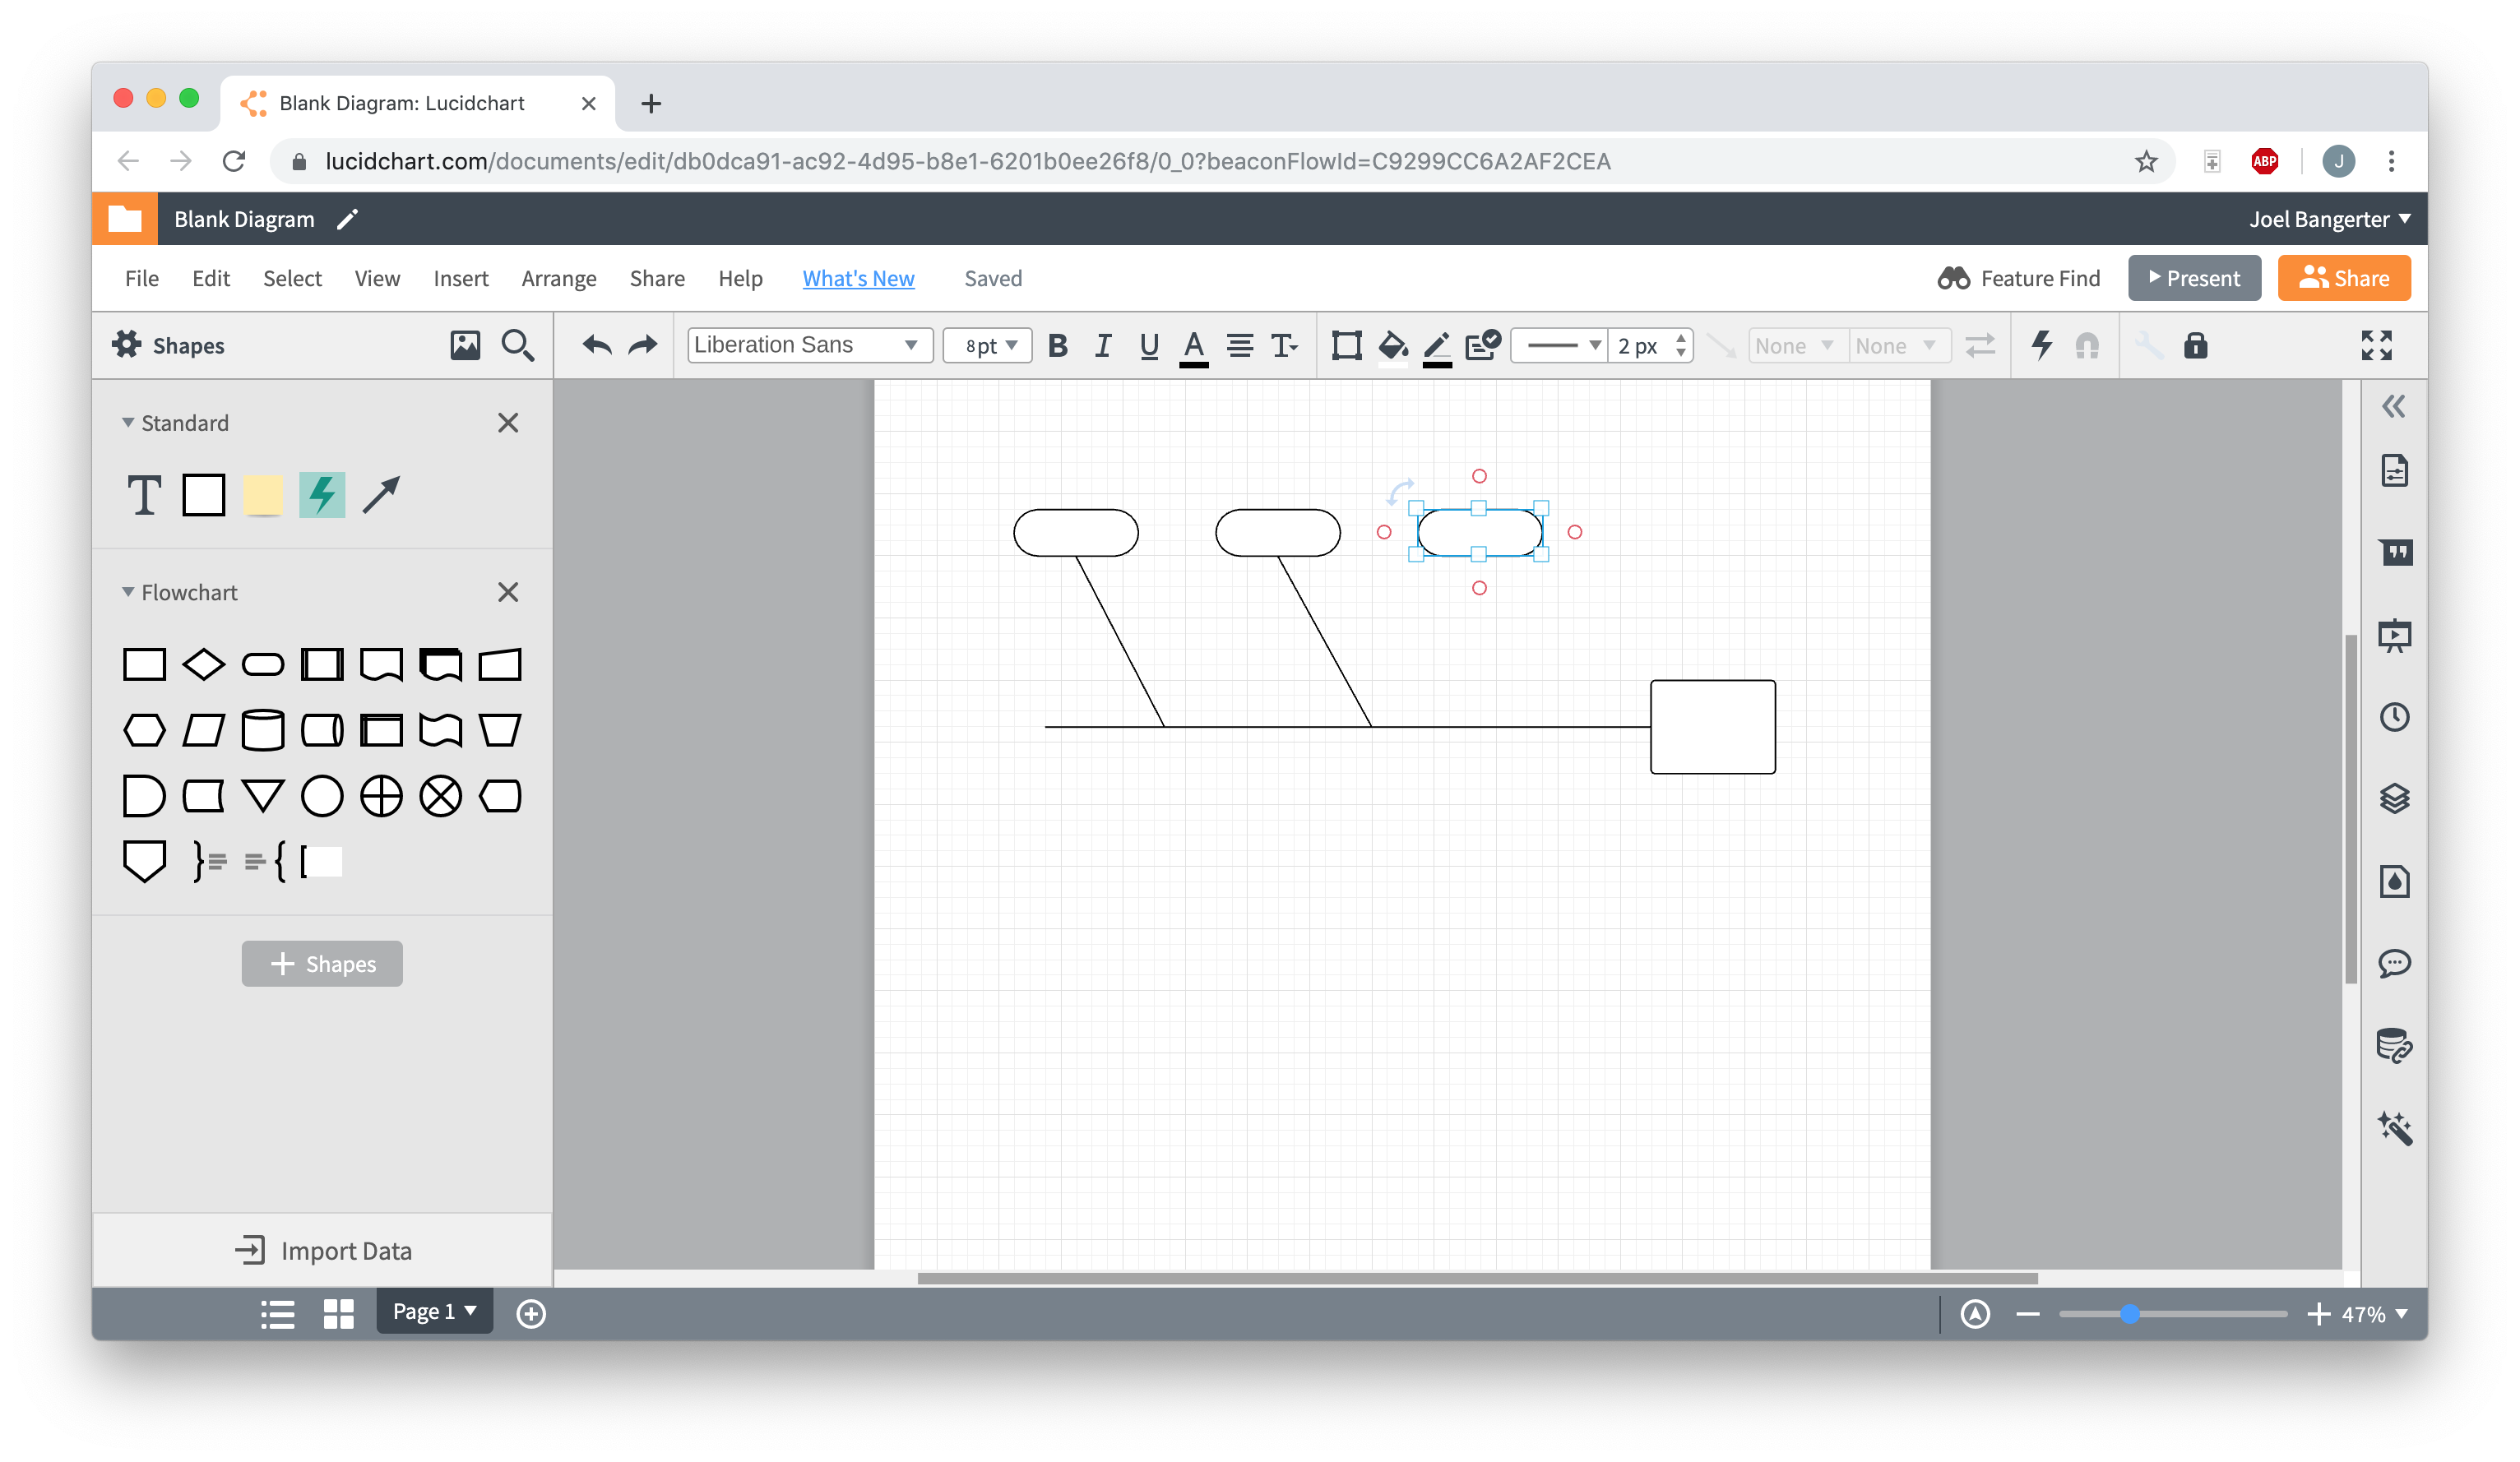
2. Add, move, or delete shapes
If you started from a template, the shapes for your fishbone diagram are already in place. However, if you’d like to change the structure of your diagram—whether it’s rearranging, adding, or deleting shapes—Lucidchart’s drag-and-drop functionality makes the process incredibly easy. To move shapes, simply click and drag; connecting lines will adjust automatically. Add new shapes using the libraries pinned to the left-hand side of the editor. To delete a shape, single-click it and press the “Delete” key.
If you started from scratch, you’ll have to add shapes individually to build your diagram. But don’t worry—it’s still a quick process! Just drag and drop the shapes and lines you need onto your canvas, then click and drag to rearrange them. (For an in-depth fishbone guide, read our fishbone diagram tutorial.)
3. Add text
At this point, your fishbone diagram should look almost complete. But it’s missing one crucial element: text. What is the central problem statement? What are contributes/cause the problems?
Adding text to arrows and other shapes in Lucidchart is incredibly easy—just double-click and start typing! To edit existing text, do the same.
Font, text size and color, and much more can be easily adjusted using the toolbar at the top of the editor.
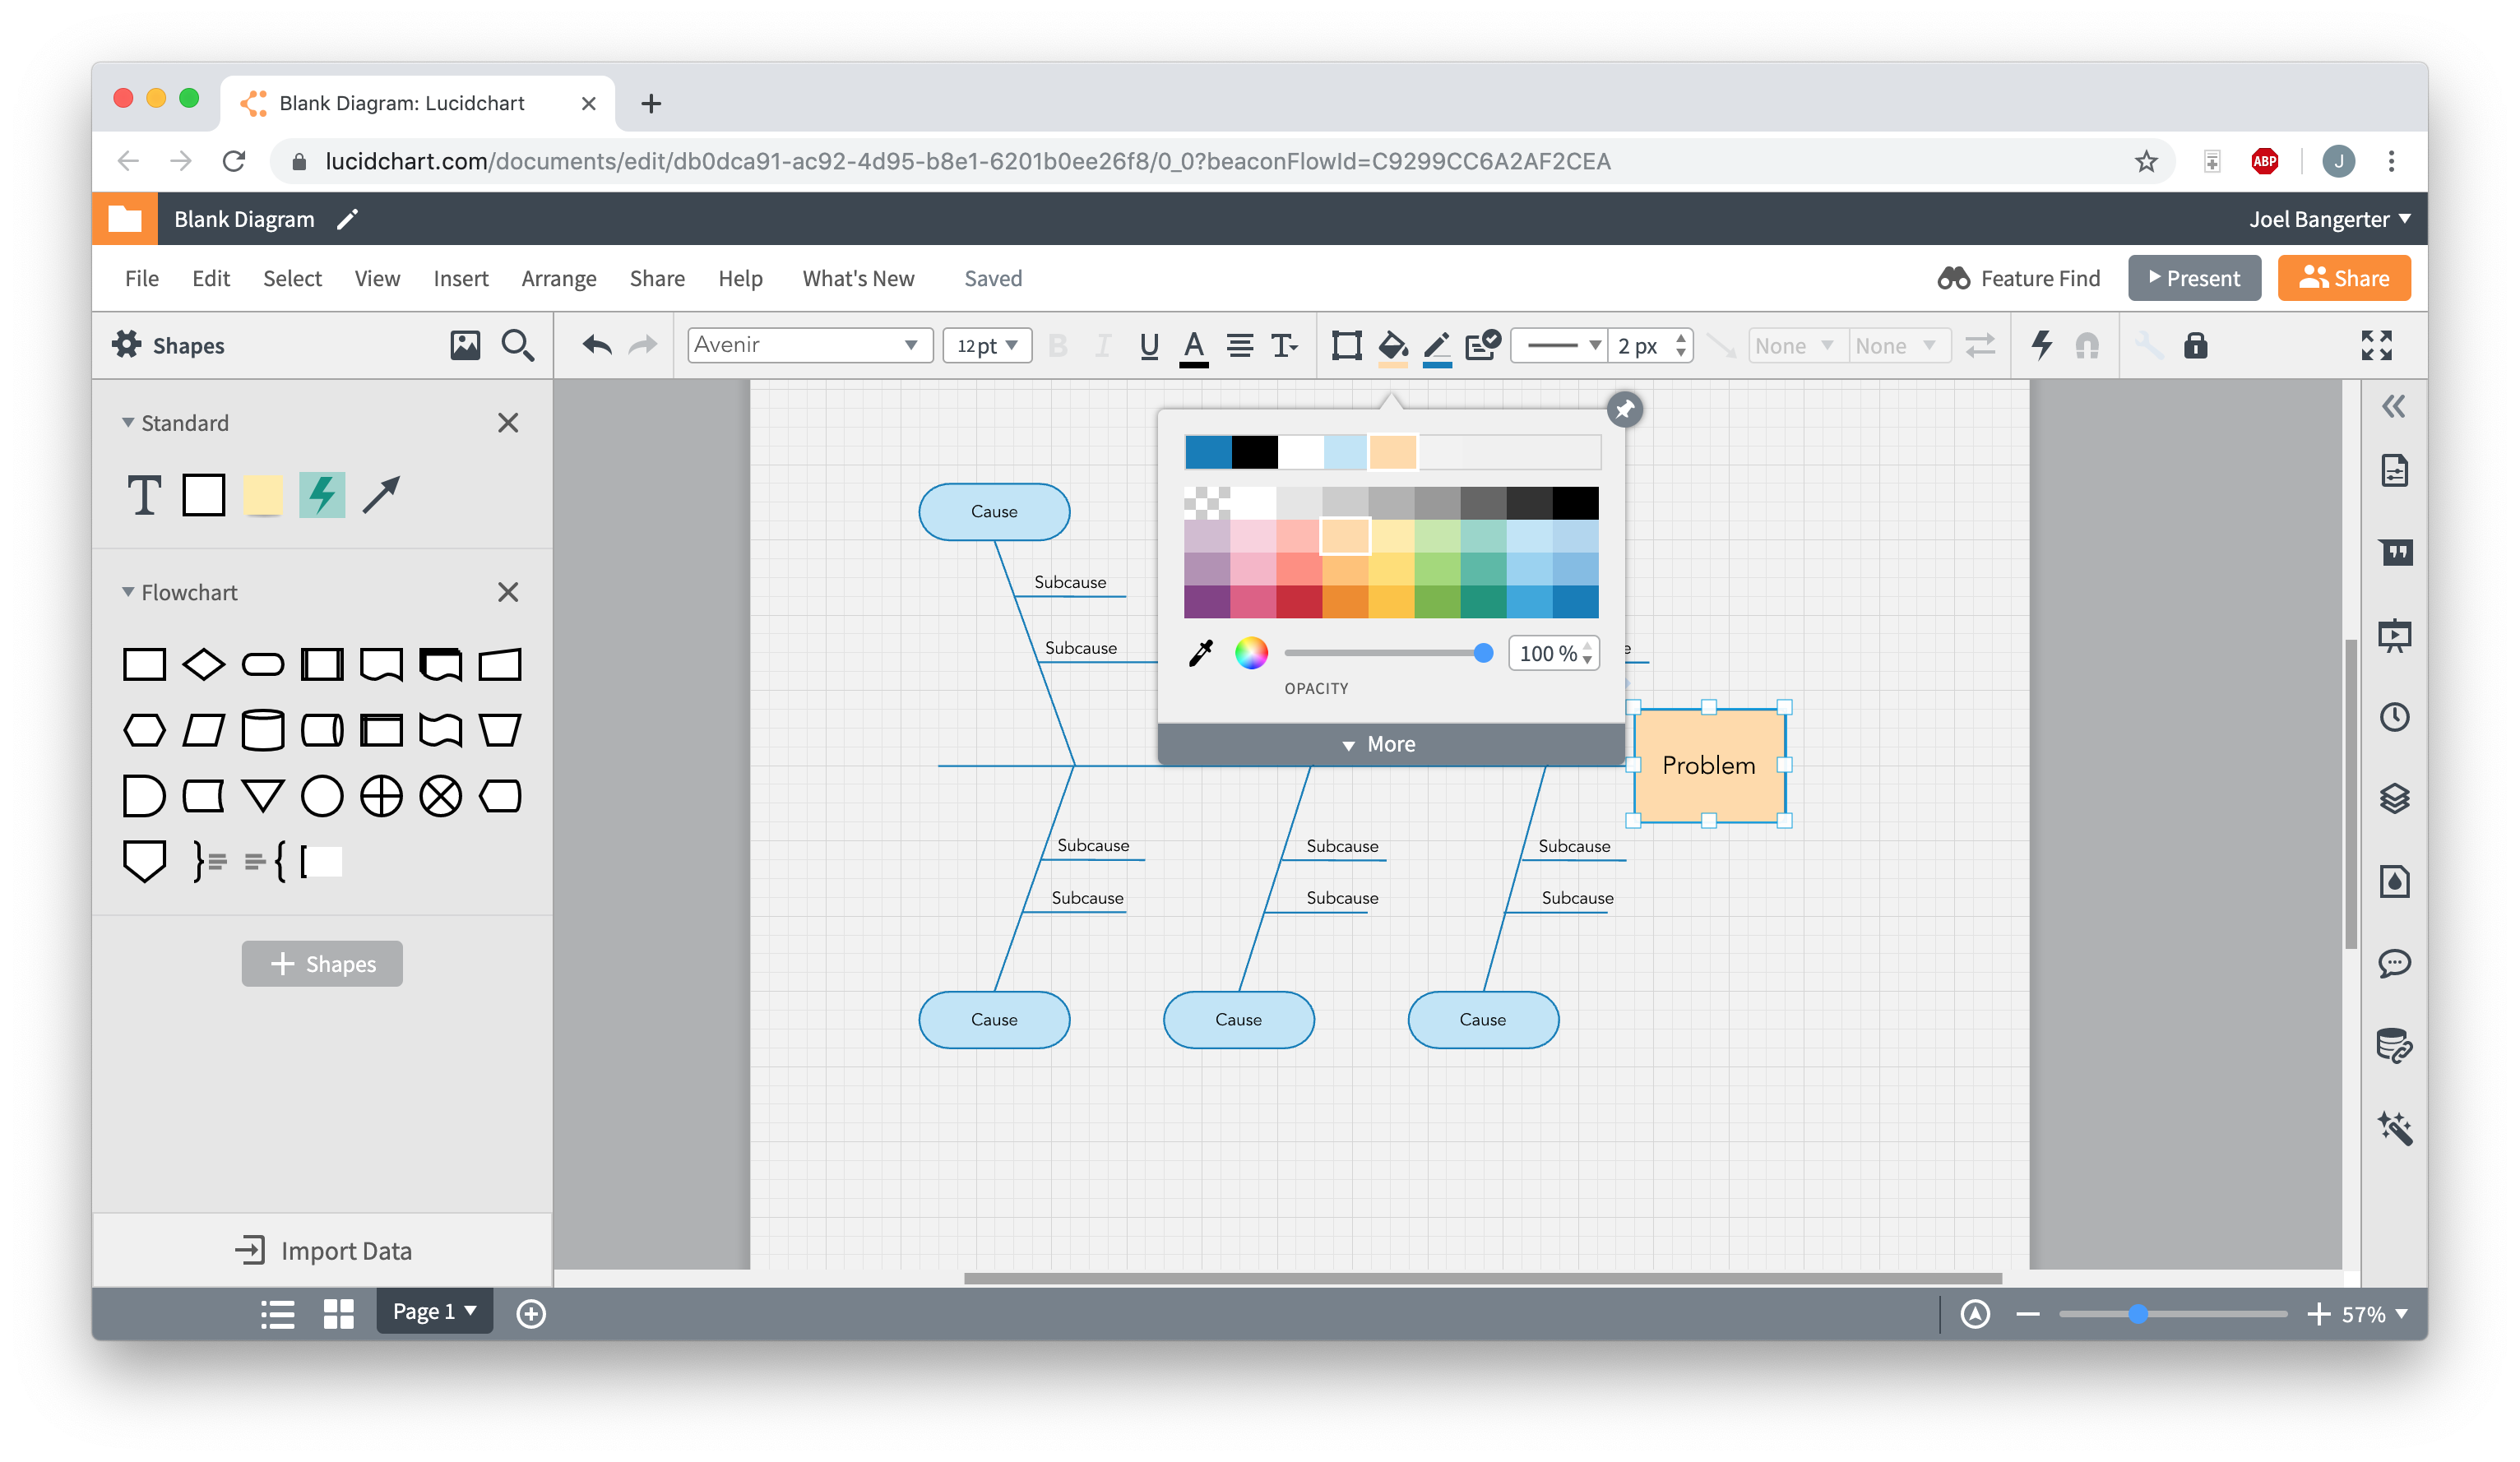
4. Format and style your diagram
Now you can consider your fishbone diagram complete—but it might look a bit boring. Here’s your chance to change that. If you started from a template, your diagram is styled according to that template’s presets. You can still change the style to your liking!
To set a coherent, diagram-wide formatting theme, click “Theme,” the droplet icon located on the right-hand side of the editor. This opens a pane with a variety of themes to choose from—click on one to apply it to your diagram.