What is an Org chart?
An organizational chart shows the internal structure of an organization or company. The employees and positions are represented by boxes or other shapes, sometimes including photos, contact information, email and page links, icons and illustrations. Straight or elbowed lines link the levels together.
Organizational Charts also are known as Organization Charts, Org Charts, Organograms, Organogram Charts (sometimes spelled Organigrams or Organigrammes) and Hierarchy Charts. Don’t be fooled: Despite all the different names, they’re all the same thing.
Master the basics of Lucidchart in 3 minutes
- Create your first online flowchart from a template or blank canvas or import a document.
- Add text, shapes, and lines to customize your flowchart.
- Learn how to adjust styling and formatting within your flowchart.
- Locate what you need with Feature Find.
- Share your flowchart with your team to start collaborating.
History
In 1855, railway general superintendent Daniel McCallum (1815-1878) designed what is thought to be the first modern organizational chart. It was an illustrated diagram of the New York and Erie Railway. McCallum had it drawn up by draftsman and civil engineer George Holt Henshaw (1831-1891). McCallum, born in Scotland, also served as a Union major general in the Civil War. Henshaw, a Canadian, worked for waterworks and railway companies in Canada, the United States and Denmark.
The term “organizational chart” took another 50 to 60 years to come into common use. Consulting engineer Willard C. Brinton used the term in his 1914 textbook, Graphic Methods for Presenting Facts. He touted the value of the charts and said they should be more widely used. The charts were mainly used in engineering circles until the 1920s, when they began to find their way into the business world.
The lesser-known synonyms “Organigram” and “Organogram” came into use in the 1960s.
A related diagram is called an Organigraph. While is still reflects organizational structure, it’s less linear than an org chart and serves a different purpose: to illustrate associations and opportunities among departments, products or supply chains.
Types of organizational charts
What is an organizational chart's best format? Depending on your needs and the type of organization, you may want to choose a less traditional org chart format. There are three main types of org charts: hierarchical, matrix and flat.
-
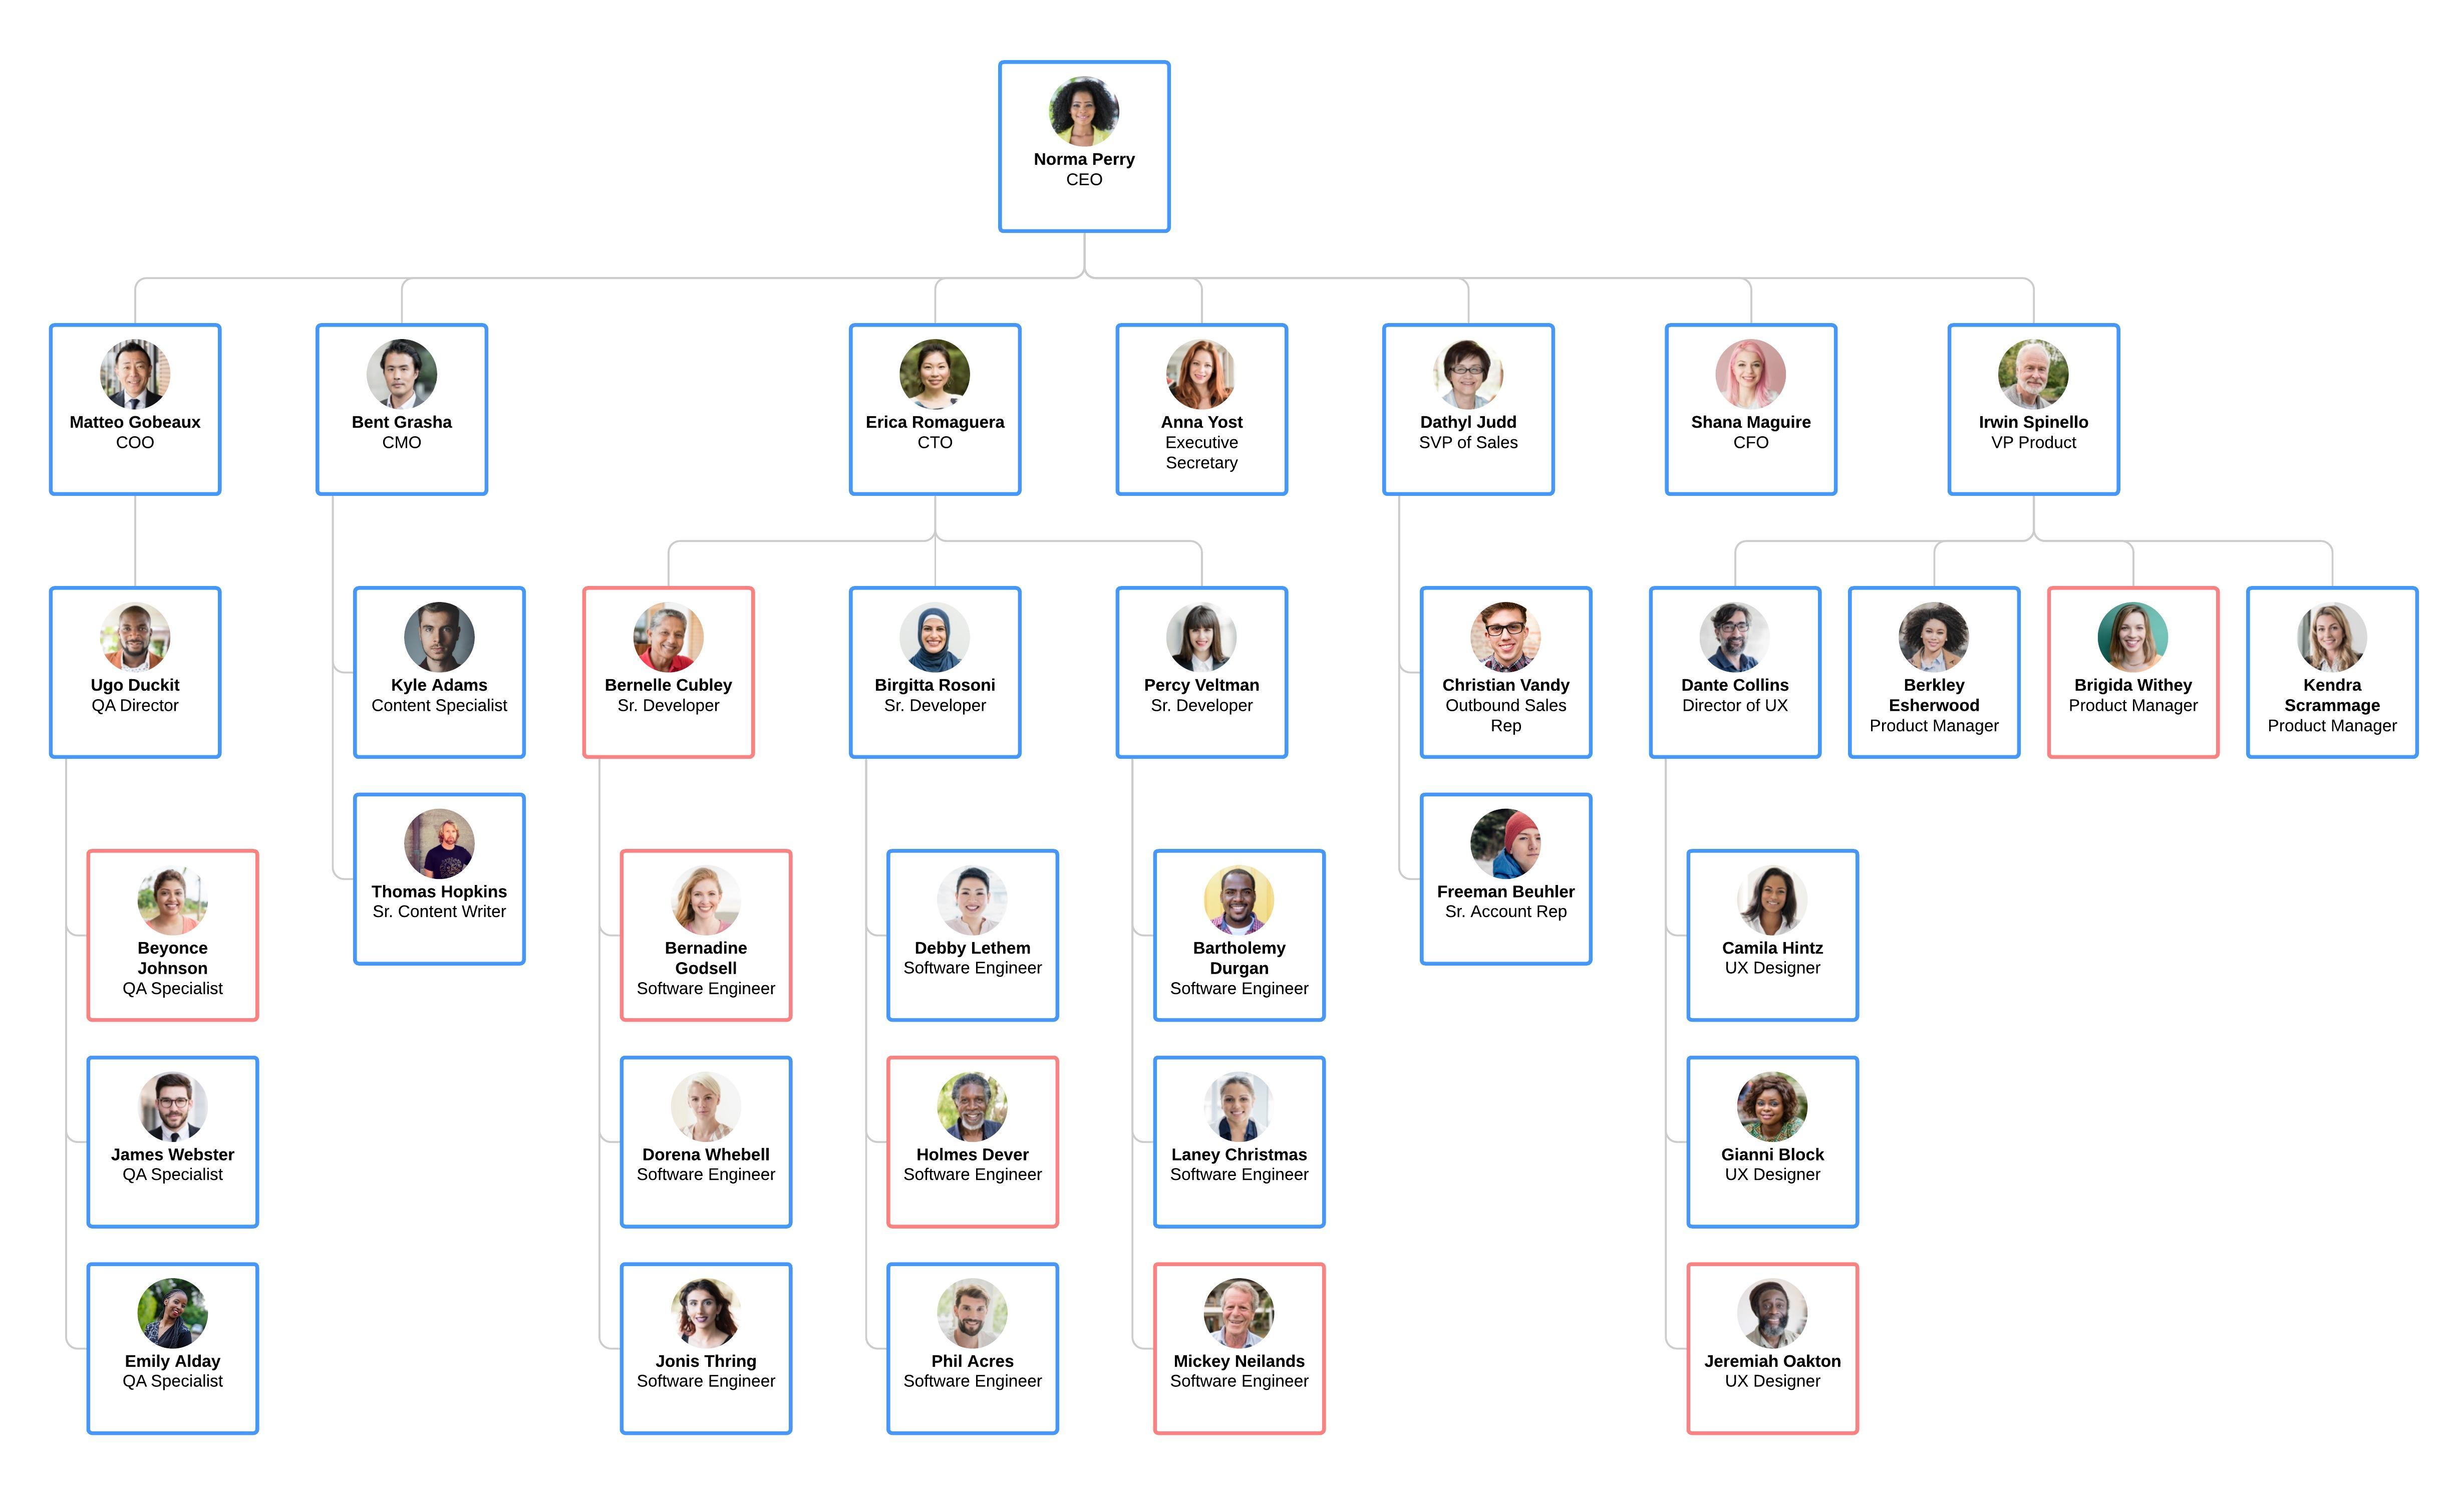
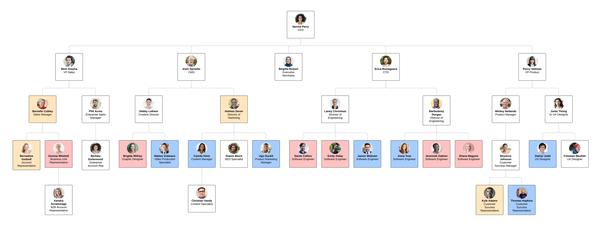
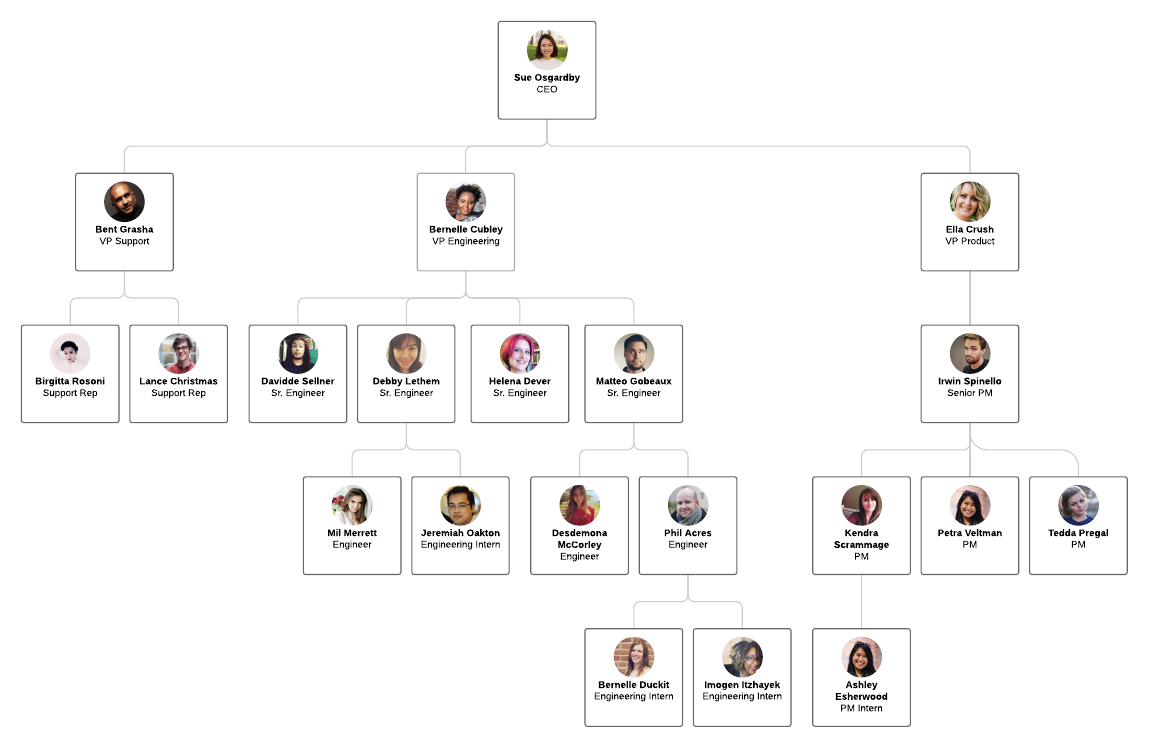
Hierarchical Org Chart: This is the most common type, and it gives rise to the synonym Hierarchy Chart. A hierarchy is where one group or person is at the top, while those with less power are beneath them, in the shape of a pyramid. Think of a monarchy with a king or queen at the top, or an organization with the CEO at the top. With a hierarchy, members typically communicate with the person they report to and anyone who reports directly to them.

-
Matrix Org Chart: This is usually only seen when individuals have more than one manager. For example, an organization could have a team of graphic designers who all report to the head graphic designer. The graphic designers are also working on other projects that are likely headed by a separate project manager. In this case, the graphic designers will have two managers.

-
Flat Org Chart: This type, sometimes referred to as a Horizontal Org Chart, has little or no levels of middle management and typically consists of two levels: the top administrators and the workers. In companies like this, the workers have more responsibility and are more directly involved in decision-making.

Relationships in the charts are sometimes called line relationships (or chain of command), depicting supervisor to subordinate, and lateral relationships, showing people on the same level. With line relationships, you might have solid lines, showing the main lines of authority, or dotted lines, showing secondary lines of authority. There are no hard and fast rules in the symbols and lines used in org charts, as long as the formal relationships are made clear.
Pros and cons of different organization types
The types of organizations reflected in these chart types have advantages and disadvantages. In a nutshell:
-
In a hierarchical, vertical, top-down organization, lines of authority and communication should be clear. In its purest form, think of the military. In the business world, think of the chief executive and other C-suite executives, working down to perhaps directors, senior managers, middle managers, team leaders and team members. If the strength of this structure is clarity and stability, the potential weakness is rigidity, the inability to be flexible when called for. The management layers can sometimes bloat an organization as well.
-
In a matrixed organization, cross-department relationships may be more fruitful and cooperative. However, having more than one person or department to answer to can also create confusing loyalties or conflicts of interest for employees.
-
In a flat, horizontal structure, most layers of management are cut out, with close relationships between the top and the employees. This is common in smaller companies and organizations, but it’s generally not practical for larger organizations. Employees may feel a stronger sense of teamwork and autonomy, though conflicts among employees can become more pronounced due to fewer people doing the work.
Uses of org charts
What is the best use for an organizational chart? No matter which layout you choose to use, Org Charts are useful for laying out relationships in your organization and ensuring that everyone knows how to communicate essential information.
You can use org charts for:
-
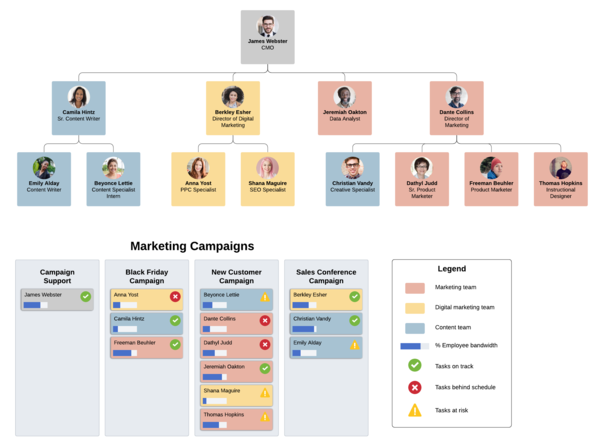
Organizational and supervisory communication, such as helping employees know who reports to whom, or helping people get to know each other across the organization. Adding employee photos can help a lot, allow people to connect faces and names.
-
Restructuring, such as switching roles in a team to better utilize everyone’s talents.
-
Workforce planning, such as figuring out the details of a new hiring initiative.
-
Resource planning, such as reducing inefficiencies by rearranging roles.
-
Genealogy, because a family tree is really just a type of Org Chart. You can include photos, dates of birth and death and links to other information about each person.
Getting more visual with organizational charts
There are few rules with org charts, so any visual elements that help to communicate are fair game.
-
Using photos
can help people get to know each and connect names and faces. -
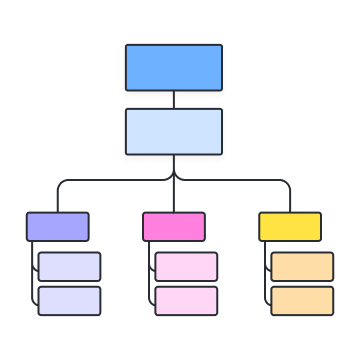
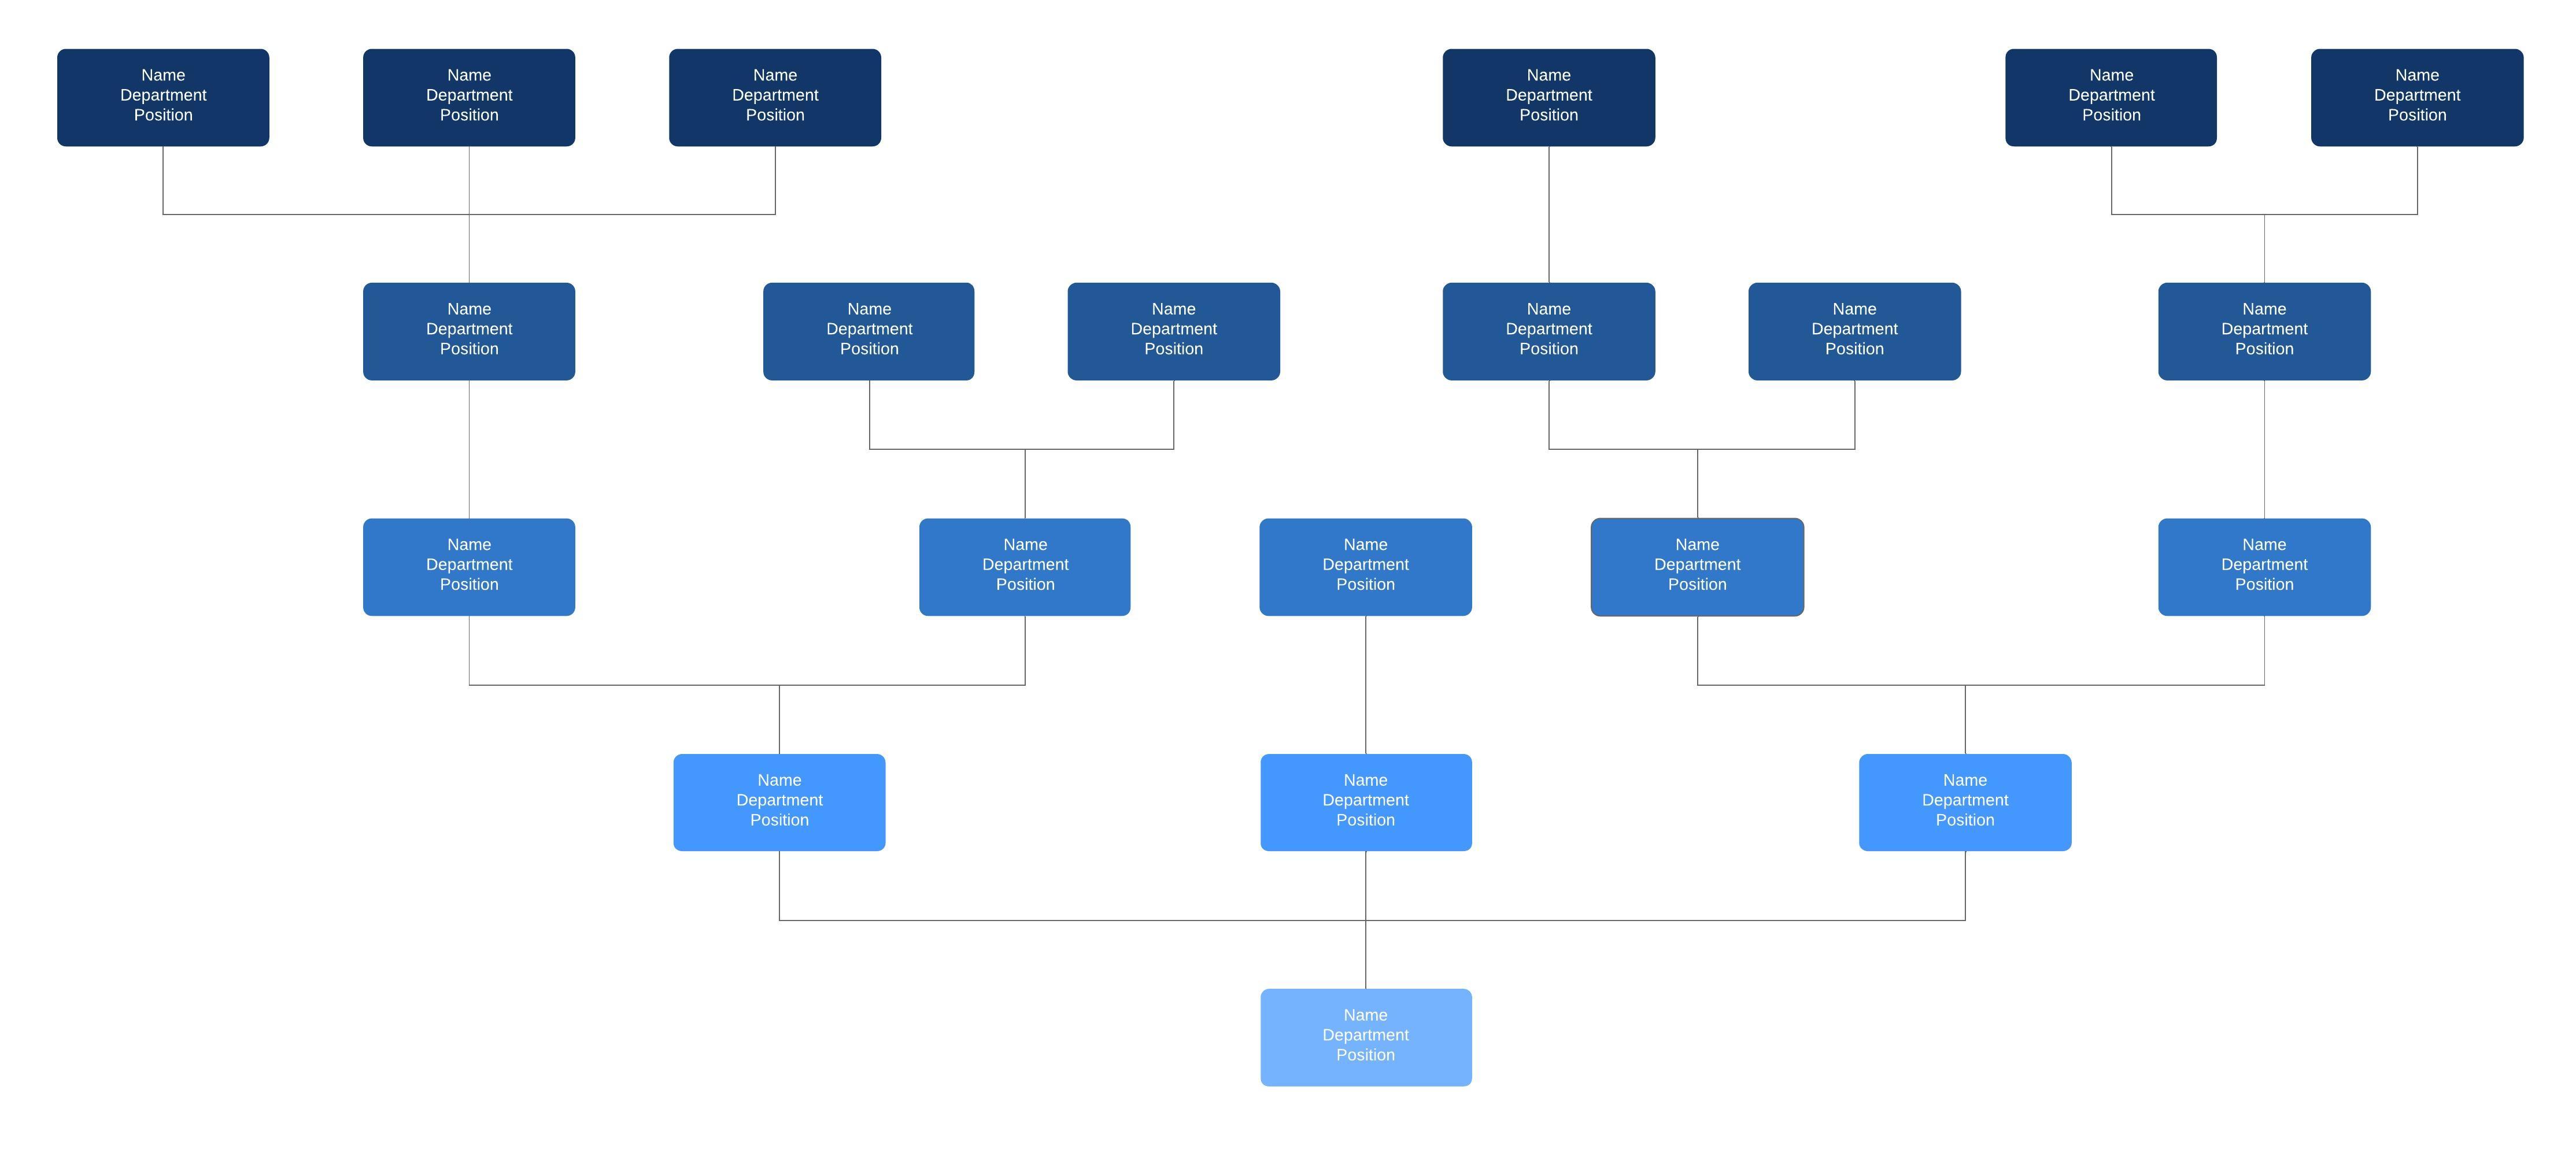
Using different shapes and/or colors can help to define different departments, work groups, job levels or other useful breakdowns.
-
Using company logos or icons can customize your chart to your organization’s feel.
-
Using animations in PowerPoint can help bring a presentation to life as you talk about the chart’s different parts.
-
Using 3D shapes can make your chart more appealing as it pops from the page.
Limitations of org charts
-
They can quickly become out of date,
especially in organizations with a large amount of turnover. Online charts are easier to update than printed ones, but even online charts can become outdated if not tended to regularly. This can be mitigated with editable online documents, as well as automation, such as employee departures and arrivals triggering Org Chart updates. -
They show only formal relationships, and not the informal or social relationships that help to get things done in an organization. To show informal relationships that exist in an organization, you might want to consider making an account map, which you can learn more about here.
-
They don’t reflect management style. They show lines of authority, but not how that authority is exercised.
-
Organigraphs, the close relative of org charts, might be more useful if your purpose to illustrate or discover other associations among people or departments.
How to plan and draw a basic organizational chart / organogram
-
Define your purpose and scope
. For example, do you intend your chart to be a “who’s who” resource? You might want to include photos and contact info, including email links. Are you charting your whole company, or maybe just department or work group. Might it be more than one chart? Think about what is most useful for your purposes. -
Gather the information. You might find an existing list of employees on which to base your chart, or an outdated Org Chart that still might be a helpful starting point. Remember to gather contact info, photos and whatever else you might plan to use. You might need to find other resources to clarify the lines of authority and spell them out for your chart.
-
Determine what platform you plan to use to build your chart, and how you plan to display it. Lucidchart provides a powerful, easy-to-use platform to build and display charts online. (See more on Lucidchart below.)
-
Plan for ongoing updates to the chart. Remember, things change quickly in many organizations, so you’ll need a way to efficiently keep the chart or charts up to date. That’s a lot easier with a collaborative online platform like Lucidchart.
More tips for organizational charts / organograms
-
Try breaking down your org chart
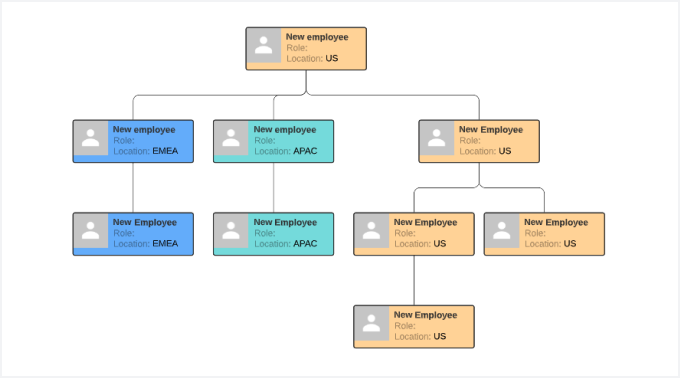
into manageable pieces to get started. This way, all of the information is consistent and leads back to the highest level of the organization. You can section off different areas of your chart with the following categories: department, team, unit, project, location. -
You may want to round out your chart by including the details of people or departments. Adding contact information, location, and other notes can make the organization more efficient and eliminate confusion about who does what.
-
You might use colors or shapes to define certain groups or levels of employee.
-
Use Lucidchart's org chart import to automatically build an org chart from a Google Sheet, Excel file, or CSV.
How to make an org chart with Lucidchart
If you want Lucidchart to do the work for you, automatically create an org chart by uploading a CSV, Google Sheet, or Excel file. Lucidchart lets you easily create org charts, with smooth placement of boxes, lines, labels, colors, photos and other visual elements. With all editing taking place in the cloud, it’s easy to collaborate with colleagues. You can share your diagram digitally or via print.
Want to create org charts that highlight your company’s culture? Choose a layout that works best for your structure, update a design with your company colors, and add employee photos to each role. You can even add links and videos to your document for some extra pizzazz. Try clicking on our org chart templates and make it your own.
For a truly dynamic experience, Lucidchart lets you share and embed org charts on your own site. When you share a chart with others, you can also set permissions so people can comment on the doc or collaborate with you in real-time. Just click Share > Embed to generate an embed code for your site. If you update your org chart in Lucidchart’s editor, the embedded chart will also update. How’s that for easy updates?