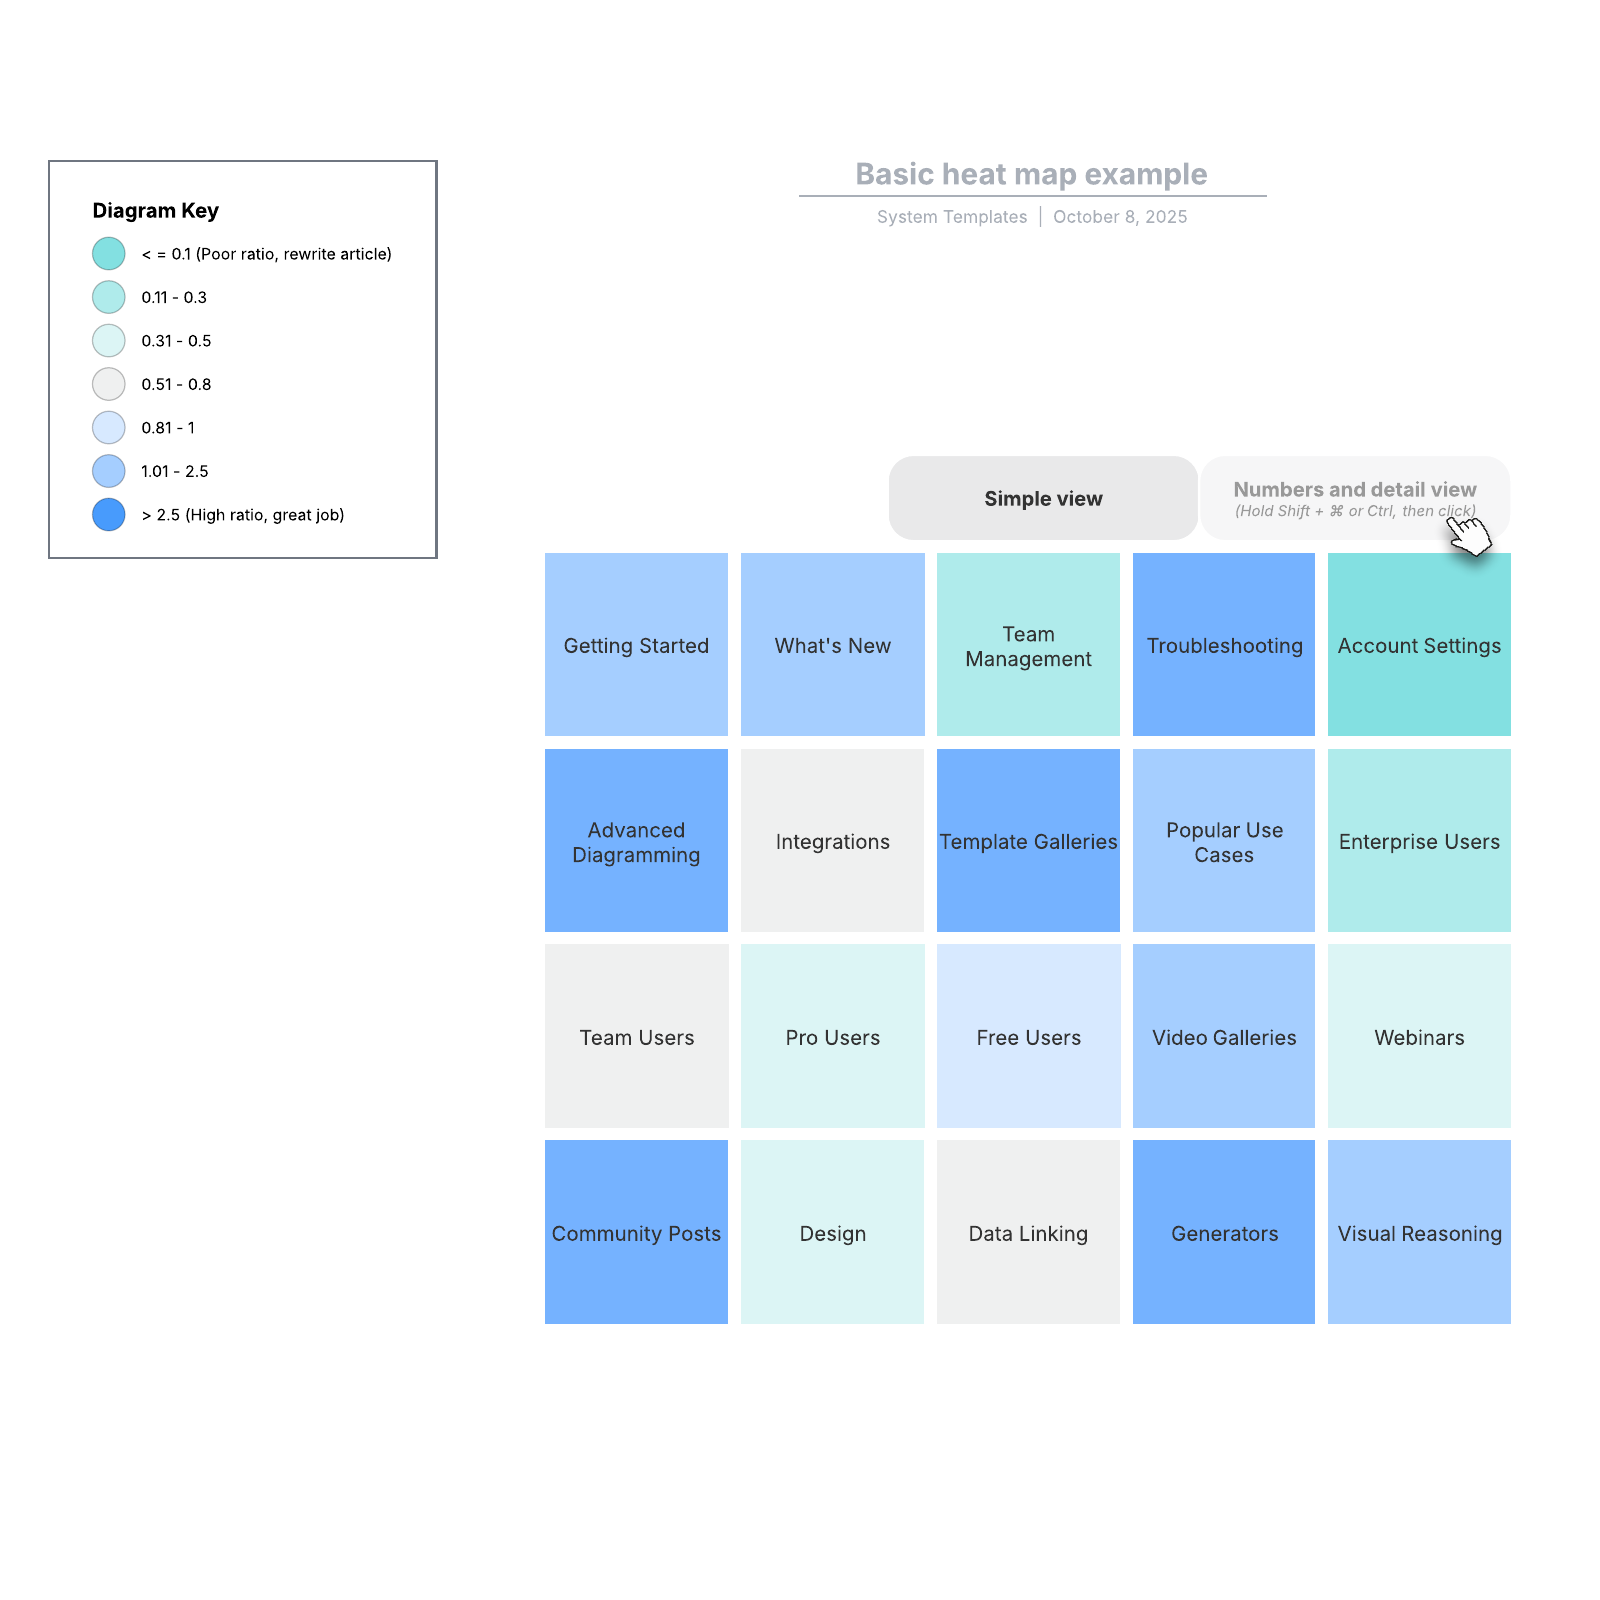
Basic heat map example
This basic heat map example template can help you:
- Color-code your data.
- Determine which articles are performing well and which ones need to be rewritten.
- See the number of tickets submitted through Zendesk and Google Analytics (GA) views.
Open this template to view a detailed example of a heat map that you can customize to your use case.