Data flow diagram: Level 0
Explore our level 0 data flow diagram. It's a context diagram that helps map out the flow of information to better visualize processes and systems.
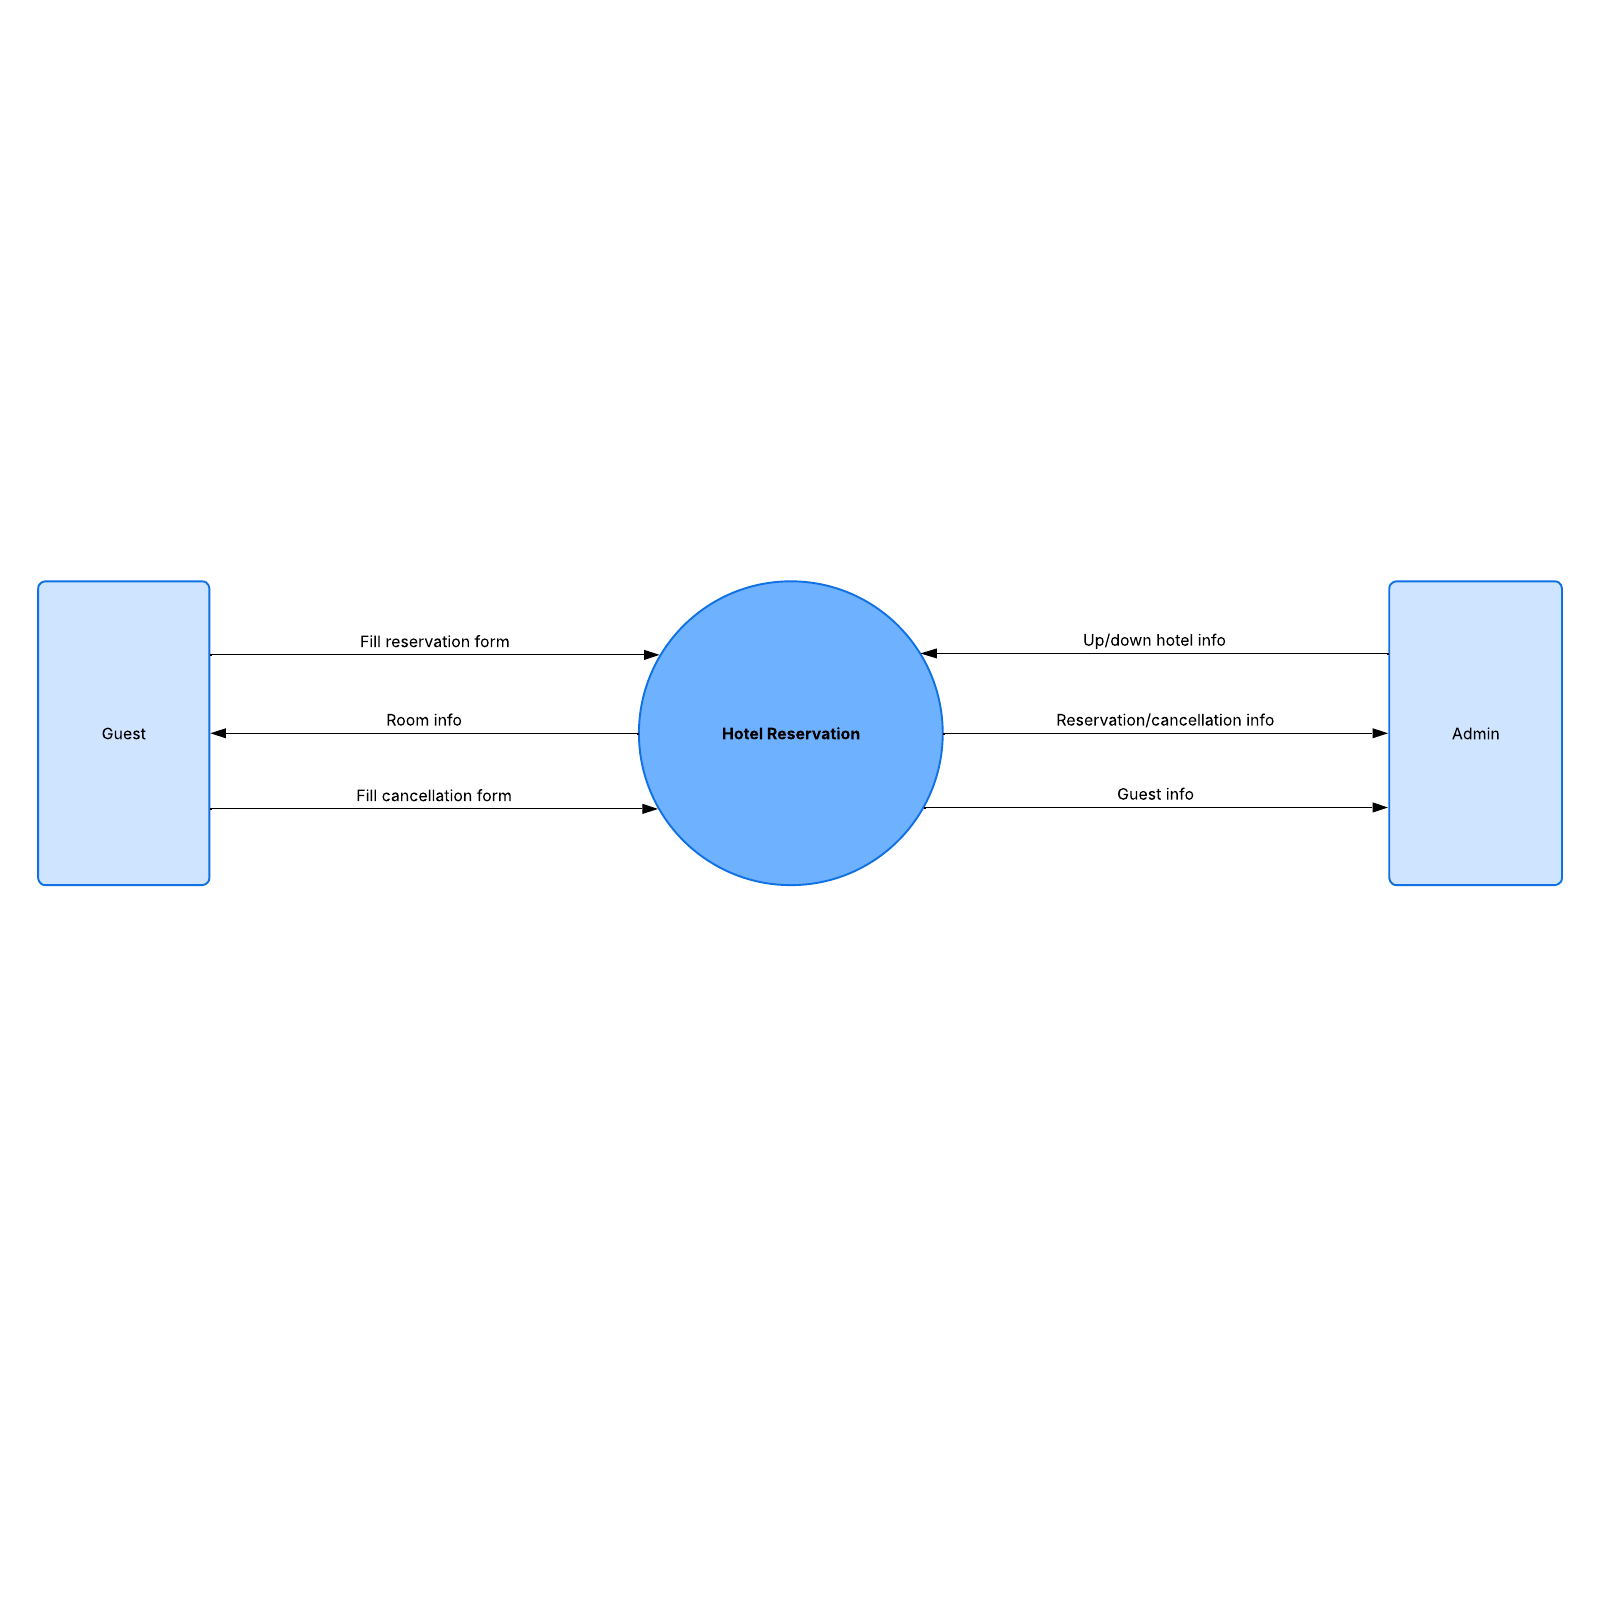
Visualize the flow of information with a data flow diagram
Within any digital process or system, information must move in more than one direction. This may be a simple back-and-forth (like filling out an online quiz), or a more complicated process involving several data entry points, like buying merchandise through a third-party seller.
In any case, those who want to improve or build such systems must keep track of what information is needed, where that information comes from, and where it needs to go. If you need to map out a system in this way, one simple yet effective method is to use a data flow diagram.
Data flow diagrams use simple symbols and notes to map how the data moves in a particular system. System designers can use these diagrams to create new systems or to catch any discrepancies or bottlenecks in existing systems. Maintaining a clear picture of where the data flows can save money, increase efficiency, and improve user experience.
Lucidchart offers a simple, customizable data flow diagram that you can use as a resource for your entire team. It can be updated with existing data in real time and accessed anytime and anywhere, which makes it ideal for remote teams.
Use the Data flow diagram: Level 0 in Lucidchart
You can use our data flow diagram example as-is or add more shapes and lines to represent a more complex system. Here are some tips to get you started:
- To format shapes as you’d like, click on a shape and then click "Shape Options" to select the fill or line colors.
- To add lines, hover over a shape and click on any red circle. To format lines, use the properties bar at the top of the canvas.
- To add text to a line, double-click existing text, or anywhere on the line, and start typing.
- To import data from another source to use in your template, click on "Import Data" on the bottom left.
For more tips on optimizing your template, click on the buttons to the right of the document to access more in-depth tutorials and information on data flow diagrams. Take advantage of all the template offers to keep track of data in your current and future projects.


