Heat map
This basic heat map template can help you:
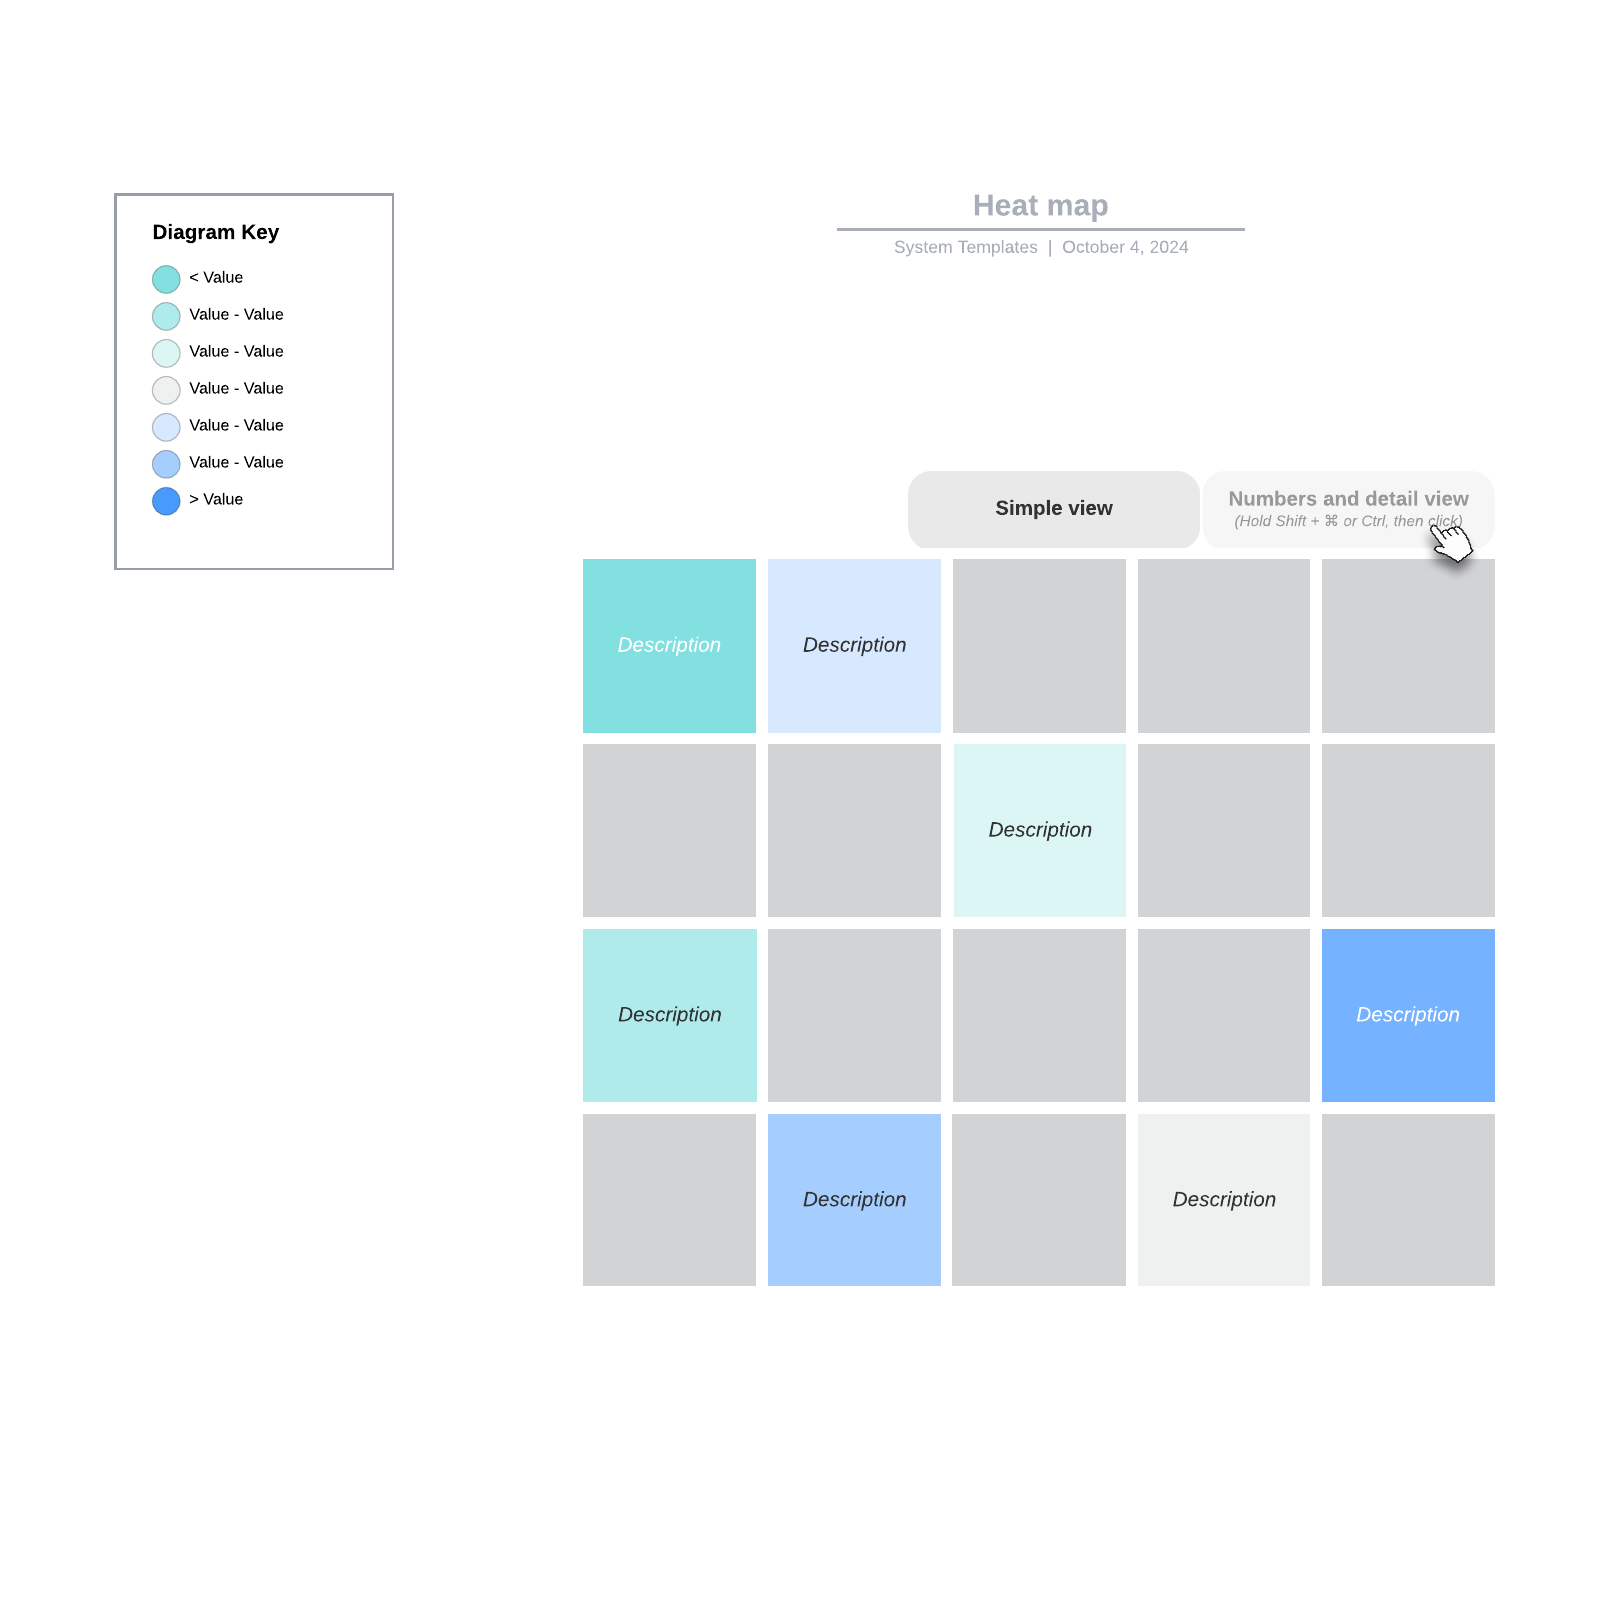
- Color-code your data.
- Quickly compare your data relative to each other.
- Provide a simple view and detailed view of the data you are measuring.
Open this template and add content to customize this basic heat map to your use case.
What is the heat map template?
Suppose you’re a UX designer trying to discover which areas of your website customers pay attention to the most. You need to have solid data about your testing that you can present in an easy-to-understand way so those who aren’t UX designers can grasp it.
Enter: The heat map template.
This template allows everyone from analysts and data sciences to UX designers, geographers, and supply chain managers to present and compare data easily. Typically, warmer colors like red or yellow indicate higher values, while cooler colors like blue or green represent lower values, but you can customize our heat map template to show values and their corresponding colors in whichever way you’d like.
Using this template, your data can come to life, so you can allocate resources where they’ll be most effective and turn insights into action. You’ll have a quick and intuitive way to identify patterns, trends, and concentrations within a dataset.
Benefits of using the heat map template
- Not a UX designer? No problem. A heat map is useful in every industry.
- Visually presenting data allows you to compare and contrast easily.
- Combining visual cues such as color and rank allows everyone to understand complex data.
- Share the heat map with a click and gather comments and ideas from every stakeholder.
- Take action based on data, not conjecture, and improve outcomes.
How to use the heat map template in Lucidchart
- Create a diagram key with custom colors.
- Incorporate data linking to import data.
- Use conditional formatting to highlight important data.
- Share with teams and stakeholders via our integrations with Slack, Zoom, and Microsoft Teams.


