UML API diagram example
This UML API template can help you:
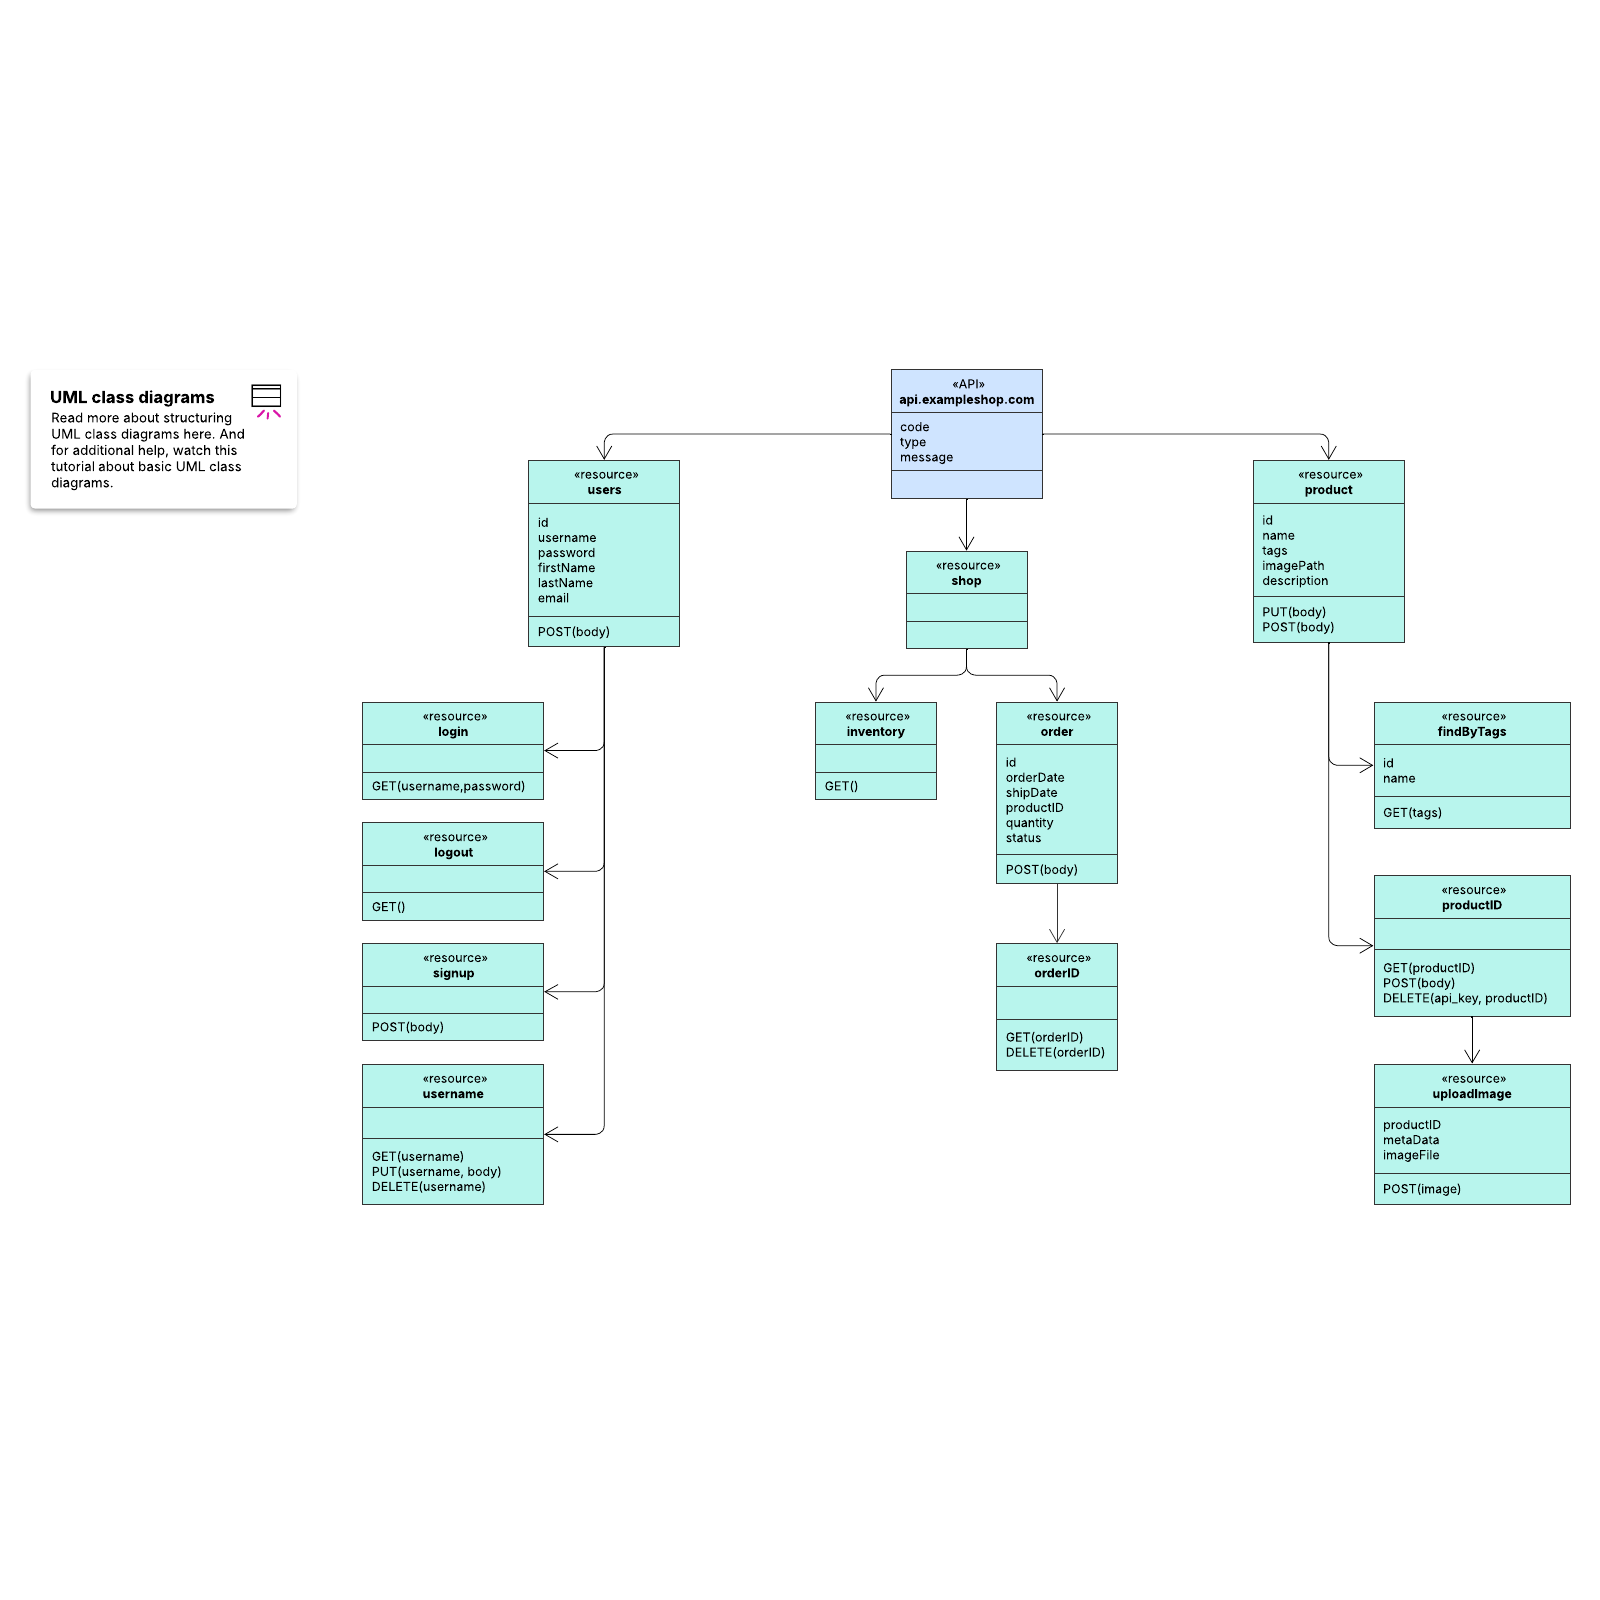
- Document the logic of an API.
- Visualize the flow of information from an API.
- Identify redundancies and other opportunities for optimization.
Open this template to view a detailed example of a UML API diagram that you can customize to your use case.
Map your application with a UML API diagram
An application programming interface, or API, is a catch-all term for any piece of software that allows two or more applications or programs to communicate with each other. An API can allow the sharing of information and commands between operating systems, databases, and internet servers, allowing individuals, businesses, and communities to enjoy more connected, interoperable services.
To visualize precisely how an API does or should work, programmers or product developers can use a diagram to document the API’s logical processes and represent how information flows within the system. Doing so can help your team identify any issues and more fully optimize the API.
Lucidchart provides an API diagram example that you can study and customize to your own use case. This example uses Unified Modeling Language (UML) so you can more easily standardize your API.
Use the UML API diagram example template in Lucidchart
It’s simple to collaborate with team members or modify the template yourself. To customize the UML API diagram example to fit your needs:
- Add and format shapes: Copy and paste existing shapes or utilize the shape library to add new shapes to the template. To format existing shapes, use the properties bar at the top of the document.
- Add and format lines: Hover over a shape and click on any red circle to add lines and connect different shapes. To format lines, click on the line and use the properties bar at the top of the canvas.
- Add text: Double-click on existing text to change it. To add new text, double-click anywhere within a shape or on a line and begin typing.
Once you’ve mapped out your API, you’ll have a valuable resource to easily share with stakeholders that keeps everyone on the same page.
To learn more about UML diagrams, access tips on using Lucidchart effectively, or create your own diagram from scratch, use the tutorial buttons to the right of the template.


