What is an object diagram in UML?
A UML object diagram represents a specific instance of a class diagram at a certain moment in time. When represented visually, you'll see many similarities to the class diagram.
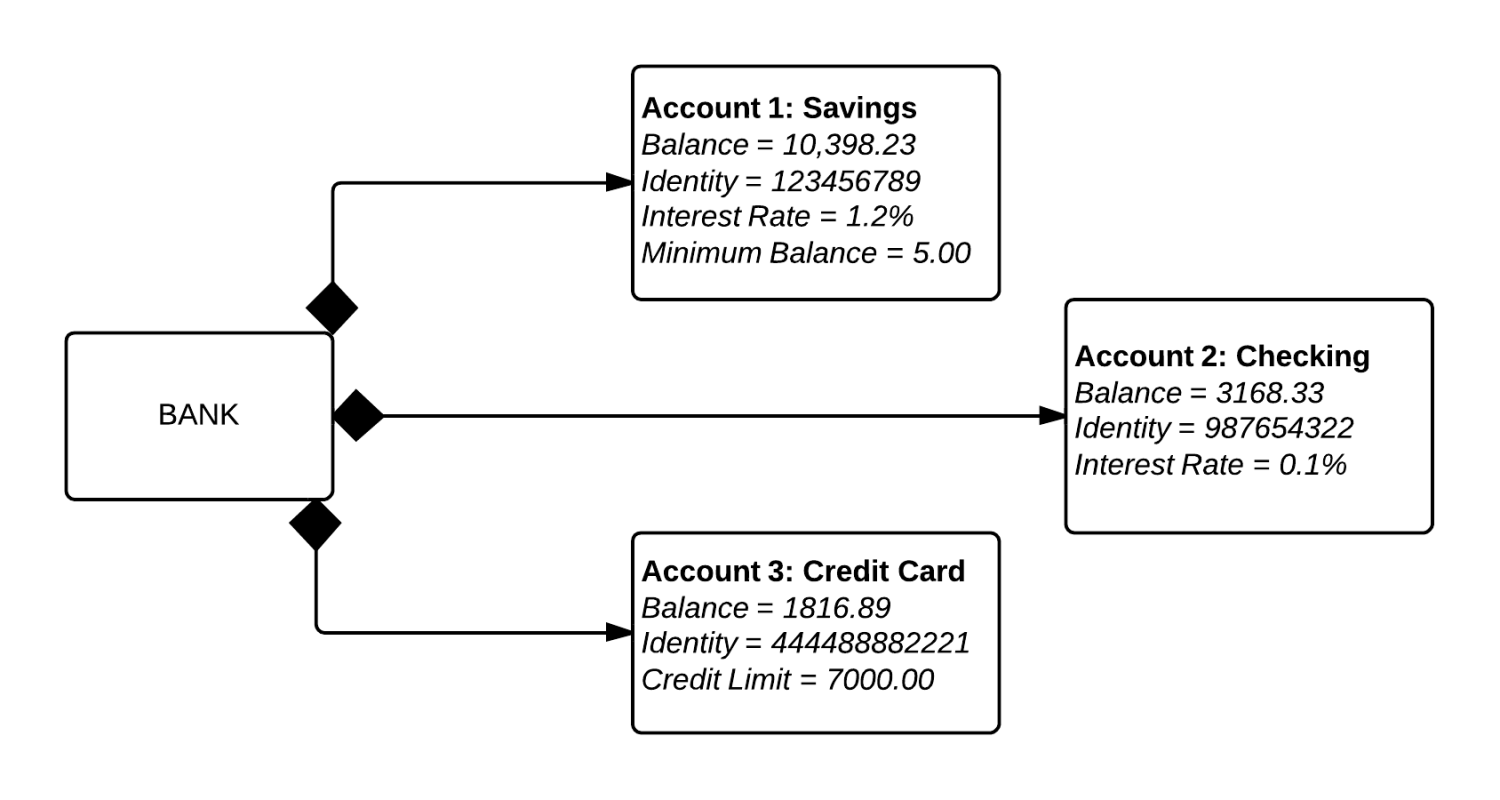
An object diagram focuses on the attributes of a set of objects and how those objects relate to each other. For instance, in this object diagram below, all three bank accounts tie back to the bank itself. The class titles show the type of accounts (savings, checking, and credit card) that a given customer could have with this particular bank. The class attributes are different for each account type. For example, the credit card object has a credit limit, while the savings and checking accounts have interest rates.
Object diagrams are not limited to banking use cases, however, as you can easily make an object diagram for family trees, corporate departments, or any other system with interrelated parts.
Master the basics of Lucidchart in 3 minutes
- Create your first diagram from a template or blank canvas or import a document.
- Add text, shapes, and lines to customize your diagram.
- Learn how to adjust styling and formatting.
- Locate what you need with Feature Find.
- Share your diagram with your team to start collaborating.
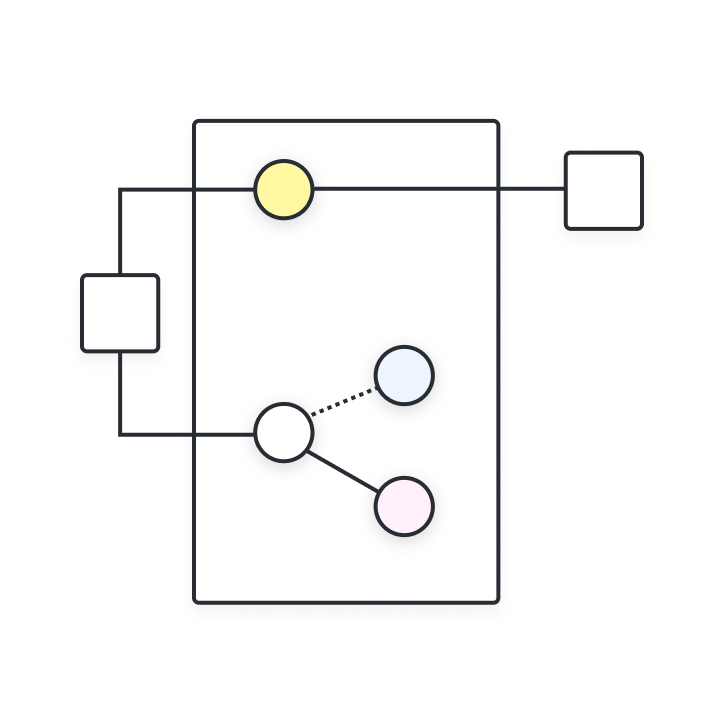
Object diagram elements
Object diagrams are simple to create: they're made from objects, represented by rectangles, linked together with lines. Take a look at the major elements of an object diagram.
Objects
Objects are instances of a class. For example, if "car" is a class, a 2007 Nissan Altima is an object of a class.
Class titles
Class titles are the specific attributes of a given class. In the family tree object diagram, class titles include the name, gender, and age of the family members. You can list class titles as items on the object or even in the properties of the object itself (such as color).

Class attributes
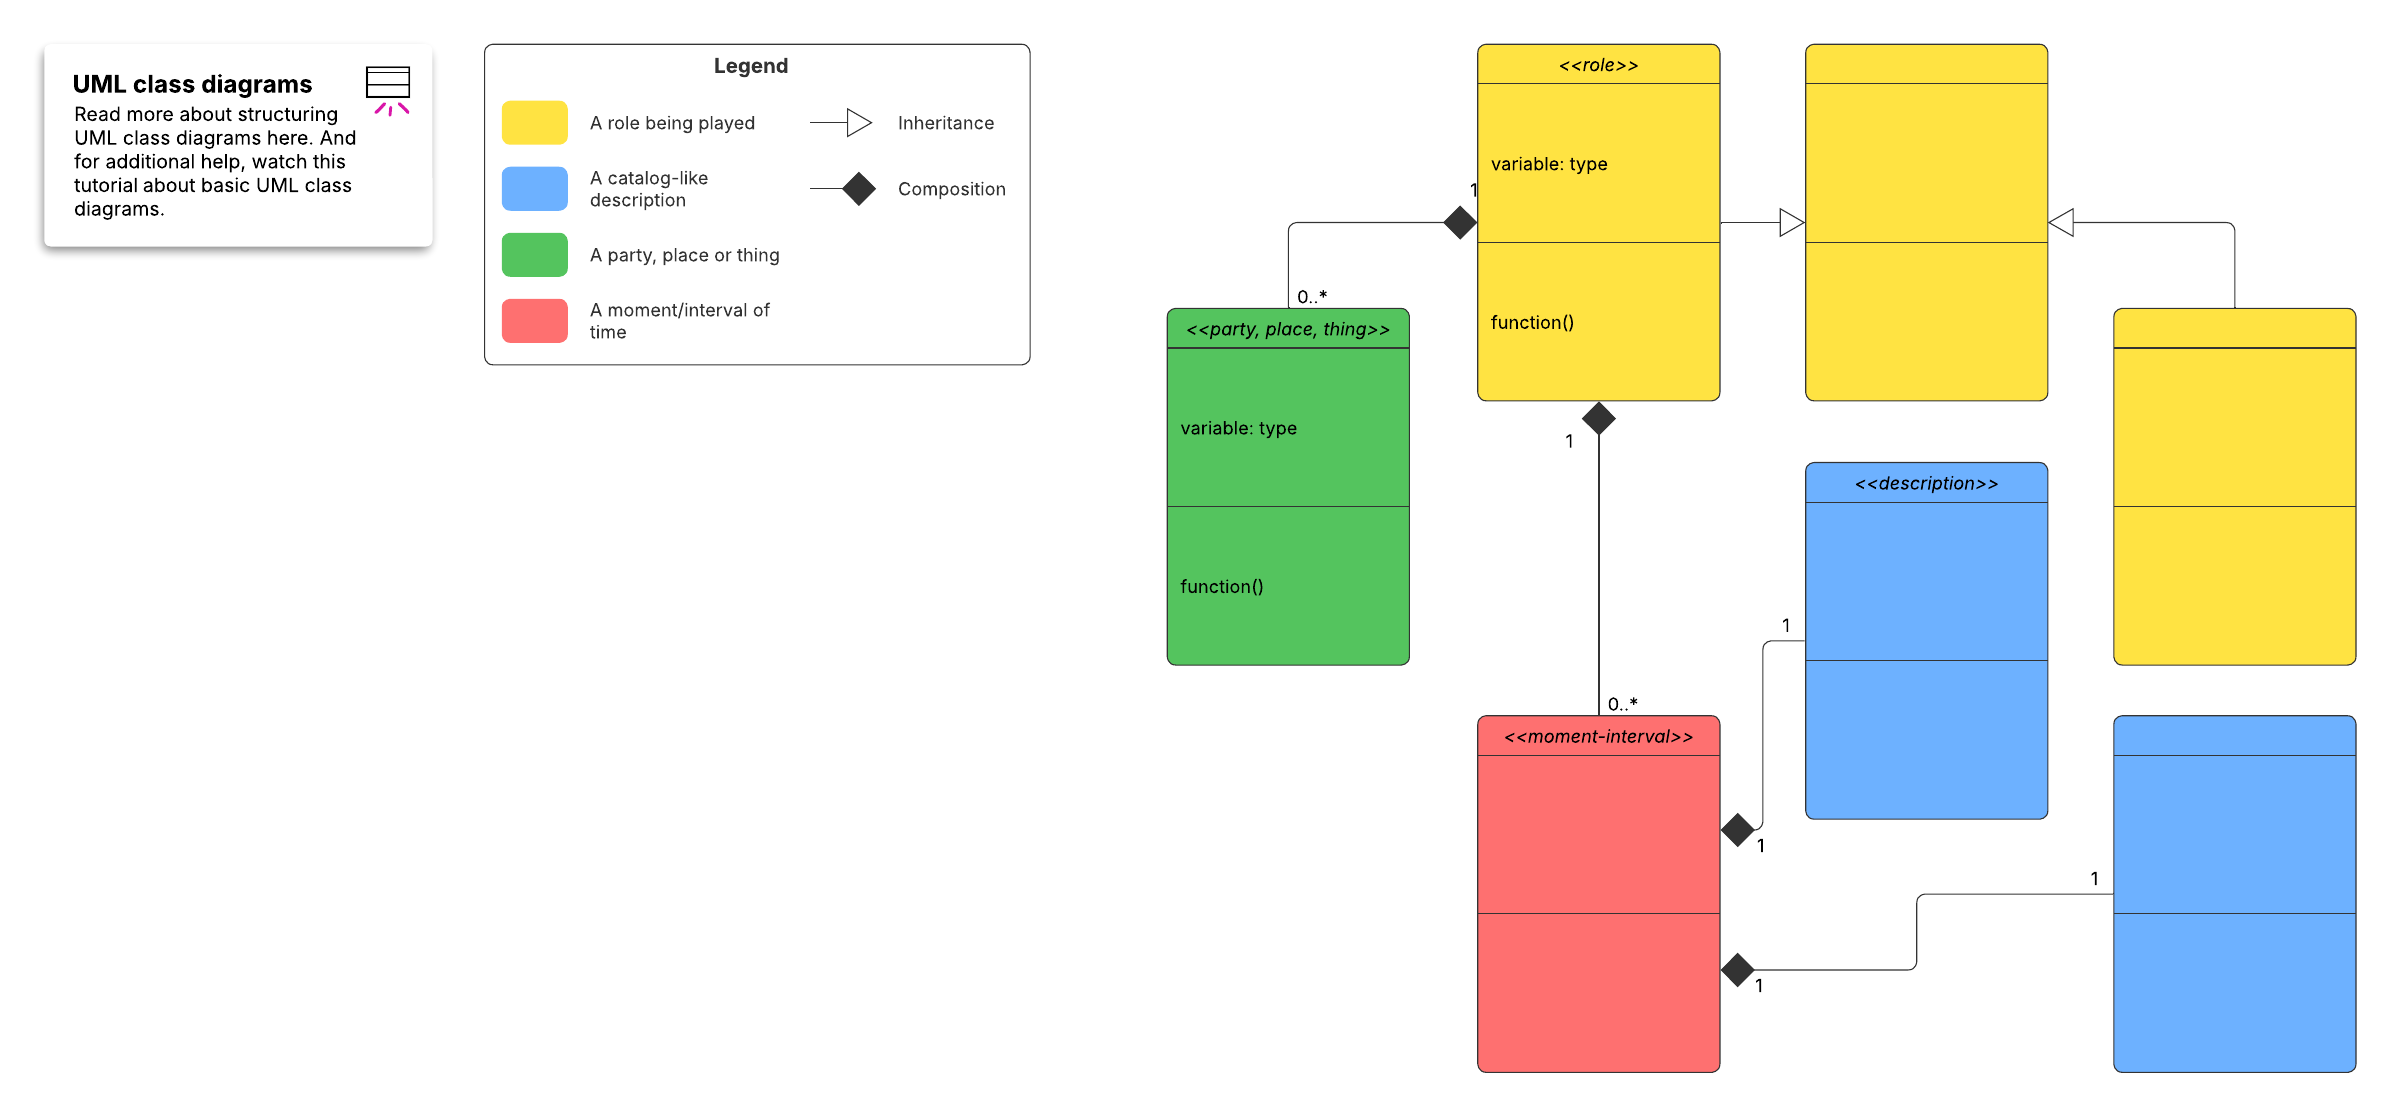
Class attributes are represented by a rectangle with two tabs that indicates a software element.
Links
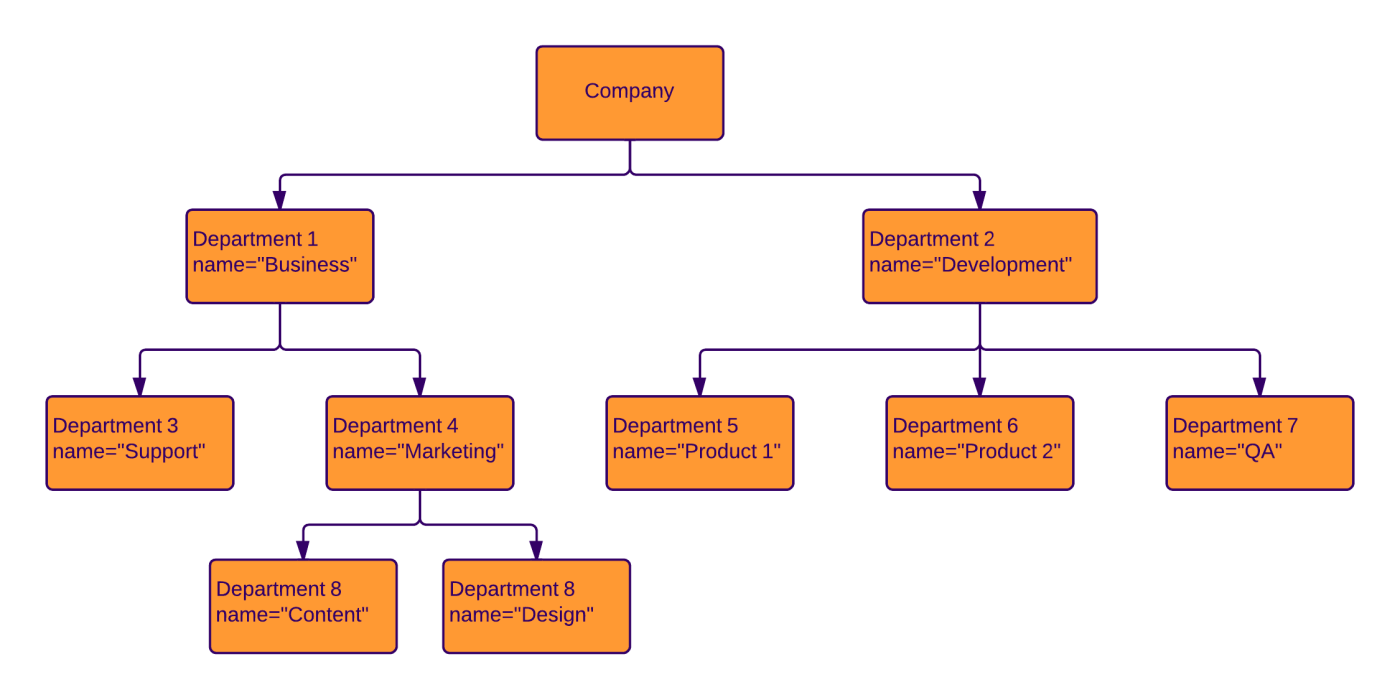
Links are the lines that connect two shapes of an object diagram to each other. The corporate object diagram below shows how departments are connected in the traditional organizational chart style.
Object diagram applications
A developer will find object diagrams useful in many instances. These include:
-
Examining a specific iteration of a general system.
-
Getting a high-level overview of the system you will develop.
-
Testing a class diagram you’ve created for the overall structure of the system, using object diagrams for specific use cases.
Other UML object diagram examples
UML specifications typically don't change when you describe an object diagram in different programming languages. The whole purpose of UML is for developers to plan out software independent of specific platforms. Below are two of the most commonly used types of object diagrams in different programming languages.
Swift diagram
The successor to Objective-C, Swift is a programming language for developing iOS and macOS solutions. Swift is designed to work with the codebase written in Objective-C for Apple products and is the programming language of choice for most Apple marketplace applications. Developers can use Swift to create instances for an iPhone app or other Apple devices.
Java object diagram
There are object diagrams that can be used in UML to describe instances that would ultimately be programmed in Java, and there are diagrams that describe Java objects that have nothing to do with UML. Whether you are looking for the former or the latter, Lucidchart can help you map the structure you need to create. Try it out for yourself.
How to draw an object diagram in UML
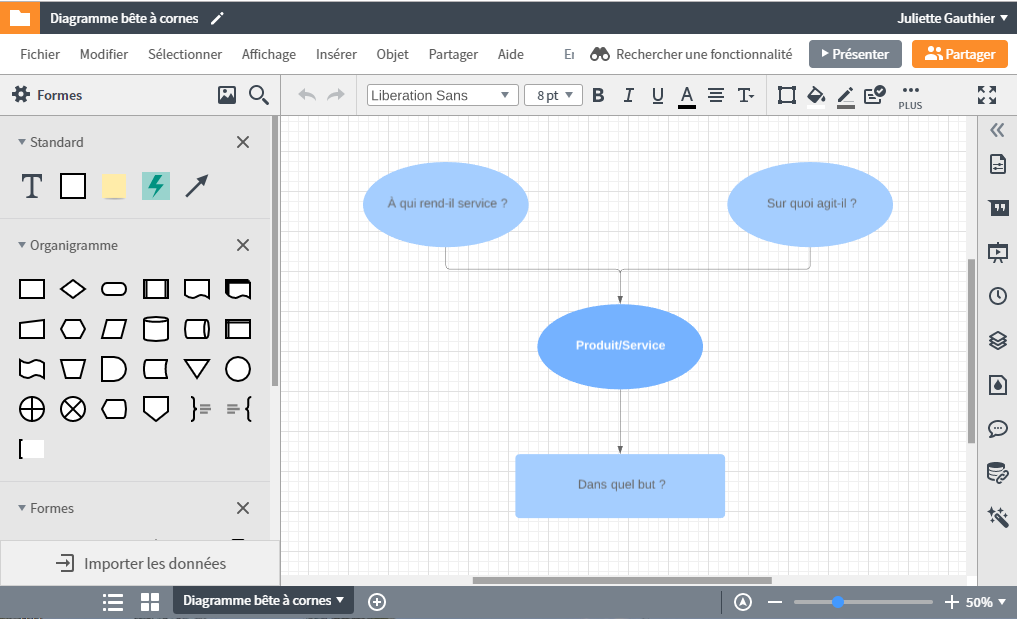
1. Get started with Lucidchart
To create your very own UML object diagram, we recommend that you sign up for a free Lucidchart account. Lucidchart was created specifically for creating technical diagrams like these, and its simple drag-and-drop interface will help you finish your diagram in no time.
Once you have signed up for Lucidchart, select Create New Document > Blank UML. The UML shape libraries will appear on the left side of the canvas.
2. Add shapes
Object diagrams are one of the simplest types of UML diagrams. Visually, they resemble a simplified class diagram. Objects are represented by simple rectangle shapes. You can include subdivisions in the rectangle to separate the title from its attributes. These shapes are then connected by lines that show the relationship between objects.
For a basic rectangle, drag out the simple class shape from the UML Class Diagram section.

Add lines
One of the advantages of using Lucidchart to build object diagrams is that you have a high degree of control over line styles. For this diagram, we’ll use a solid diamond for the origin of the line, a solid black line, and an arrow on the end of the line. These styles will help the viewer see how all three accounts depend on the bank.
Create a line by dragging your mouse from the red circle that appears when you hover over the first object. A dialog will appear: Choose a rounded rectangle for the next shape. To add text in a shape in Lucidchart, simply double-click inside it.

Add color
Object diagrams are designed to give a bird’s-eye view of a software system. To improve the readability of your diagram, add color to easily differentiate between objects.
Think about the overarching category of each object (rectangle) in your diagram. For example, in a banking object diagram, we’re specifying accounts. We’ll use “Account 1: Savings” as the class title for this object.
Add attributes
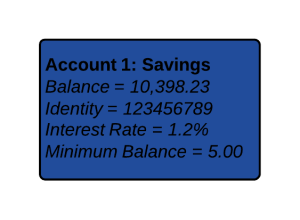
Attributes do not need to be obscure. In this object, we’ve added the major identifiers of this particular savings account (balance, identity, interest rate, and minimum balance) as a list of class attributes after the title. In Lucidchart, simply press Enter to start a new line. It’s easy to see how the particular attributes would change for a different object (like a checking account, which would have a different interest rate) or the same object in a different scenario (savings account A will have a different ID with the bank than savings account B).
Format object diagram
Lucidchart allows you to style your flowchart with customizable colors, fonts, and image import. Let’s keep this diagram simple by making the class title bold. After you select a shape, you can change the fill background from the top toolbar. Varying the color of objects makes it easy to distinguish accounts at a glance.
Add icons
To further customize your object diagram, use Lucidchart’s icon finder feature to search for an applicable icon on the left side of your screen.

Add an icon to your object diagram to improve your ability to understand the diagram at a quick glance.

3. Publish, implement, and share
After you finish your document, sharing it with others is a likely next step. You can add diagrams to any document in Microsoft Office, G Suite, Confluence, or other popular application quickly and easily, thanks to Lucidchart integrations. To download your object diagram, simply click File > Download As and the desired file type.
If you wish to collaborate with co-workers, however, you'll want to share your document. To share your document, click the orange "Share" button in the top-right corner of the editor. From this menu, you will be able to easily share your object diagram with both Lucidchart users and non-users or post the diagram to social media.