SysML diagram

UML diagrams vs. SysML diagrams

Reading time: about 8 min

Topics:

  • Diagramming
  • IT and Engineering
  • Product development

There are many different types of graphical and textual modeling languages that help developers in the design and implementation of computer objects, systems, and architectures. These languages follow a set of rules to keep development consistent and to ensure that they can be reused to facilitate faster development, deliver higher-quality apps, provide better compatibility, and reduce the time to market.

Two of these graphical modeling languages are known as UML and SysML. UML is mainly used by software engineers to visualize software systems. SysML is an extension of UML designed for use in systems engineering applications. We will define these modeling languages, explain how they differ from each other, and describe the types of diagrams available in each.

What is a UML diagram?

Unified Modeling Language (UML) is a common, standardized graphical language used in object-oriented programming. It helps you to visualize the design and structure of complex software systems. You use the UML library of integrated diagrams to represent the objects and processes that make up an application or software system. This makes it much easier to visualize and understand the software’s architecture, relationships, and hierarchies than trying to track everything through thousands of lines of code.  

There are several of UML diagram types that fall under two broad categories: structural diagrams and behavioral diagrams. 

  • A structural diagram lets you visualize the static parts that need to be present in a software system. This type of diagram is often used to document software architecture. Examples of structural diagrams include component diagrams and class diagrams.
  • A behavioral diagram lets you visualize the things that happen within the software. This type of diagram helps you to document a software system’s functionality. Examples include activity diagrams and use case diagrams.  

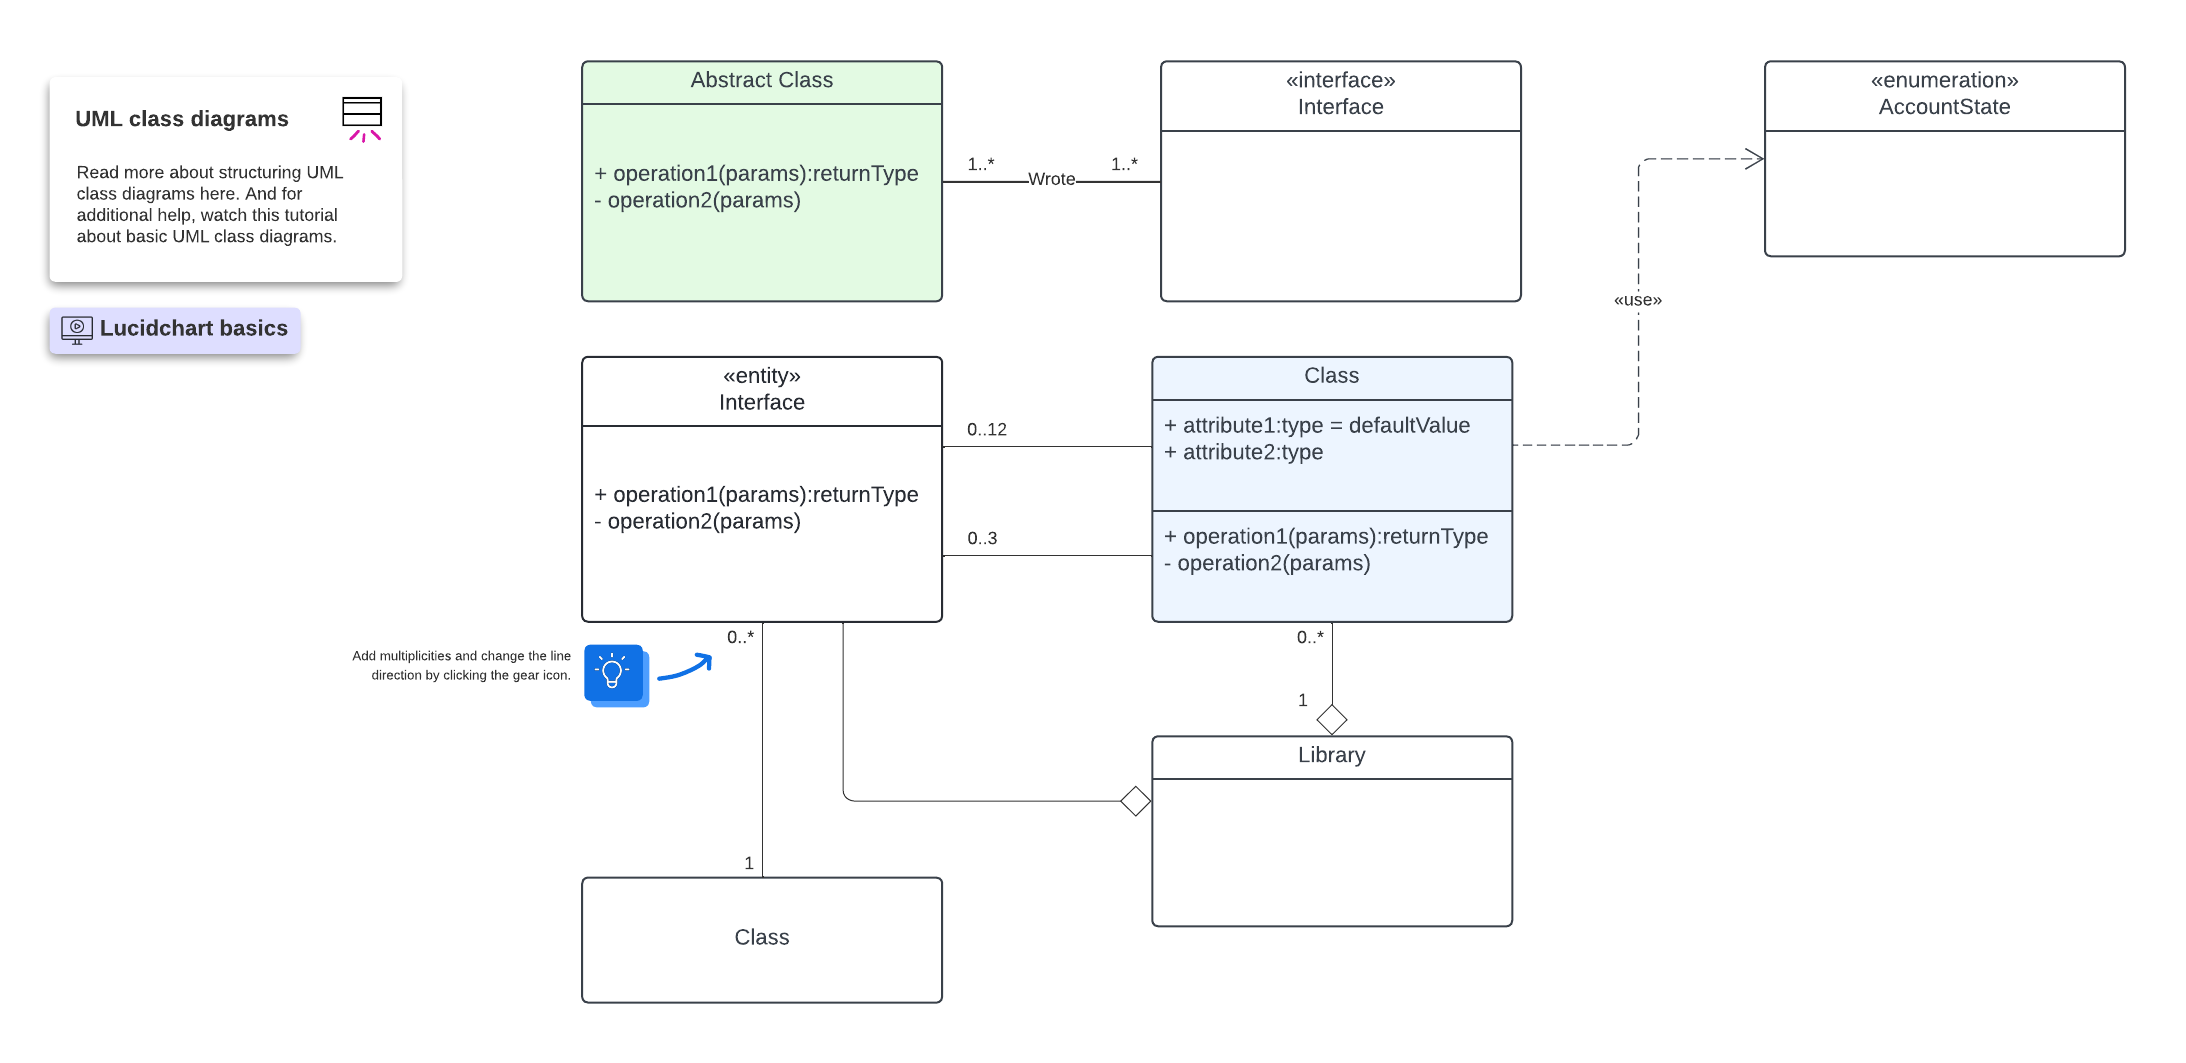
Using UML notation, you can create a visualization that describes and documents your system’s classes, their attributes, operations (or methods), and the relationships among the objects. UML class diagrams also help developers to describe and present systems in a way that is easier for everybody involved in the project to understand.

What is a SysML diagram?

Systems Modeling Language (SysML) is an open-source, general-purpose modeling language. Systems engineers use SysML to create diagrams that illustrate a broad range of systems, including hardware, software, information, processes, personnel, and facilities. SysML lets teams design, analyze, verify, and validate these systems.

SysML is a helpful extension of the Unified Modeling Language (UML) that uses the UML 2 profile mechanism. A UML profile gives you a way to customize the model for particular domains (such as healthcare, financial, education, etc.) and platforms (such as J2EE, .NET, etc.). Profiles are defined using stereotypes, tagged values, and constraints applied to model elements like classes, attributes, operations, and activities.

Why use SysML diagrams?

Systems engineers use SysML diagrams to improve their communication with other team members and business stakeholders. SysML diagrams can help you to explain complex ideas more easily and clearly. 

Other reasons you might want to use SysML diagrams include:

  • Documenting and managing system architecture-related intellectual property, including analytics, designs, and processes
  • Creating a clear overview of system structure so you can manage size and complexity more easily
  • Facilitating problem-solving and system scaling
  • Detecting errors, gaps, and other potential problem areas early in the development of the system

What are the differences between SysML diagrams and UML diagrams?

Because it is an extension of UML, SysML and UML share a lot of similarities. But SysML also offers some improvements over UML. 

  • SysML reduces some of the software-centric restrictions in UML. This means that your SysML diagrams are more flexible and expressive than UML.
  • SysML uses seven of UML 2’s 14 diagrams and adds two additional diagram types: “Requirements” and “Parametric.” The seven diagrams that SysML borrows from UML remain mostly unmodified or include lightweight customizations.
  • SysML can model a wider range of systems, compared to UML being designed only for software development.
  • Because SysML removes a lot of UML’s software constructs, it is a smaller language with fewer diagram types and constructs. This makes it easier to learn and apply.

UML diagram types

UML includes 14 diagrams, seven of which are described below in SysML diagram types. The seven UML diagram types are:

  • Class diagram: A class is a template to create an object. When you have a lot of objects that have the same structure or common behaviors, they can be assigned to a specific class. That class can be used to create other objects that share the same characteristics. A class diagram is used to show a system’s structure, its classes, class attributes and behaviors, and the relationships between each class.
class diagram template
UML class diagram (click on image to modify online)
  • Component diagram: A component diagram is used to show how different components connect to each other to form larger components or systems. These diagrams break down complex systems into smaller parts to help you visualize the relationship among all of the components.
  • Deployment diagram: This type of diagram is used to describe the hardware components of your system where software components will be deployed.
SysML diagram
UML deployment diagram example (click on image to modify online)
  • Composite structure diagram: A composite structure diagram is a static structure diagram used to visualize the internal structure of a class and the collaborations that are possible with the class structure. Composite structure diagrams can depict internal parts and the ports they use to interact with each other. These diagrams can also show the internal components of hardware so you have a better understanding of their inner workings. 
SysML diagram
UML composite structure diagram example (click on image to modify online)
  • Object diagram: These diagrams show an instance of a class diagram and its data structure at a specific time. They represent a static view or snapshot of a system at a particular moment.
  • Communication diagram: Communication diagrams used to be called collaboration diagrams in UML 1.x. They describe interactions between objects and parts using sequenced messages. These diagrams are used to model how objects relate to each other and how they associate and connect through messages within a system. 
SysML diagram
UML communication diagram example (click on image to modify online)
  • Timing diagram: This type of interaction diagram is used to visualize object behavior and interactions over a given time period. Timing diagrams show you how long it takes to complete each process step so you can find ways to improve.

SysML diagram types

Here are the nine SysML diagram types:

  • Requirements diagram: This is a static structural diagram that shows system requirements and their relationships to other elements in the model. Requirements diagrams are used to specify functional (a function that a system must perform) and non-functional (the criteria used to test function effectiveness) requirements within the model.
  • Parametric diagram: A parametric diagram is used to enforce mathematical rules and constraints. For example, a parametric diagram can define performance and quantitative constraints such as maximum connections, total transactions, and so on.
  • Block definition diagram: A block is a system component such as software, hardware, organizations, facilities, and so on. A block definition diagram is a static diagram used to visualize system components and their contents, interfaces, and relationships. This type of diagram is used to specify the static structures that are used for control objects, data objects, and interface objects.
  • Internal block diagram: This is a static structural diagram that represents a particular block. The diagram shows the block’s structural contents (parts, properties, connectors, ports, and interfaces).
  • Package diagram: A package is the organization of model elements, such as use cases or classes, into groups. Package diagrams are static structural diagrams that help you to visualize relationships and dependencies among packages and package contents in a system. Package diagrams are used to help you make sense of and to manage complex system architecture models. 
  • Use case diagram: This diagram is used to visualize how users (called actors) interact with the system. An actor can be a person, an organization, a facility, software systems, and hardware systems. Use these diagrams to represent a high-level view of the relationships between actors and systems. A use case diagram can help you to more easily explain a system to a less technical audience.
  • Activity diagram: An activity represents various behaviors that are triggered within the system. An activity diagram lets you visualize the steps that need to be performed to complete an activity. Activities can be sequential, branched, or concurrent. This SysML diagram type is used to specify dynamic behaviors of a system.
  • Sequence diagram: Sometimes referred to as an event diagram or even scenario, sequence diagrams are used to show the order of interaction of different objects. These diagrams can help you to visualize simple runtime scenarios. 
  • State diagram: This is a dynamic behavioral diagram used to visualize states and transitions. A state refers to the condition or situation during the life of an object within a system. This type of diagram helps you to see all possible states and how each object transitions from one state to the next.  

UML diagrams in Lucidchart

Ready to try your hand at making a UML diagram in Lucidchart? We’ve built a tutorial to help, whether you want to create your own diagram from scratch or use a Lucidchart template. 

SysML diagram

Our UML diagram tutorial will help you make a custom diagram or get a jumpstart with a template.   

Learn more

Lucidchart

Lucidchart, a cloud-based intelligent diagramming application, is a core component of Lucid Software's Visual Collaboration Suite. This intuitive, cloud-based solution empowers teams to collaborate in real-time to build flowcharts, mockups, UML diagrams, customer journey maps, and more. Lucidchart propels teams forward to build the future faster. Lucid is proud to serve top businesses around the world, including customers such as Google, GE, and NBC Universal, and 99% of the Fortune 500. Lucid partners with industry leaders, including Google, Atlassian, and Microsoft. Since its founding, Lucid has received numerous awards for its products, business, and workplace culture. For more information, visit lucidchart.com.

Related articles

Bring your bright ideas to life.

Sign up free

or continue with

Sign in with GoogleSign inSign in with MicrosoftSign inSign in with SlackSign in

Get started

  • Pricing
  • Individual
  • Team
  • Enterprise
  • Contact sales
PrivacyLegal

© 2024 Lucid Software Inc.