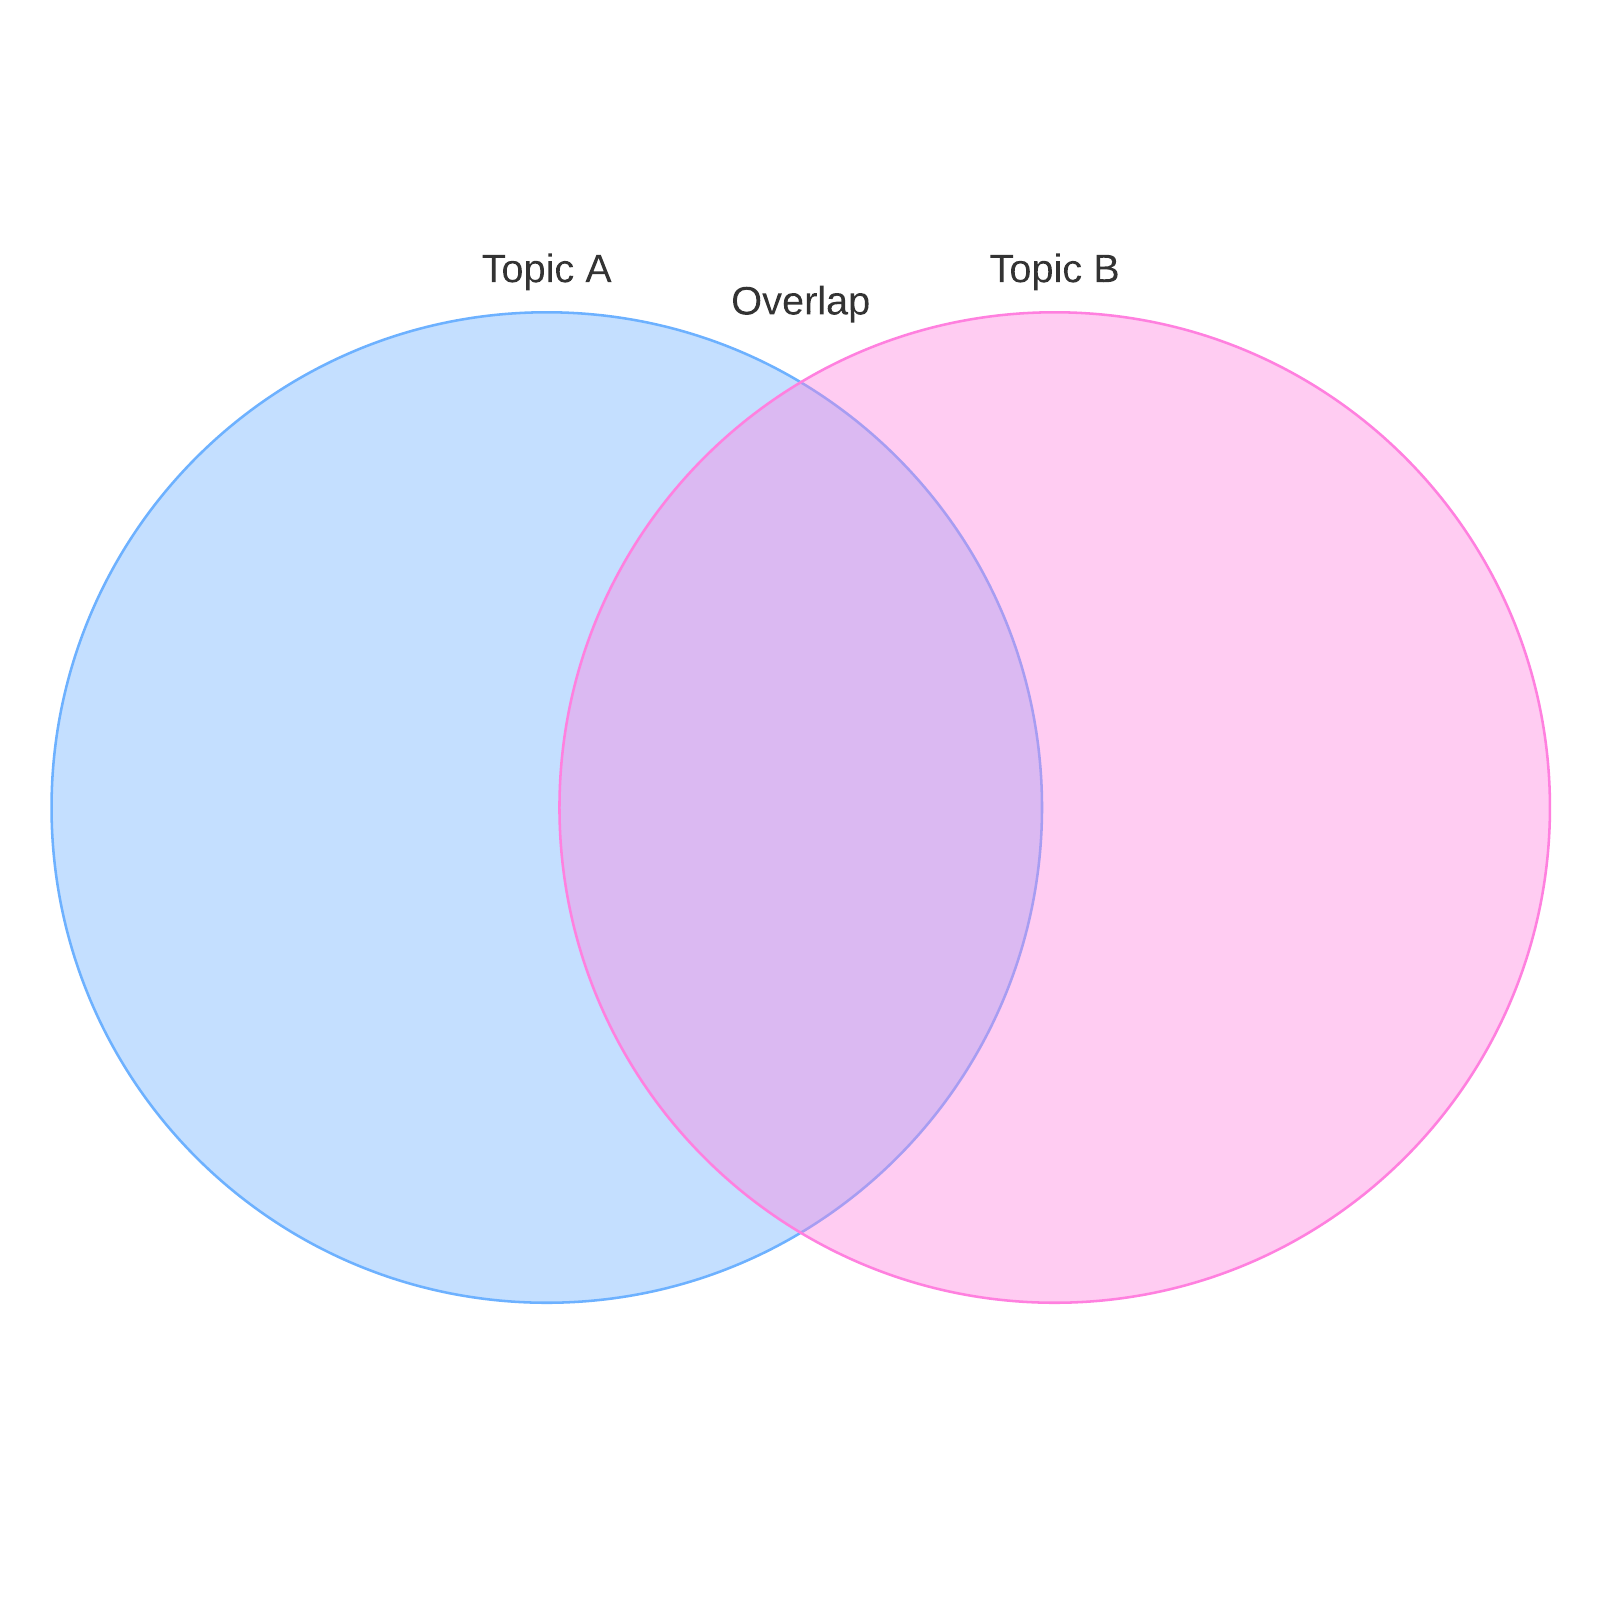
What is a Venn diagram?
A Venn diagram uses overlapping circles or other shapes to illustrate the logical relationships between two or more sets of items. Often, they serve to graphically organize things, highlighting how the items are similar and different.
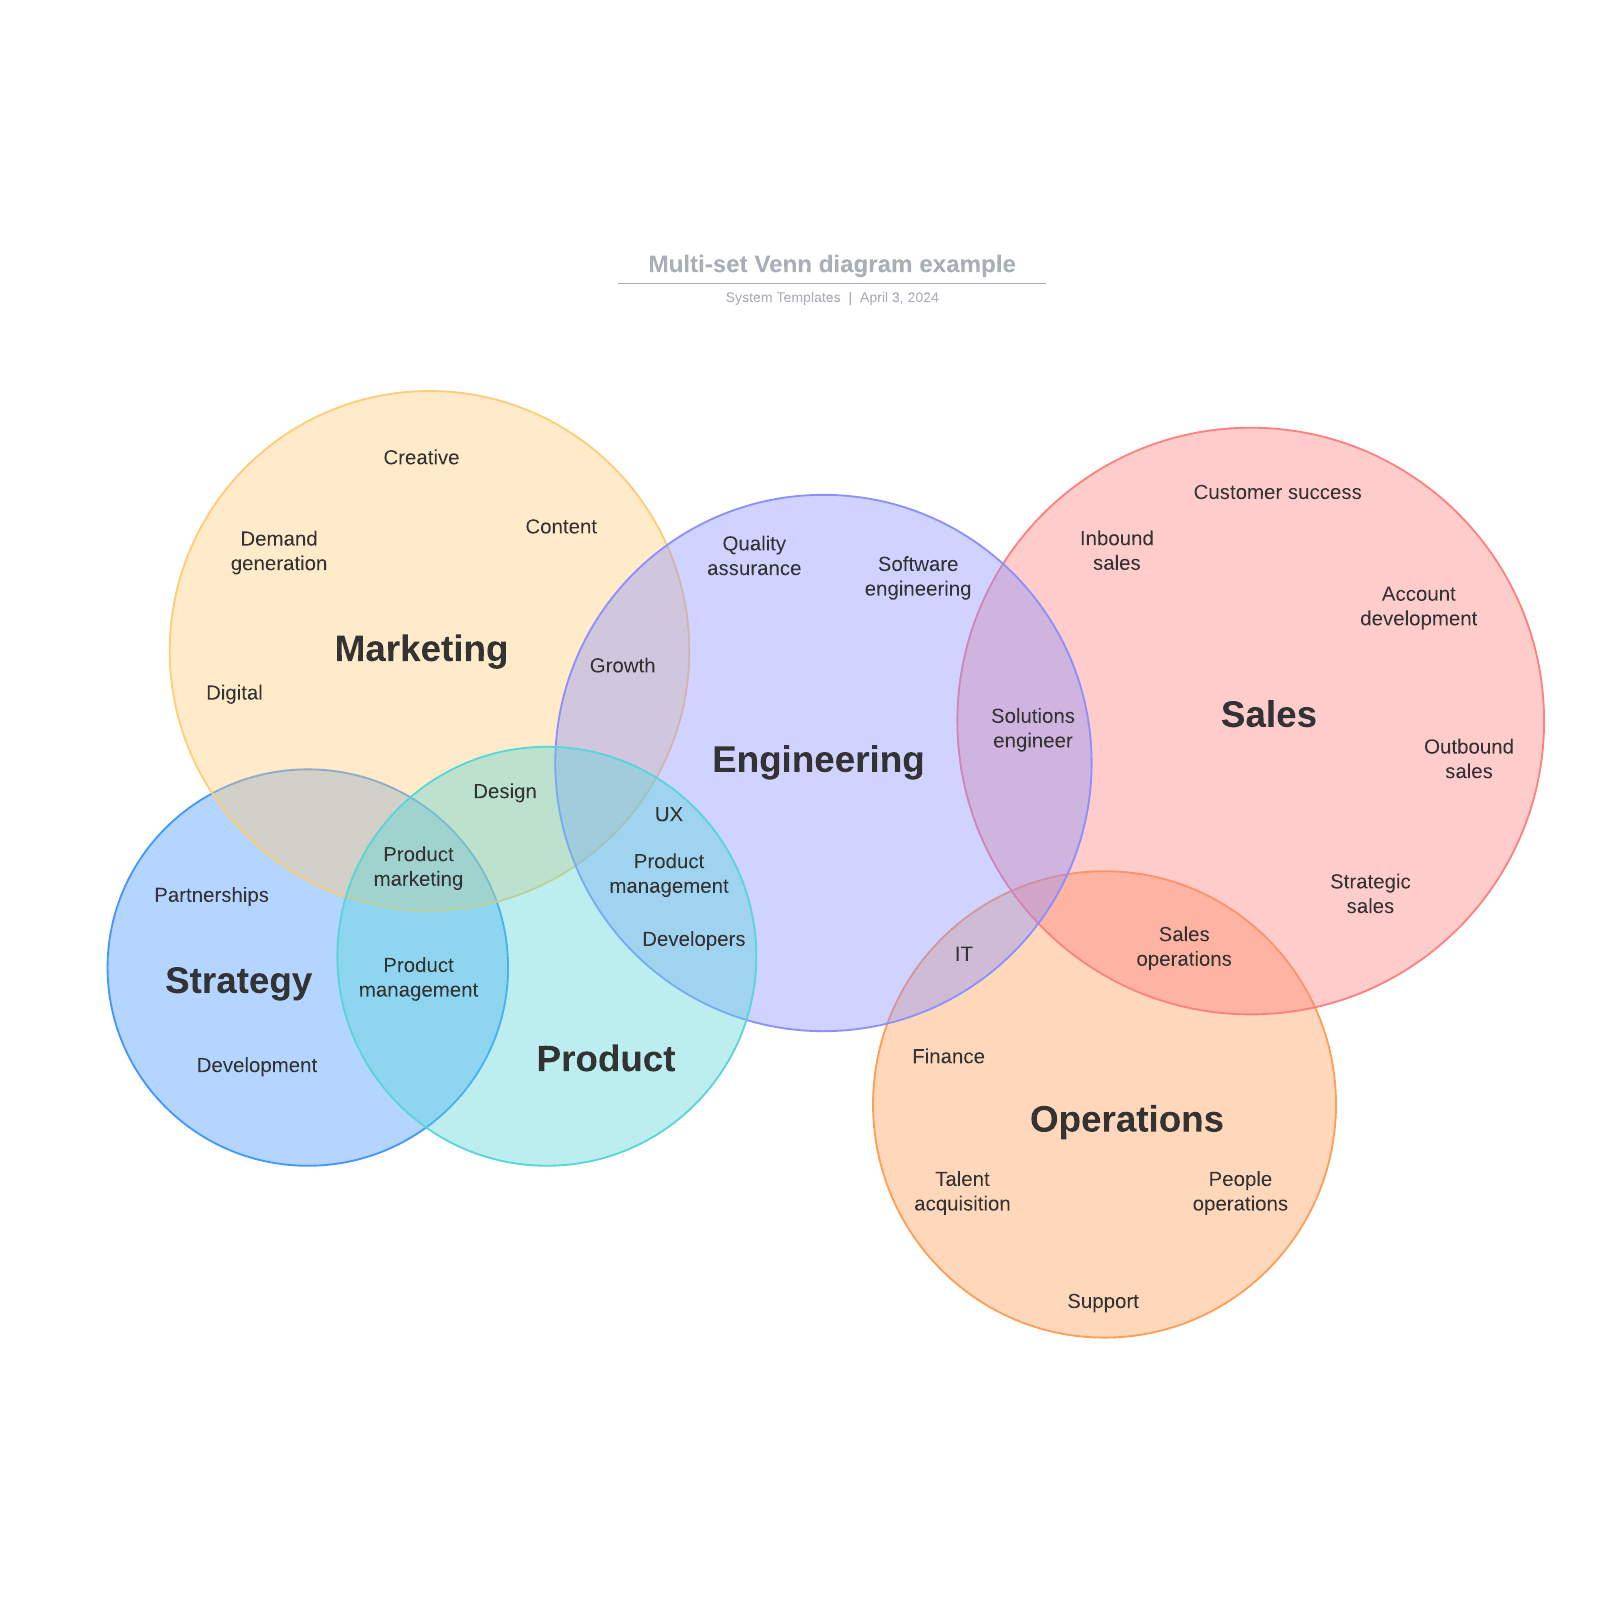
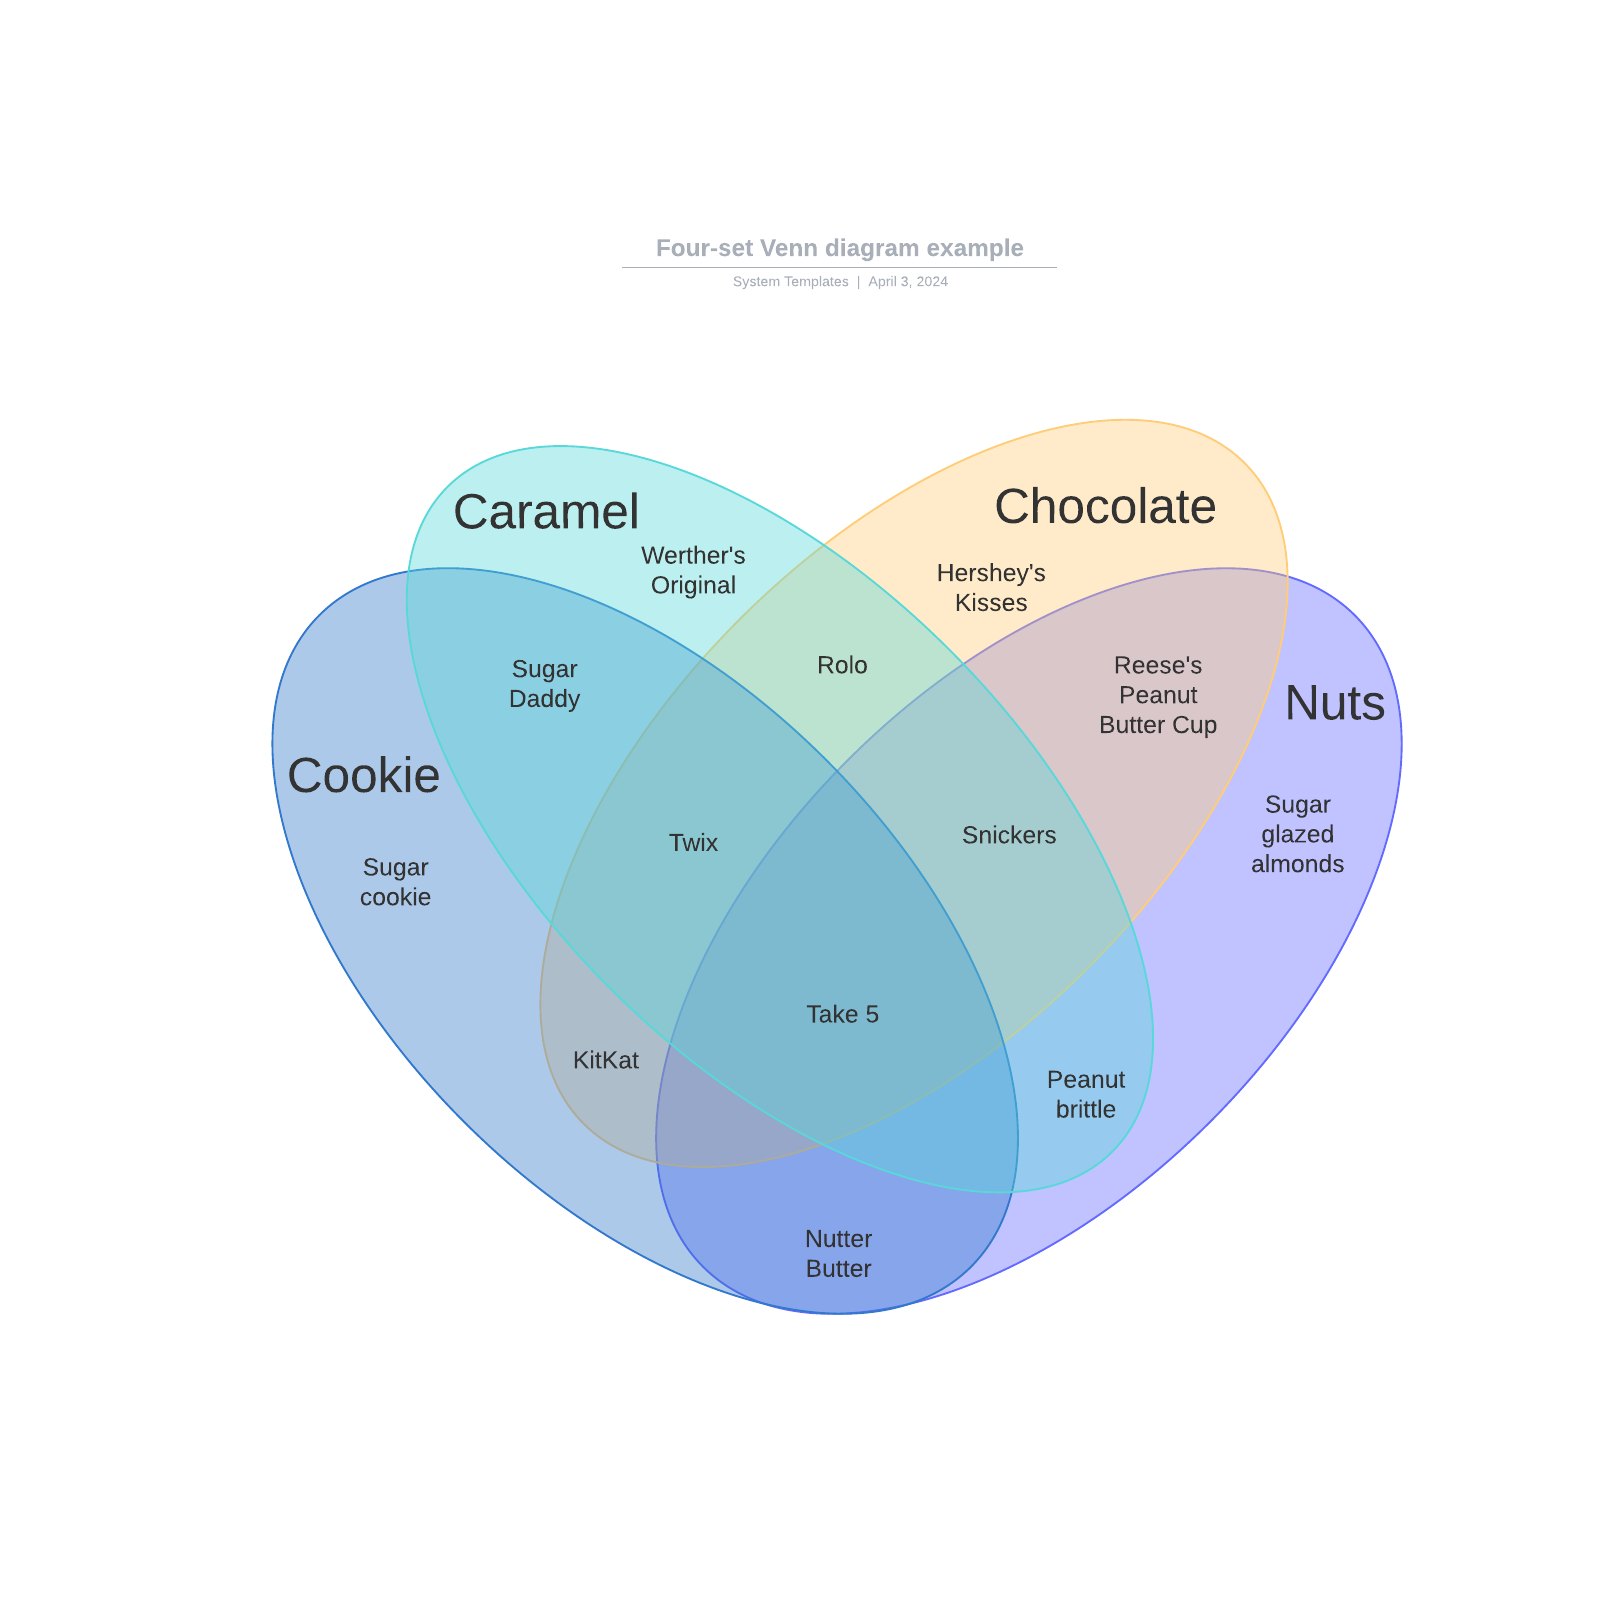
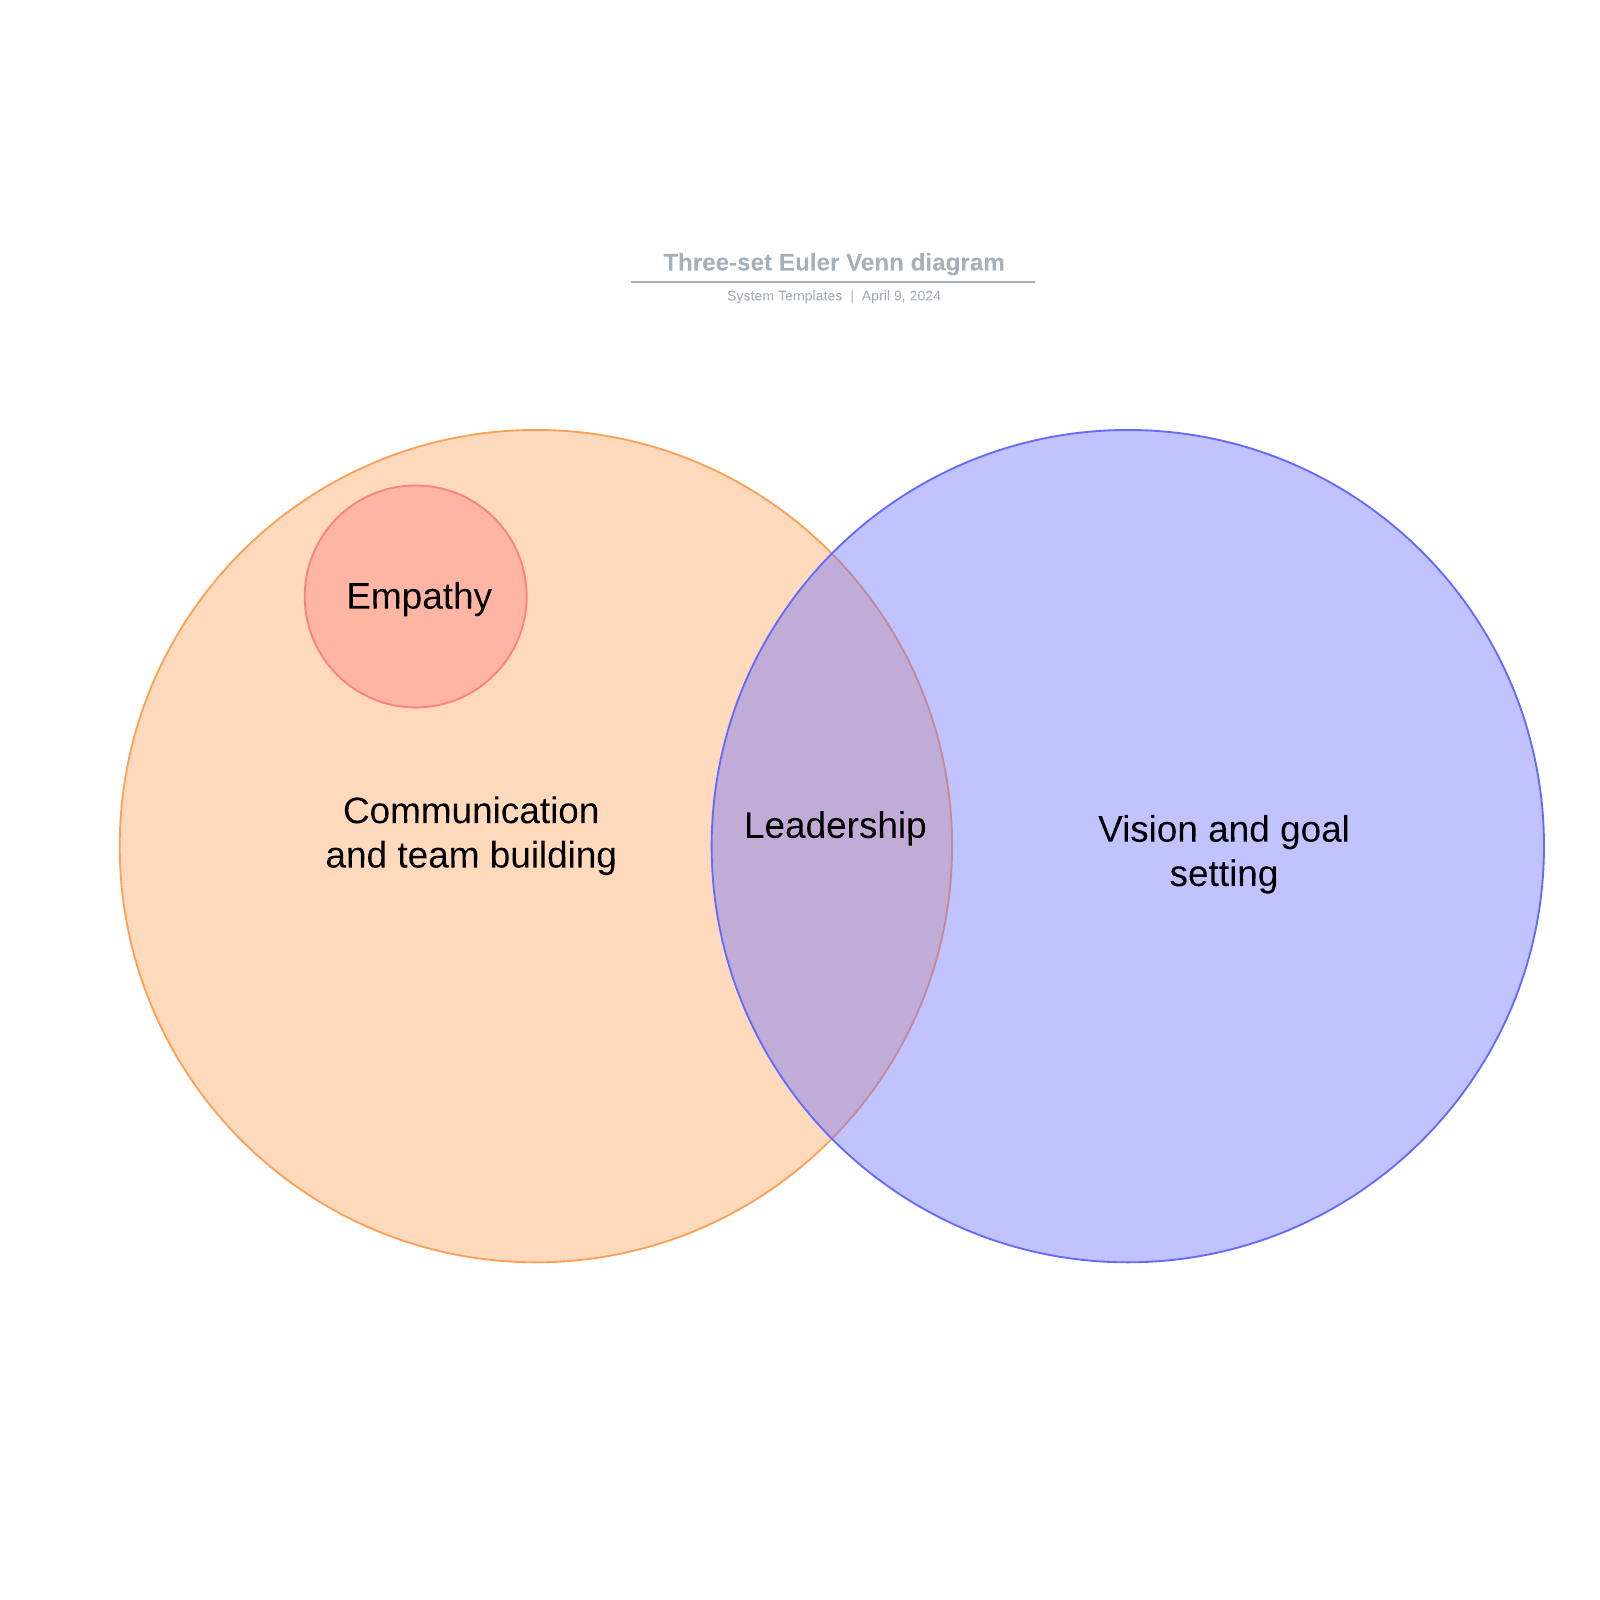
Venn diagrams, also called Set diagrams or Logic diagrams, are widely used in mathematics, statistics, logic, teaching, linguistics, computer science and business. Many people first encounter them in school as they study math or logic, since Venn diagrams became part of “new math” curricula in the 1960s. These may be simple diagrams involving two or three sets of a few elements, or they may become quite sophisticated, including 3D presentations, as they progress to six or seven sets and beyond. They are used to think through and depict how items relate to each within a particular “universe” or segment. Venn diagrams allow users to visualize data in clear, powerful ways, and therefore are commonly used in presentations and reports. They are closely related to Euler diagrams, which differ by omitting sets if no items exist in them. Venn diagrams show relationships even if a set is empty.


Master the basics of Lucidchart in 3 minutes
- Create your first diagram from a template or blank canvas or import a document.
- Add text, shapes, and lines to customize your diagram.
- Learn how to adjust styling and formatting.
- Locate what you need with Feature Find.
- Share your diagram with your team to start collaborating.
Venn diagram use cases
- Math: Venn diagrams are commonly used in school to teach basic math concepts such as sets, unions and intersections. They’re also used in advanced mathematics to solve complex problems and have been written about extensively in scholarly journals. Set theory is an entire branch of mathematics.
- Statistics and probability: Statistics experts use Venn diagrams to predict the likelihood of certain occurrences. This ties in with the field of predictive analytics. Different data sets can be compared to find degrees of commonality and differences.
- Logic: Venn diagrams are used to determine the validity of particular arguments and conclusions. In deductive reasoning, if the premises are true and the argument form is correct, then the conclusion must be true. For example, if all dogs are animals, and our pet Mojo is a dog, then Mojo has to be an animal. If we assign variables, then let’s say dogs are C, animals are A, and Mojo is B. In argument form, we say: All C are A. B is C. Therefore B is A. A related diagram in logic is called a Truth Table, which places the variables into columns to determine what is logically valid. Another related diagram is called the Randolph diagram, or R-Diagram, after mathematician John F. Randolph. It uses lines to define sets.
- Linguistics: Venn diagrams have been used to study the commonalities and differences among languages.
- Teaching reading comprehension: Teachers can use Venn diagrams to improve their students’ reading comprehension. Students can draw diagrams to compare and contrast ideas they are reading about.
- Computer science: Programmers can use Venn diagrams to visualize computer languages and hierarchies.
- Business: Venn diagrams can be used to compare and contrast products, services, processes or pretty much anything that can depicted in sets. And they’re an effective communication tool to illustrate that comparison.
On a lighter note: Venn diagrams hit the small screen
Not many diagrams have crossed over into popular culture, but the esteemed Venn diagram has.
- Drama: In the CBS TV show NUMB3RS, produced from 2005 to 2010, math genius Charles Eppes uses a Venn diagram to determine which suspects match a description and have a history of violence.
- Comedy: On NBC’s Late Night with Seth Meyers, the comedian has a recurring routine called “Venn Diagrams,” comparing two seemingly unrelated items to find their funny commonality (he hopes.)
Steps to draw and use a basic Venn diagram
- Determine your goal. What are you comparing, and why? This will help you to define your sets.
- Brainstorm and list the items in your sets, either on paper or with a platform like Lucidchart.
- Now, use your diagram to compare and contrast the sets. You may see things in new ways and be able to make observations, choices, arguments or decisions.
Venn diagram history
Venn diagrams are named after British logician John Venn. He wrote about them in an 1880 paper entitled “On the Diagrammatic and Mechanical Representation of Propositions and Reasonings” in the Philosophical Magazine and Journal of Science.
But the roots of this type of diagram go back much further, at least 600 years. In the 1200s, philosopher and logician Ramon Llull (sometimes spelled Lull) of Majorca used a similar type of diagram, wrote author M.E. Baron in a 1969 article tracing their history. She also credited German mathematician and philosopher Gottfried Wilhelm von Leibnitz with drawing similar diagrams in the late 1600s.
In the 1700s, Swiss mathematician Leonard Euler (pronounced Oy-ler) invented what came to be known as the Euler Diagram, the most direct forerunner of the Venn Diagram. In fact, John Venn referred to his own diagrams as Eulerian Circles, not Venn Diagrams. The term Venn Diagrams was first published by American philosopher Clarence Irving (C.I.) Lewis in his 1918 book, A Survey of Symbolic Logic.
Venn Diagrams continued to evolve over the past 60 years with advances by experts David W. Henderson, Peter Hamburger, Jerrold Griggs, Charles E. “Chip” Killian and Carla D. Savage. Their work concerned symmetric Venn Diagrams and their relationship to prime numbers, or numbers indivisible by other numbers except 1 and the number itself. One such symmetric diagram, based on prime number 7, is widely known in math circles as Victoria.
Other notable names in the development of Venn Diagrams are A.W.F. Edwards, Branko Grunbaum and Henry John Stephen Smith. Among other things, they changed the shapes in the diagrams to allow simpler depiction of Venn Diagrams at increasing numbers of sets.
Venn diagram purpose and benefits
- To visually organize information to see the relationship between sets of items, such as commonalities and differences. Students and professionals can use them to think through the logic behind a concept and to depict the relationships for visual communication. This purpose can range from elementary to highly advanced.
- To compare two or more choices and clearly see what they have in common versus what might distinguish them. This might be done for selecting an important product or service to buy.
- To solve complex mathematical problems. Assuming you’re a mathematician, of course.
- To compare data sets, find correlations and predict probabilities of certain occurrences.
- To reason through the logic behind statements or equations, such as the Boolean logic behind a word search involving “or” and “and” statements and how they’re grouped.
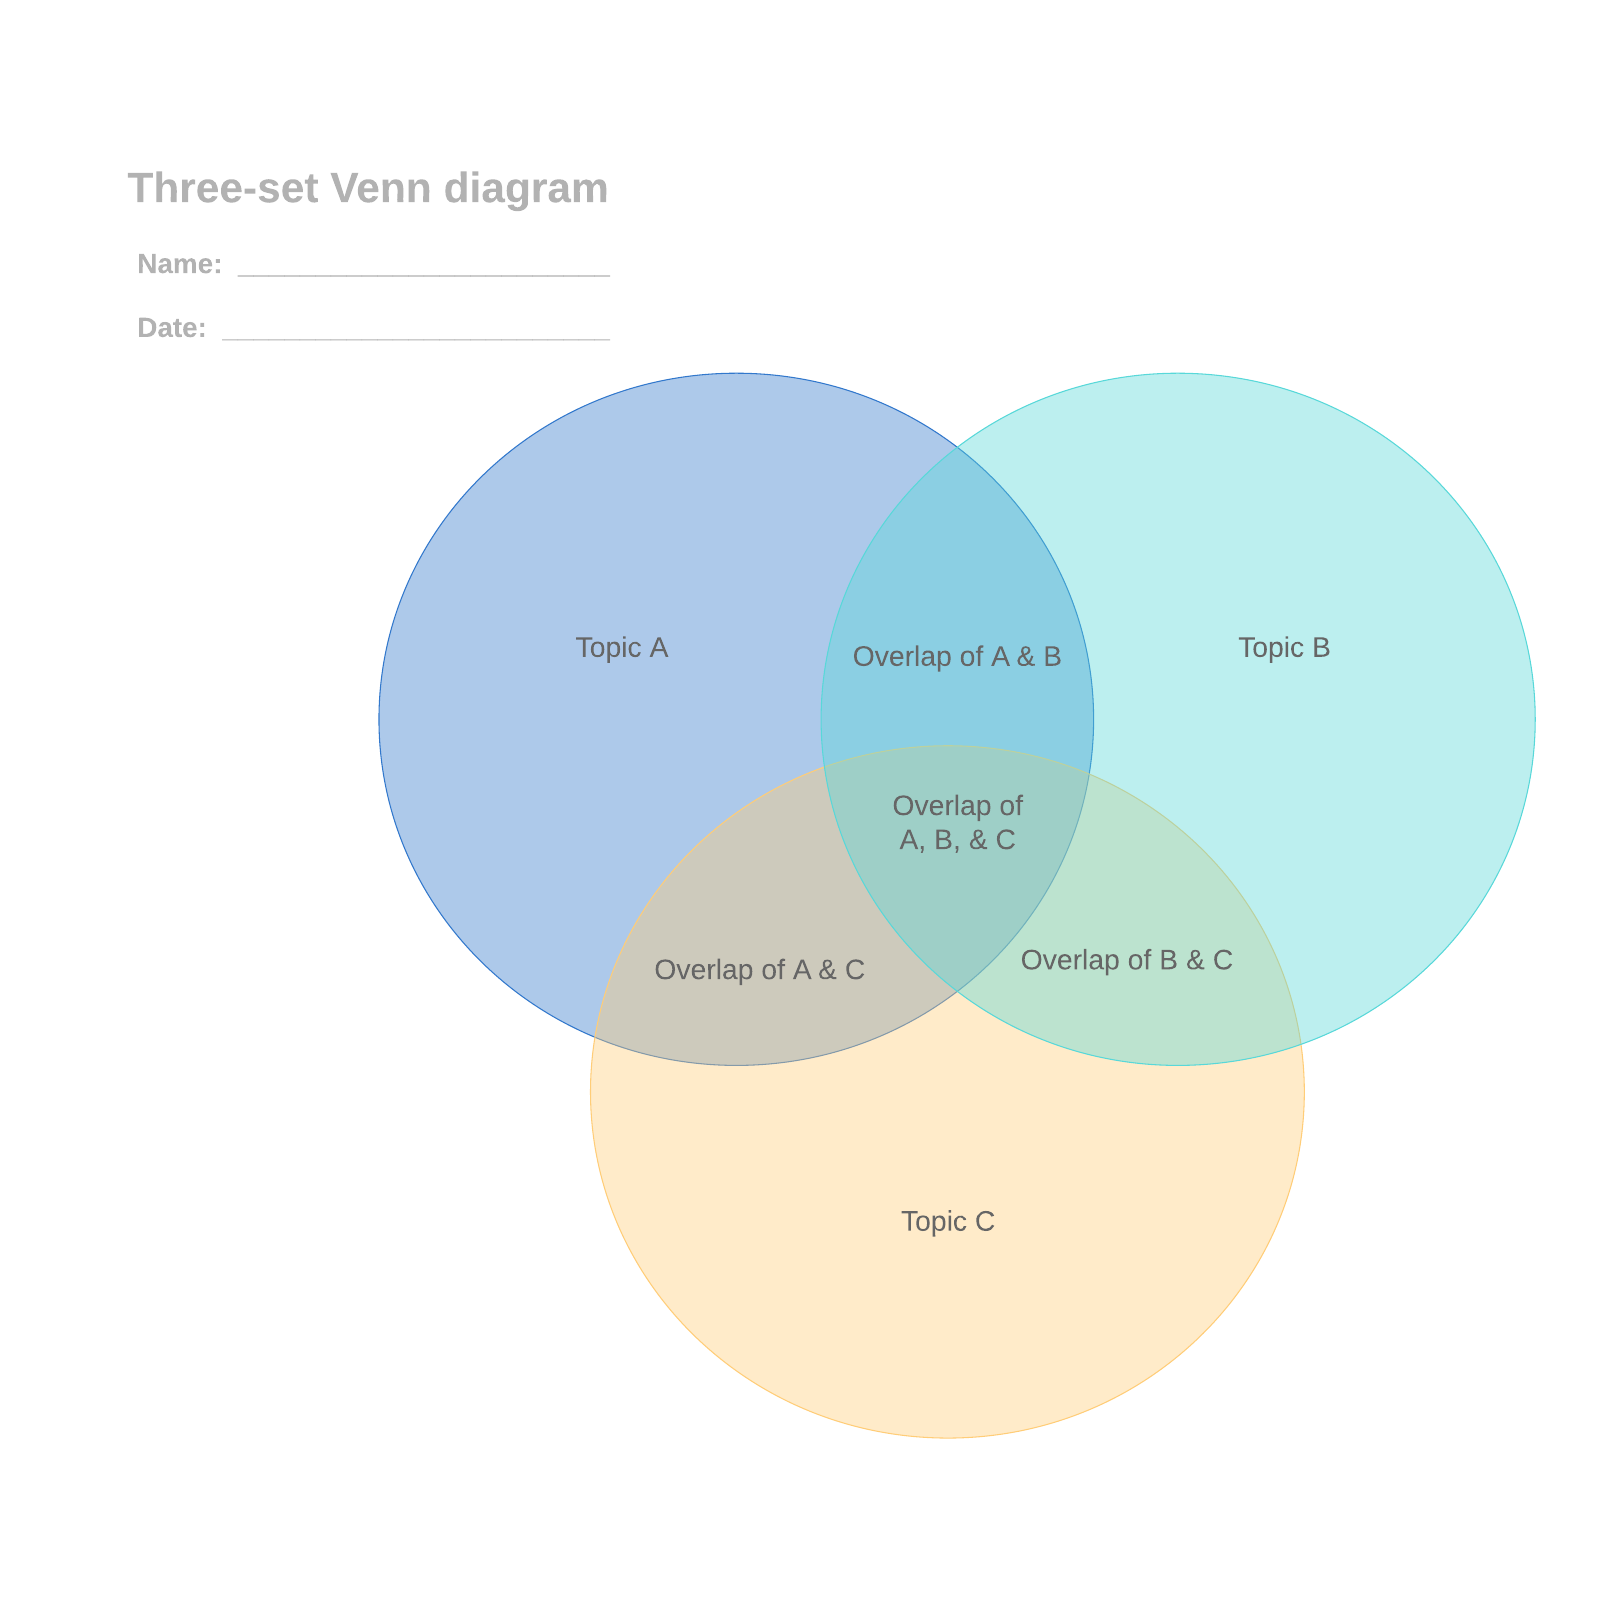
Example Venn diagram
Say our universe is pets, and we want to compare which type of pet our family might agree on.
Set A contains my preferences: dog, bird, hamster.
Set B contains Family Member B’s preferences: dog, cat, fish.
Set C contains Family Member C’s preferences: dog, cat, turtle, snake.
The overlap, or intersection, of the three sets contains only dog. Looks like we’re getting a dog.
Of course, Venn diagrams can get a lot more involved than that, as they are used extensively in various fields.

How to create a Venn diagram in PowerPoint
1. Open a new presentation in PowerPoint.
2. Clean up your canvas by changing the layout. Under Home, go to Layout, and choose the Blank Presentation style.
3. Click the Insert tab and select SmartArt.


Make a Venn diagram in Lucidchart
Lucidchart has several useful features that you won’t find in PowerPoint, allowing you much more flexibility to generate a beautiful Venn diagram. With the ability to format your Venn diagram to your heart’s content, you will be well on your way to creating stunning, professional-looking Venn diagrams.
Follow these simple steps to start on your incredible diagrams:
1. Sign up for a free Lucidchart account
You’re only a click and an email address away from a new Lucidchart account. Just click here—it should take less than a minute.
2. Add shapes or use a Venn diagram template
In Lucidchart, there are a few ways to build a Venn diagram. You can either drag and drop circles to build it manually or you can get a head start with one of our awesome templates.
To add shapes
-
Make sure you have the correct shape libraries open by clicking the “+ Shapes” button and selecting the Venn diagram libraries.
-
When you’re ready to begin, just drag a shape from the toolbox on the left and drop it onto the canvas.
Use a template
-
In Lucidchart, navigate to the "Insert" tab and select "Template."
-
Under "Standard" templates, scroll down to "Brainstorm ideas" and select "Venn diagrams" from the drop-down list. Choose the template you want!
3. Style your Venn diagram
Give your Venn diagram a personal touch by adding custom colors and styles. You can edit Venn Diagram elements just like ordinary shapes, changing the colors, border style, border thickness, and much more.
-
For quick edits, right-click a shape. A menu will appear with popular editing options, like sending an item to the front or back, drawing a line, or switching the shape.
-
To move a shape, click and drag. Drag from an edge or corner to resize, and click and drag the handle icon to rotate.
-
To move multiple shapes, select them by holding down Shift as you click each object, and then drag as needed.
-
To modify text, including alignment and font size, select text and choose options from the properties bar at the top of the page.
-
To alter graphical qualities like fill color and gradients, select the element you want to modify and choose options from the properties bar at the top of the page.
How to make a Venn diagram in Excel
-
Open a new Excel Workbook
-
Write down a list of each category you want to capture in the spreadsheet columns.
-
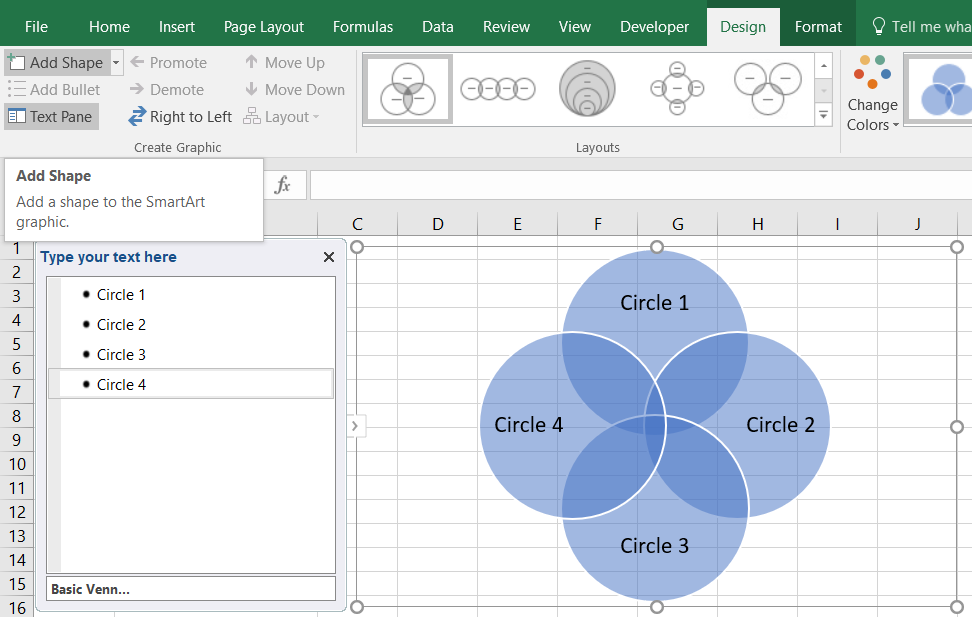
Create your Venn diagram with SmartArt by going into Insert tab and clicking on SmartArt. This will open the SmartArt Graphics Menu.
-
In the Relationship menu choose the Venn diagram template that you want to use.

How to format your Venn diagram in PowerPoint
Add text
Once you have selected the SmartArt Graphic that you want, a dialog box will popup to add text to your Venn diagram. Fill out the text fields for each circle in the bullet point list.

Style your Venn diagram
Right-click one of your Venn diagram circles. Select Format Shape. This will bring up a right-side panel with formatting options for both the text and the shape. Try changing the color—we switched our top circle to red.

Change the design
The standard layout can be spruced up; just click the Design tab. Here, we’ve kept the first theme, but changed the background to the third variant, with a black background, white text and circle outlines, and different shades for our circles.

Here’s what the final Venn diagram designed in PowerPoint looks like:

Let’s say that rather than a PPT file, we want to save our Venn diagram as a PNG image. You can do this by going to File > Export > Change File Type.
How to format your Venn diagram in Excel
Add Titles
To add titles, simply enter the text into the menu that appears after choosing your Venn diagram template. You can then format your titles just like normal text, changing the font, size, color, and much more.

Add Circles to Venn diagram
Adding circles to your diagram is useful if you want to compare more variables. This can be done very easily by following these steps:
-
Click into the diagram
-
In the design tab, click “Add Shape”
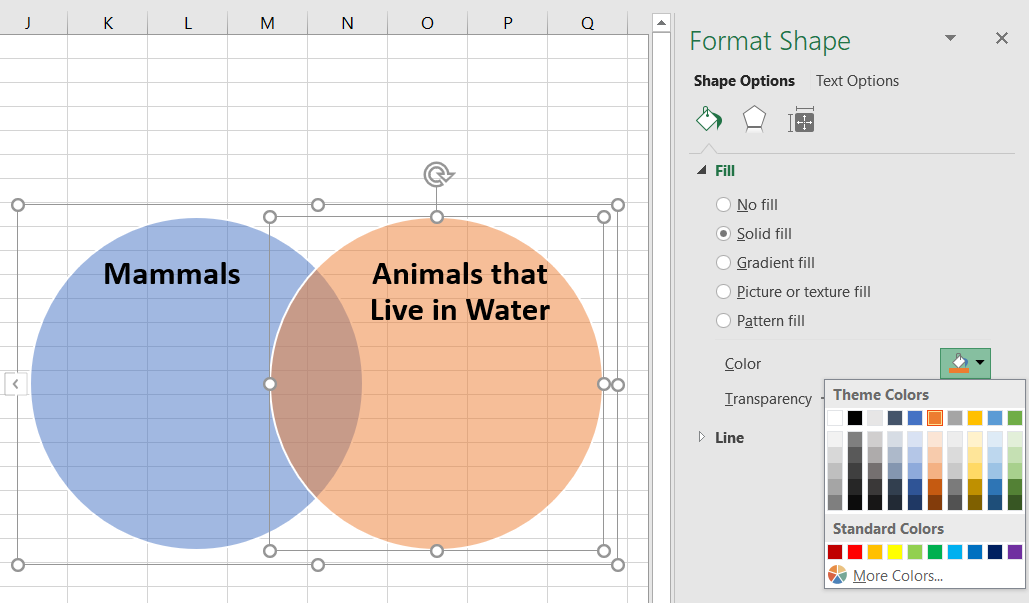
Circles can be deleted by clicking on the shape, and pressing the Delete key. We went ahead and deleted the third circle, and added the titles “Mammals” and “Animals that Live in Water” to our two circles.

Style Your Venn Diagram
To style your circles, right-click on one of them and select Format Shape. Then, change the color in the menu that will appear on the right of the window—we switched the second circle to orange for our example.
Add Content to Circles
Now that you have formatted your Venn diagram how you want, you’re ready to add content to the circles. Follow these steps to add text to your Venn diagram:
-
To include additional text in your diagram, you’ll need to draw text boxes onto the circles.
-
After drawing the text boxes, fill in these boxes with the lists that you already made (see step #2 at the beginning of this tutorial).
-
In this example, we’ve put “Mammals” on one side, and “Animals that Live in Water” on the other. Animals that are both mammals, and water animals occupy the middle, overlapping area of the diagram.

- Complete the diagram by adding all of your text to the appropriate circles.

If you decide to change the style of your diagram, just return to the Design tab to add circles or modify the structure. Be careful, though; the text you’ve added will not automatically snap to shapes and you may end up with an odd-looking diagram.
Venn diagram glossary
|
Set: A collection of things. Given the versatility of Venn diagrams, the things can really be anything. The things may be called items, objects, members or similar terms. 
|
|
Union: All items in the sets. |
|
Intersection: The items that overlap in the sets. Sometimes called a subset. 
|
|
Symmetric difference of two sets: Everything but the intersection. 
|
|
Absolute complement: Everything not in the set. 
|
|
Relative complement : In one set but not the other. 
|
|
Scaled Venn Diagram: Also called Area Proportional. The circles (or other shapes) are sized by their proportional representation of the whole. 
|
|
Reuleaux Triangle: Shape formed from the intersection of three circulars or shapes, such as in a Venn diagram. 
|
|
Set notations: The concepts illustrated in Venn diagrams are expressed with mathematical notations such as those representing sets and subsets (in brackets), unions (with a U-like symbol) and intersections (with an upside-down U symbol.) |
| Set theory: The longstanding branch of mathematics dealing with sets. |