Our professional Gantt chart software can help you plan, organize, and monitor even the most complex projects. Keep reading to learn what a Gantt chart is, what the advantages and disadvantages of using a Gantt chart are, and how to build your own Gantt chart from scratch.
6 minute read
Want to make a Diagram of your own? Try Lucidchart. It's quick, easy, and completely free.
What is a Gantt chart?
Project requirements can be difficult to grasp when listed out, particularly when you’re managing large projects with many overlapping tasks. A Gantt chart is a project management tool used to visualize all tasks from the beginning of a project to its completion.
Structured similarly to a timeline, a Gantt chart lays out individual tasks and their dependencies, task ownership, task duration, and the expected duration of the project as a whole. With each task clearly mapped out and assigned, you and your entire team can easily stay on top of deadlines and make sure everyone is accountable for their work.
Advantages and disadvantages of Gantt charts
There are plenty of pros when it comes to using Gantt charts; however, they’re not made for every project—or every project management style. Familiarize yourself with some of the advantages and disadvantages of the Gantt chart before you decide to implement it.
Advantages:
-
Gantt charts provide both a high-level and detailed view of project requirements.
-
They can easily be used to keep stakeholders and clients informed of deadlines and progress as the project moves forward.
-
These charts are effective in creating deadlines suitable to your entire team, while identifying workarounds for potential roadblocks.
-
A Gantt chart offers a detailed visual reference for project managers and team members, holding individuals and teams accountable for task completion.
-
An organized chart can help project managers visualize task dependencies for more effective planning.
Disadvantages:
-
Gantt charts can be complex visual tools, especially when dealing with complex projects with a large number of tasks.
-
They require constant updating as individual tasks are completed, which can be tedious.
-
Unless you’re using a proficient Gantt chart software, they can become visually overwhelming and difficult to read at a glance.
What are the main parts included in a Gantt chart?
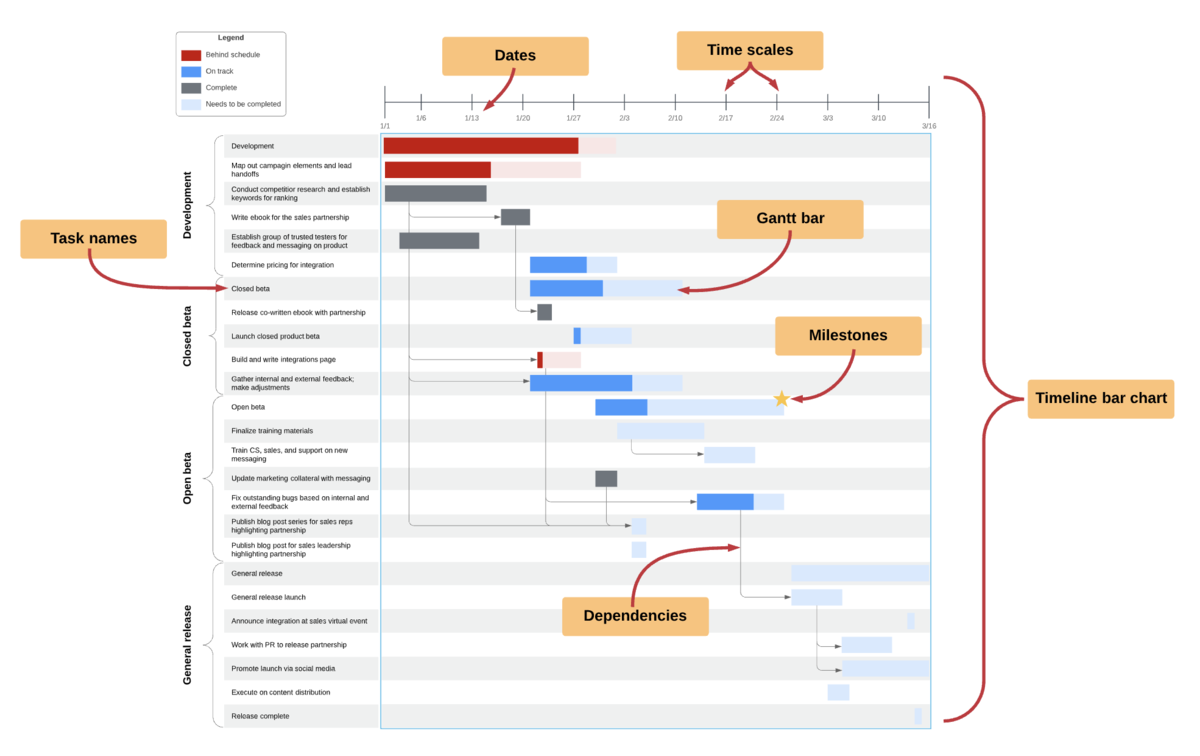
A Gantt chart contains several parts, each one relating to a different aspect of your project. Your Gantt chart may vary slightly, depending on how complex your project is and how detailed you want your chart to be, but it should include the following elements:
-
Timeline bar chart: The timeline bar chart is the overall structure of the Gantt chart. It includes Gantt bars and other symbols used to depict tasks, scheduling, and relationships.
-
Gantt bar: A Gantt bar is a visual representation of a task. It can depict a task’s duration, as well as the type of task, such as a milestone or critical task. They can also represent the percent of a task completed, slack time, and planned vs. actual start and finish dates.
-
Task names: A description of the task.
-
Time scale: The time scale controls the intervals of time depicted within your chart. It can represent hours, days, weeks, etc.
-
Milestones: Milestones are notable goal dates or checkpoints in a project, usually relating to a task completion.
-
Dependencies: Dependencies specify the relationships between tasks, indicating when tasks should begin or end in relationship to another task (or multiple tasks).
-
Dates: Specific dates, usually located along the top of your chart, will mark the expected start and end dates of individual tasks and your overall project.
Diagramming is quick and easy with Lucidchart. Start a free trial today to start creating and collaborating.
Make a diagramWho uses a Gantt chart?
While Gantt charts are most closely associated with project managers working on long-range or waterfall projects, Gantt chart diagramming software has made them more accessible to other roles. Now, anyone with a task list and start and end dates can enter their information into a Gantt chart generator for an instantly organized project.
Gantt charts can be used effectively in the following roles:
-
Project managers: Use Gantt charts to create a detailed reference regarding a project’s expected timeline, task ownership, and more.
-
CEOs: Use Gantt charts to monitor project progress across an entire organization.
-
Marketing managers: Create a Gantt chart to plan and track a marketing campaign.
-
Operations managers: Can use Gantt charts to increase operational efficiency.
-
Scheduling managers: Use detailed Gantt charts to plan out schedules for multiple employees or teams.
-
Team leaders: Make sure that each member of their team is on task and using resources effectively.
-
Consultants: Use a Gantt chart to divide and track tasks between your team, your client’s team, and any subcontractors.
Essential steps to creating a Gantt chart
Building a Gantt chart requires a considerable amount of effort. But, done correctly, it can be a major asset as you plan and complete your project. Take the following steps to build an organized, accurate Gantt chart with all of the information necessary to guide your project from beginning to end:
1. Identify individual tasks
Arguably the most difficult and time-consuming step, you’ll first need to identify the tasks and subtasks needed to complete your project. Consider using a work breakdown structure or involving different members of your team to most accurately determine which activities are crucial to your project.
2. Determine task relationships
Once you’ve compiled a complete list of tasks, you'll need to determine how each task and subtask is connected. Understanding which tasks are dependent on others will help you identify what activities can be completed at the same time and which must be completed sequentially.
3. Create a timeline of activities
With realistic time frames in mind, give your project a deadline. Consider the amount of time needed to create individual tasks, lag time, and delays before creating your deadline, as unrealistic deadlines can lead to unnecessary stress. Organize your tasks in the correct order to reflect task dependencies, creating the most effective plan of action for your project.
4. Enter your information into your chart
Using a Gantt chart software or template, enter your project information into your chart. Double-check your chart to make sure that all tasks and dependencies are noted, and consider adding a key to your chart to indicate the meaning of different shapes, arrows, and colors.
5. Assign tasks and resources to individuals or teams
Assign each task to a team or individual so that everyone clearly understands their role in the project and can stay on top of important deadlines.
6. Update your chart as your team makes progress
Keep your Gantt chart flexible by updating your chart to reflect completed tasks and revised deadlines or task ownership. An updated Gantt chart will help your team stay adaptable and agile as your project moves forward.
Gantt chart samples
Take a look at the Gantt chart examples below to see which type of chart might be best suited to your project.
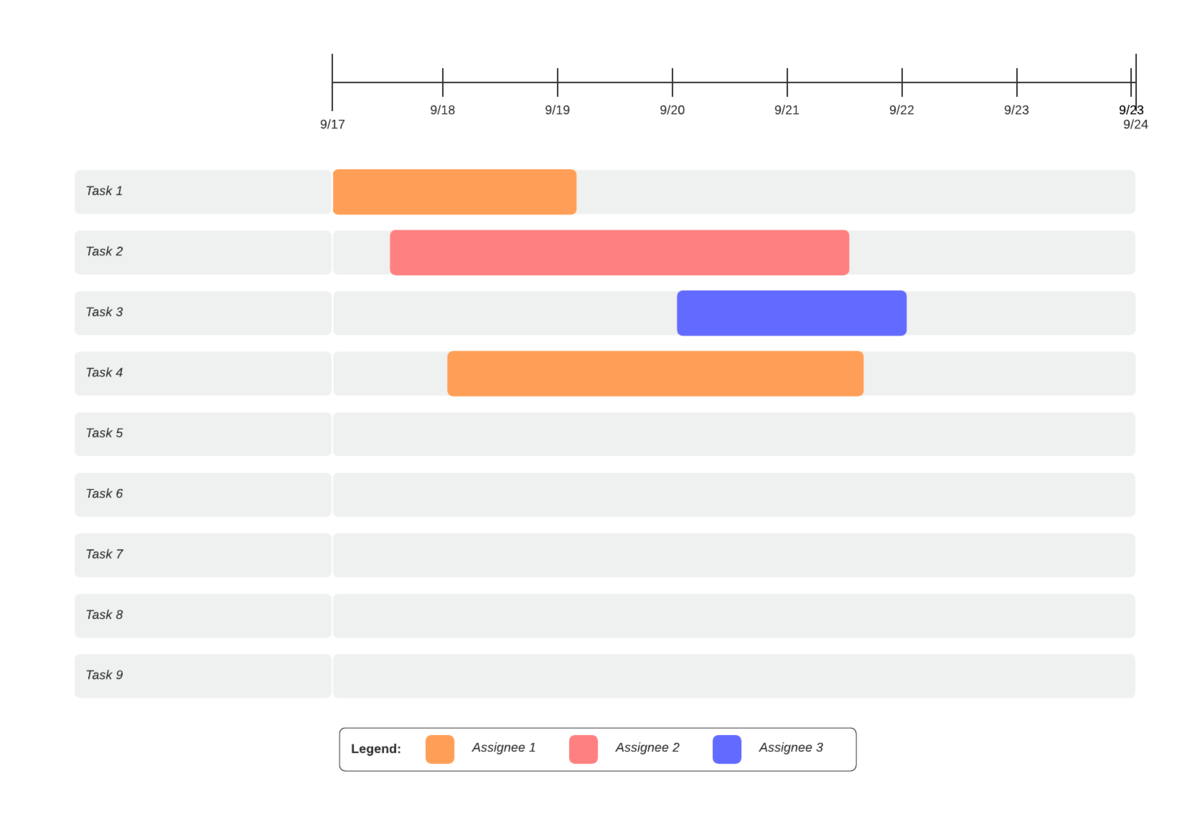
Simple Gantt chart
This simplified version of the Gantt chart includes a basic layout with tasks and task duration mapped out according to the project’s timeline.
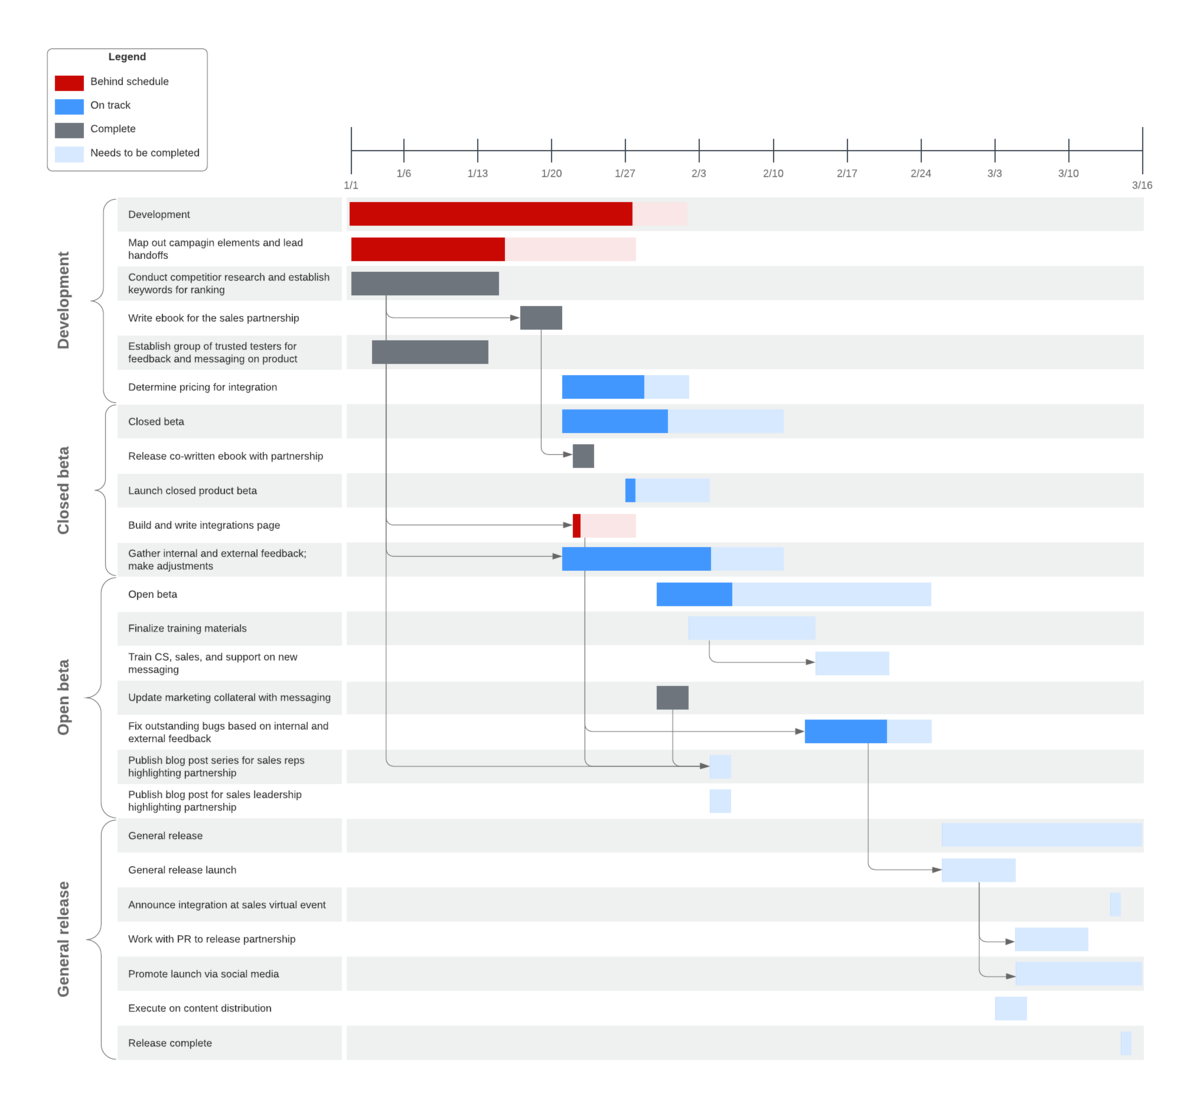
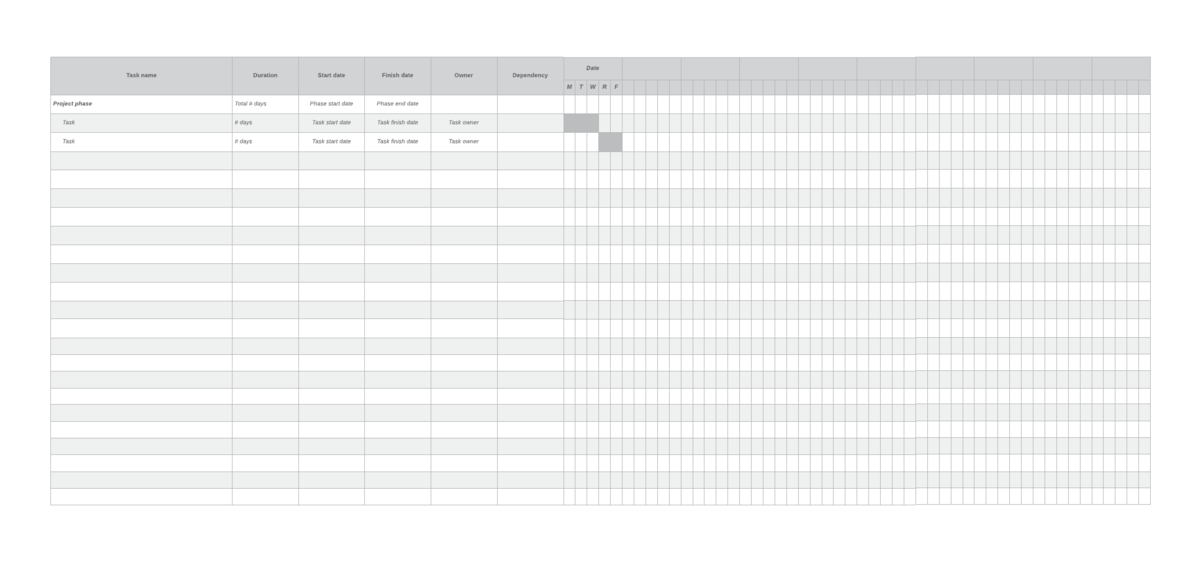
Gantt chart with milestones
This Gantt chart offers considerably more information than a simple Gantt chart, outlined both visually in text. With both formats readily available as a reference, project participants can be clear on task start and finish dates, task dependencies, and other essential information.
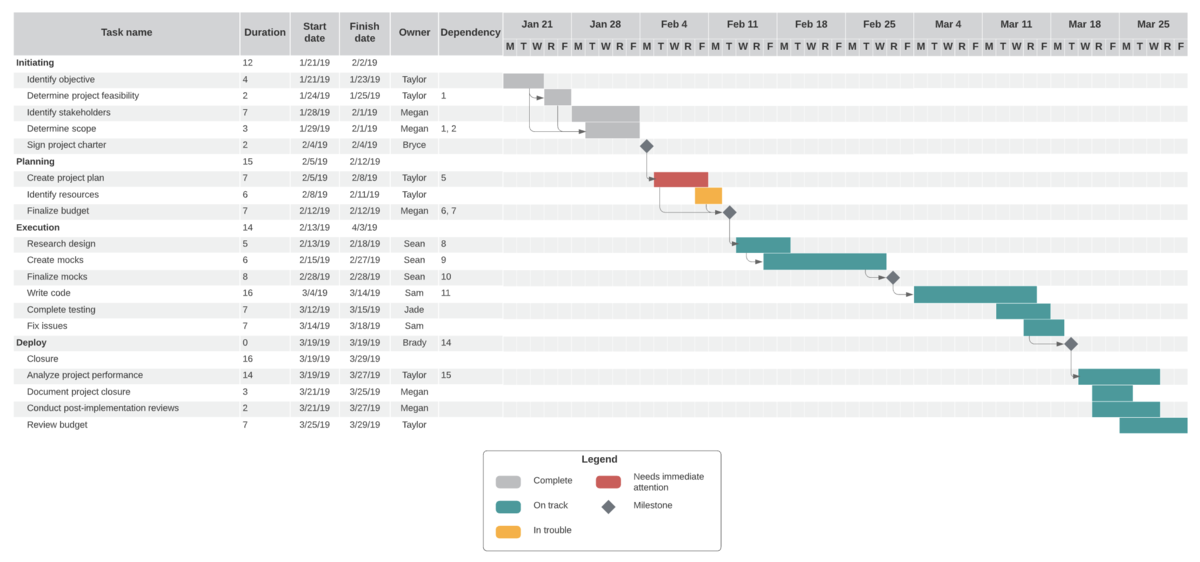
Gantt chart with progress bar template
This template includes basic project information, with the addition of a progress bar to more clearly indicate the degree of task completion.