Discover the essentials of Microsoft Visio diagramming software. Learn about Visio's uses, versions, pricing, and potential Visio alternatives to save you time and money.
5 minute read
Want to make a Diagram of your own? Try Lucidchart. It's quick, easy, and completely free.
What is Visio?
Microsoft Visio is software for drawing a variety of diagrams. These include flowcharts, org charts, building plans, floor plans, data flow diagrams, process flow diagrams, business process modeling, swimlane diagrams, 3D maps, and many more. It’s a Microsoft product, sold as an addition to MS Office. Visio 2016, the latest version, comes in three editions: Visio Standard, Visio Professional, and Visio Pro for Office 365. Visio 2016 pricing is $299.99 for Standard, $589.99 for Professional, and, for Pro for Office 365, either $13 per month (annual commitment) or $15.50 per month (month by month).
All editions share functionality with MS Office Word and Excel, such as text and color choices, and allow data feeds directly from MS Excel and Access. As with other diagram software, Visio provides a library of templates and shapes for various types of charts to help you get started. Note: Microsoft Visio is not related to Vizio Inc. (with a “z”), which makes TVs and other consumer electronics.
How Visio started
Visio originated in the 1990s as a product of Shapeware Corp., first as pre-release version .92 and then as version 1.0 released in 1992. The product quickly gained recognition, and in 1995, the company was renamed Visio Corp. In 2000, Microsoft bought Visio and rebranded it in the MS Office family. However, Visio, along with MS Project, has always been maintained as a stand-alone purchase, separate from the MS Office Suite packages.
Visio versions through the years
The first Visio versions were labeled v 1.0 through 5.0 and came in up to three editions each.

With Microsoft’s acquisition of Visio in 2000, the versions and editions shaped up like this:
- Visio 2000 (v 6.0; Standard, Professional, Technical, Enterprise)
- Visio 2002 (v 10.0; Standard, Professional) -- versions 7.0 through 9.0 were skipped to align with Office release numbers
- Visio for Enterprise Architects 2003 (VEA 2003)
- Office Visio 2003 (v 11.0; Standard, Professional)
- Office Visio for Enterprise Architects 2005 (VEA 2005)
- Office Visio 2007 (v 12.0; Standard, Professional)
- Visio 2010 (v 14.0; Standard, Professional, Premium) – v 13.0 was skipped
- Visio 2013 (v 15.0; Standard, Professional)
- Visio 2016 (v 16.0; Standard, Professional, Office 365)
Visio does not have a Mac version.
How Visio is used
Visio can be used in a variety of settings to create professional-looking diagrams. Given Visio’s cost, a hand-drawn diagram may suit your purposes, or you might turn to the basic diagram functions in MS Word. Or you could use software that is free or less expensive but still powerful, such as lucidchart.com, which also works on Macs. (More on that at the end of this article.)
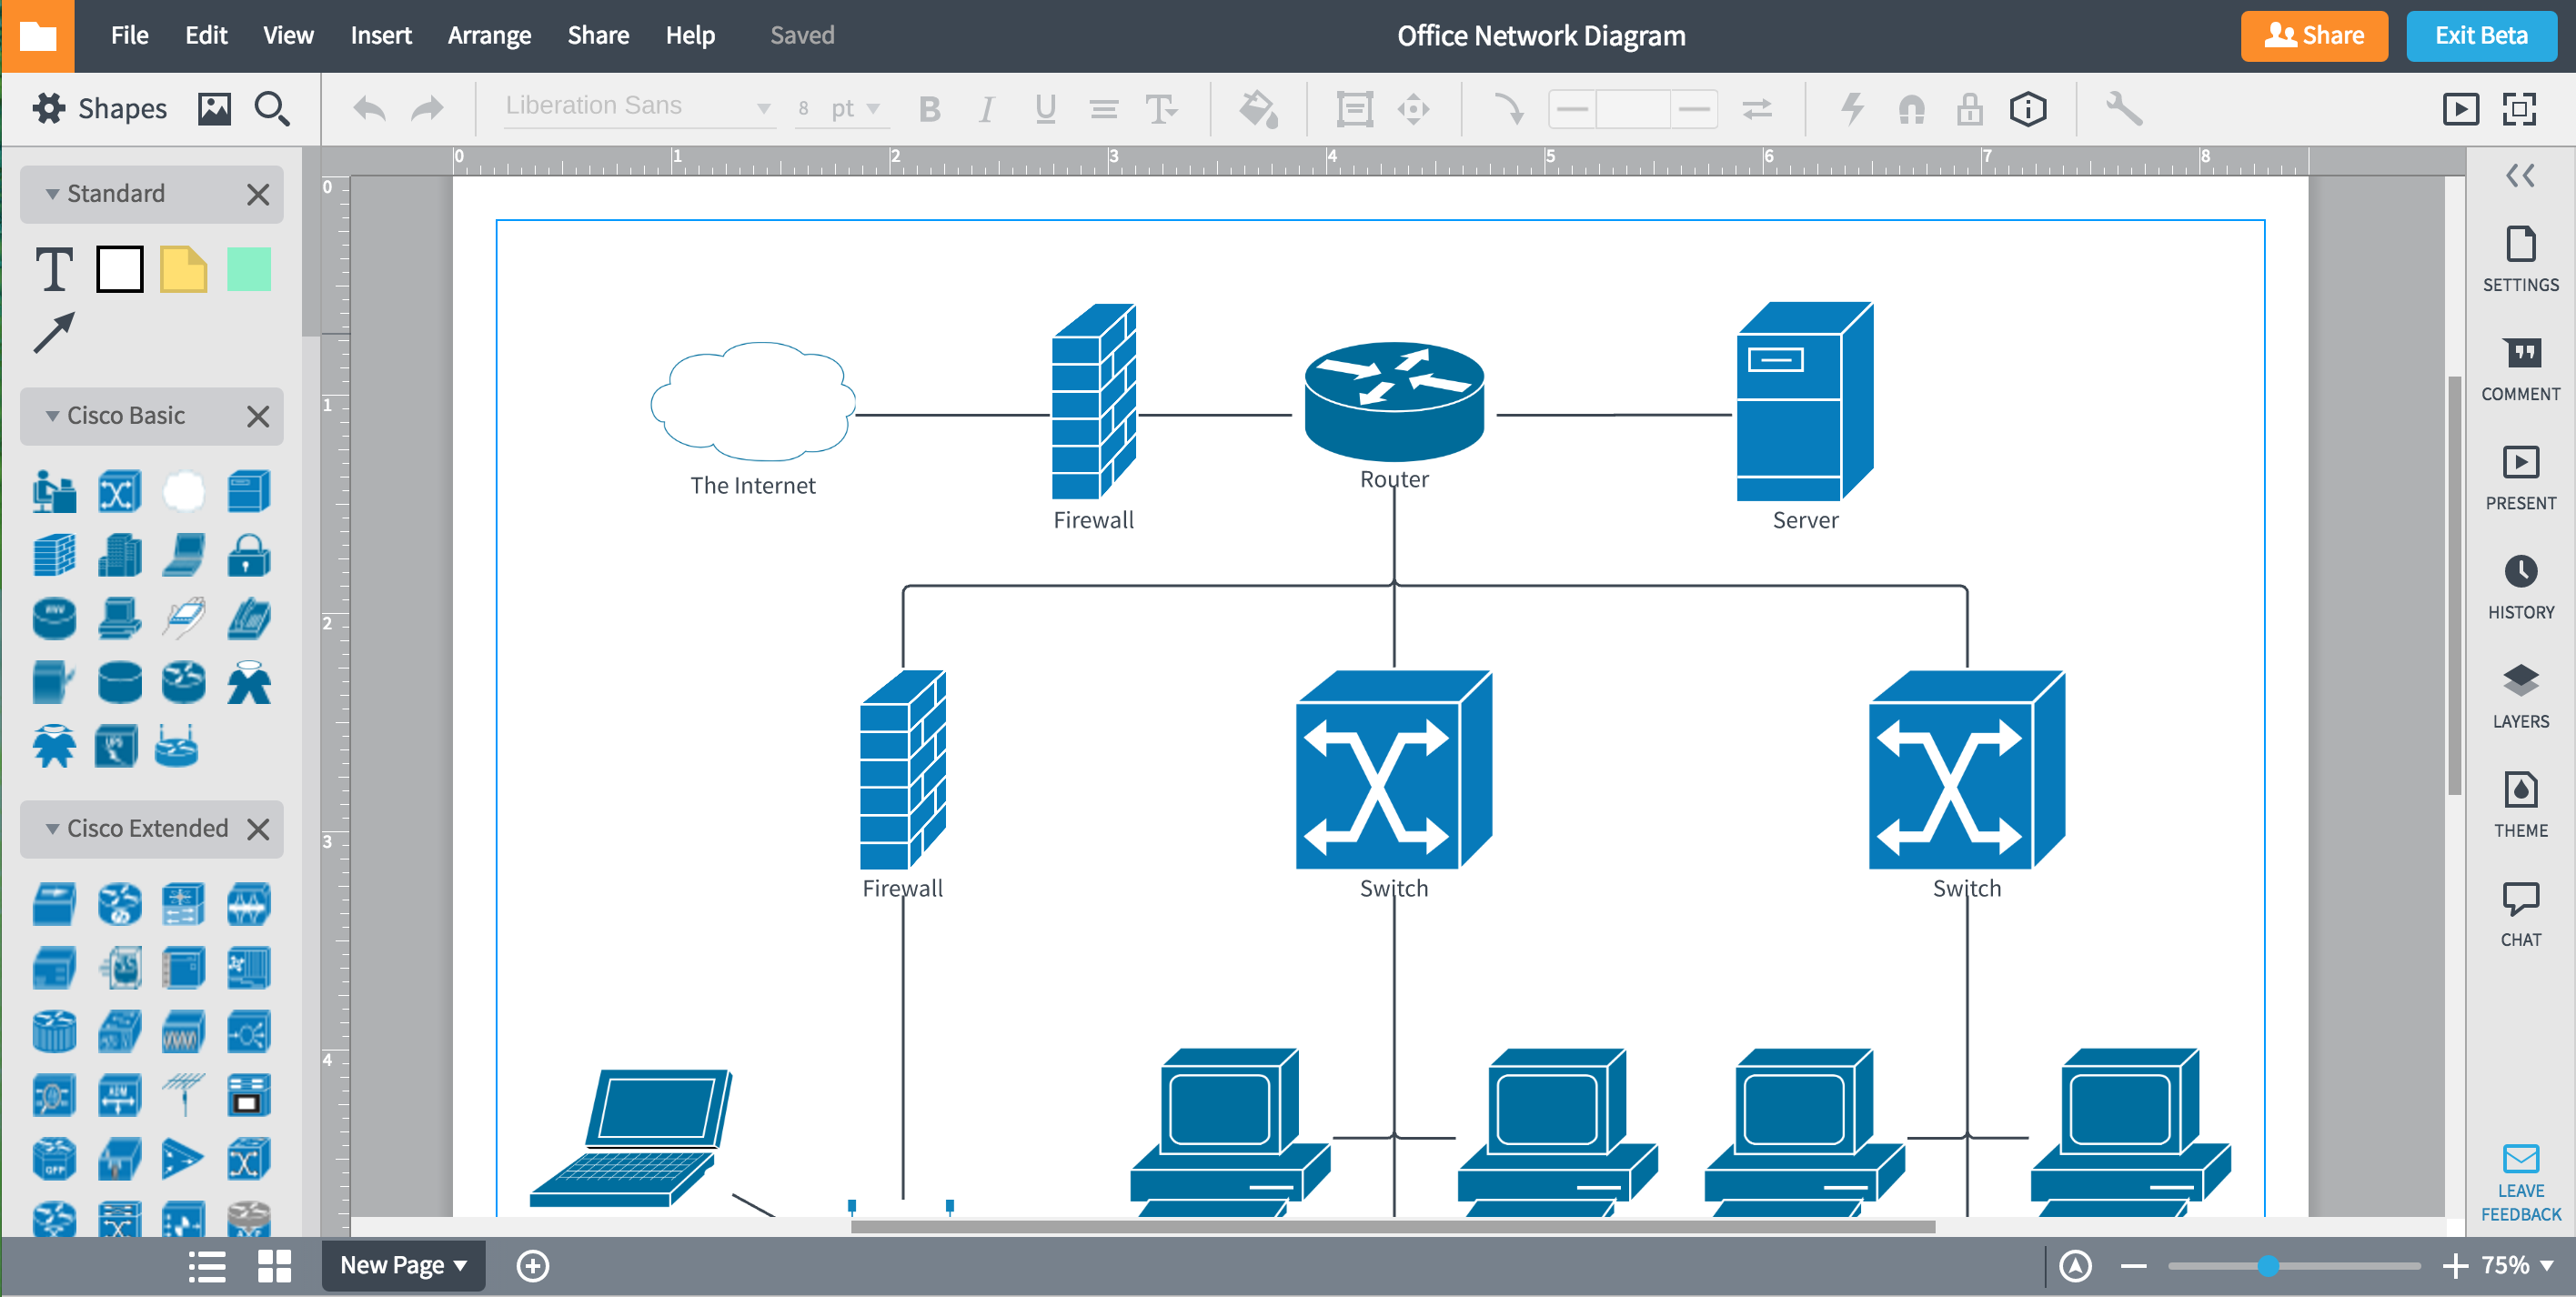
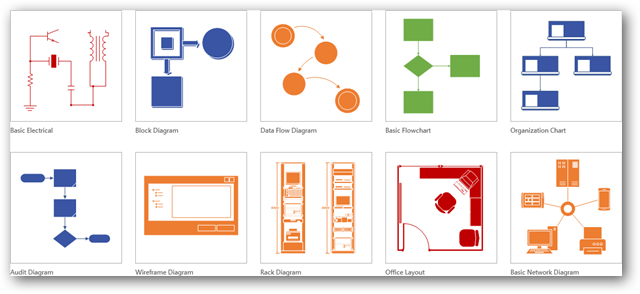
If appropriate for your needs, Visio can indeed produce slick, useful diagrams of all types, and these can provide the professional look you want for presentations, reports, audits, building plans, floor plans, documentation, and modeling better ways to do things. Visio includes a big library of shapes/symbols used in dozens of diagram types. These symbols represent specialized pieces of diagrams such as process flow diagrams, business process modeling, data flow diagrams, and many more. These are used widely in various fields for various purposes. Here are just a few examples:
In any field:
A flowchart, which can take various forms, can be used to document and analyze a process; standardize a process for efficiency and quality; communicate a process for training or understanding by other parts of the organization; and identify bottlenecks, redundancies and unnecessary steps in a process and improve it.In software engineering and business analysis:
Data flow diagrams (DFDs) can provide a focused approach to technical development, in which more research is done upfront to get to coding. Business analysts use DFDs to analyze existing systems and find efficiencies. Diagramming the process can uncover steps that might otherwise be missed or not fully understood.In business:
Business Process Modeling and Notation (BPMN) is targeted at participants and other stakeholders in a business process to gain understanding through an easy-to-understand visual representation of the steps. At a more involved level, it’s targeted at the people who will implement the process, giving sufficient detail to enable precise implementationIn chemical engineering or process engineering:
A Process Flow Diagram (PFD) is a type of flowchart that illustrates the relationships between major components at an industrial plant. Diagrams can serve to document, analyze, audit, or model a better way.
Diagramming is quick and easy with Lucidchart. Start a free trial today to start creating and collaborating.
Make a diagramVisio file formats
As of 2013, Visio uses VSDX and VSDM file formats, based on the Open Packaging Conventions standard. These consist of a group of XML files inside a Zip file. The only difference between the two types is that VSDM files may contain macros.
How to plan and draw a basic Visio chart
- Determine what you’re trying to accomplish and gather the appropriate detail for your diagram or chart. Also determine which chart type best illustrates the information for your needs.
- In Visio, choose and open the template for your chart type.
- Drag and connect shapes/symbols to illustrate the items and their flow. Different shapes represent different things in the various types of diagrams, and they range from simple rectangles, ovals and arrows to hundreds of highly specialized shapes and symbols. You also can import your own shapes if necessary.
- Add labels and text to the shapes.
- Review your diagram to make sure you’re not missing anything or duplicating anything. If you’re collaborating with others, check each other’s work.
More Visio diagram tips
- Start with the Visio template that best matches the type of diagram you want to create. If the exact template isn’t in the library, choose the closest one and drag in whatever additional shapes you need, including importing your own if necessary.
- Use Visio stencils to pull in a group of shapes, such as the Basic Flowchart Shapes stencil.
- Add data to a shape by typing in the Shape Data window.
- In Visio Professional Edition, you can automatically import data from MS Excel or Access.
A free Visio alternative: Lucidchart
Looking for a free – and excellent – alternative to Visio? Check out Lucidchart.
Lucidchart also has the advantage of being web-based, allowing cloud-based, real-time collaboration. You can even import, view and edit Visio files with Lucidchart, and it works with Macs. Try out the easy-to-use and powerful Lucidchart.
Creating charts and diagrams in Lucidchart is simple and intuitive. Simply drag shapes onto the canvas and draw lines to connect them. If you're not sure where to begin, check out our tutorial for tips on how to draw a Flowchart.