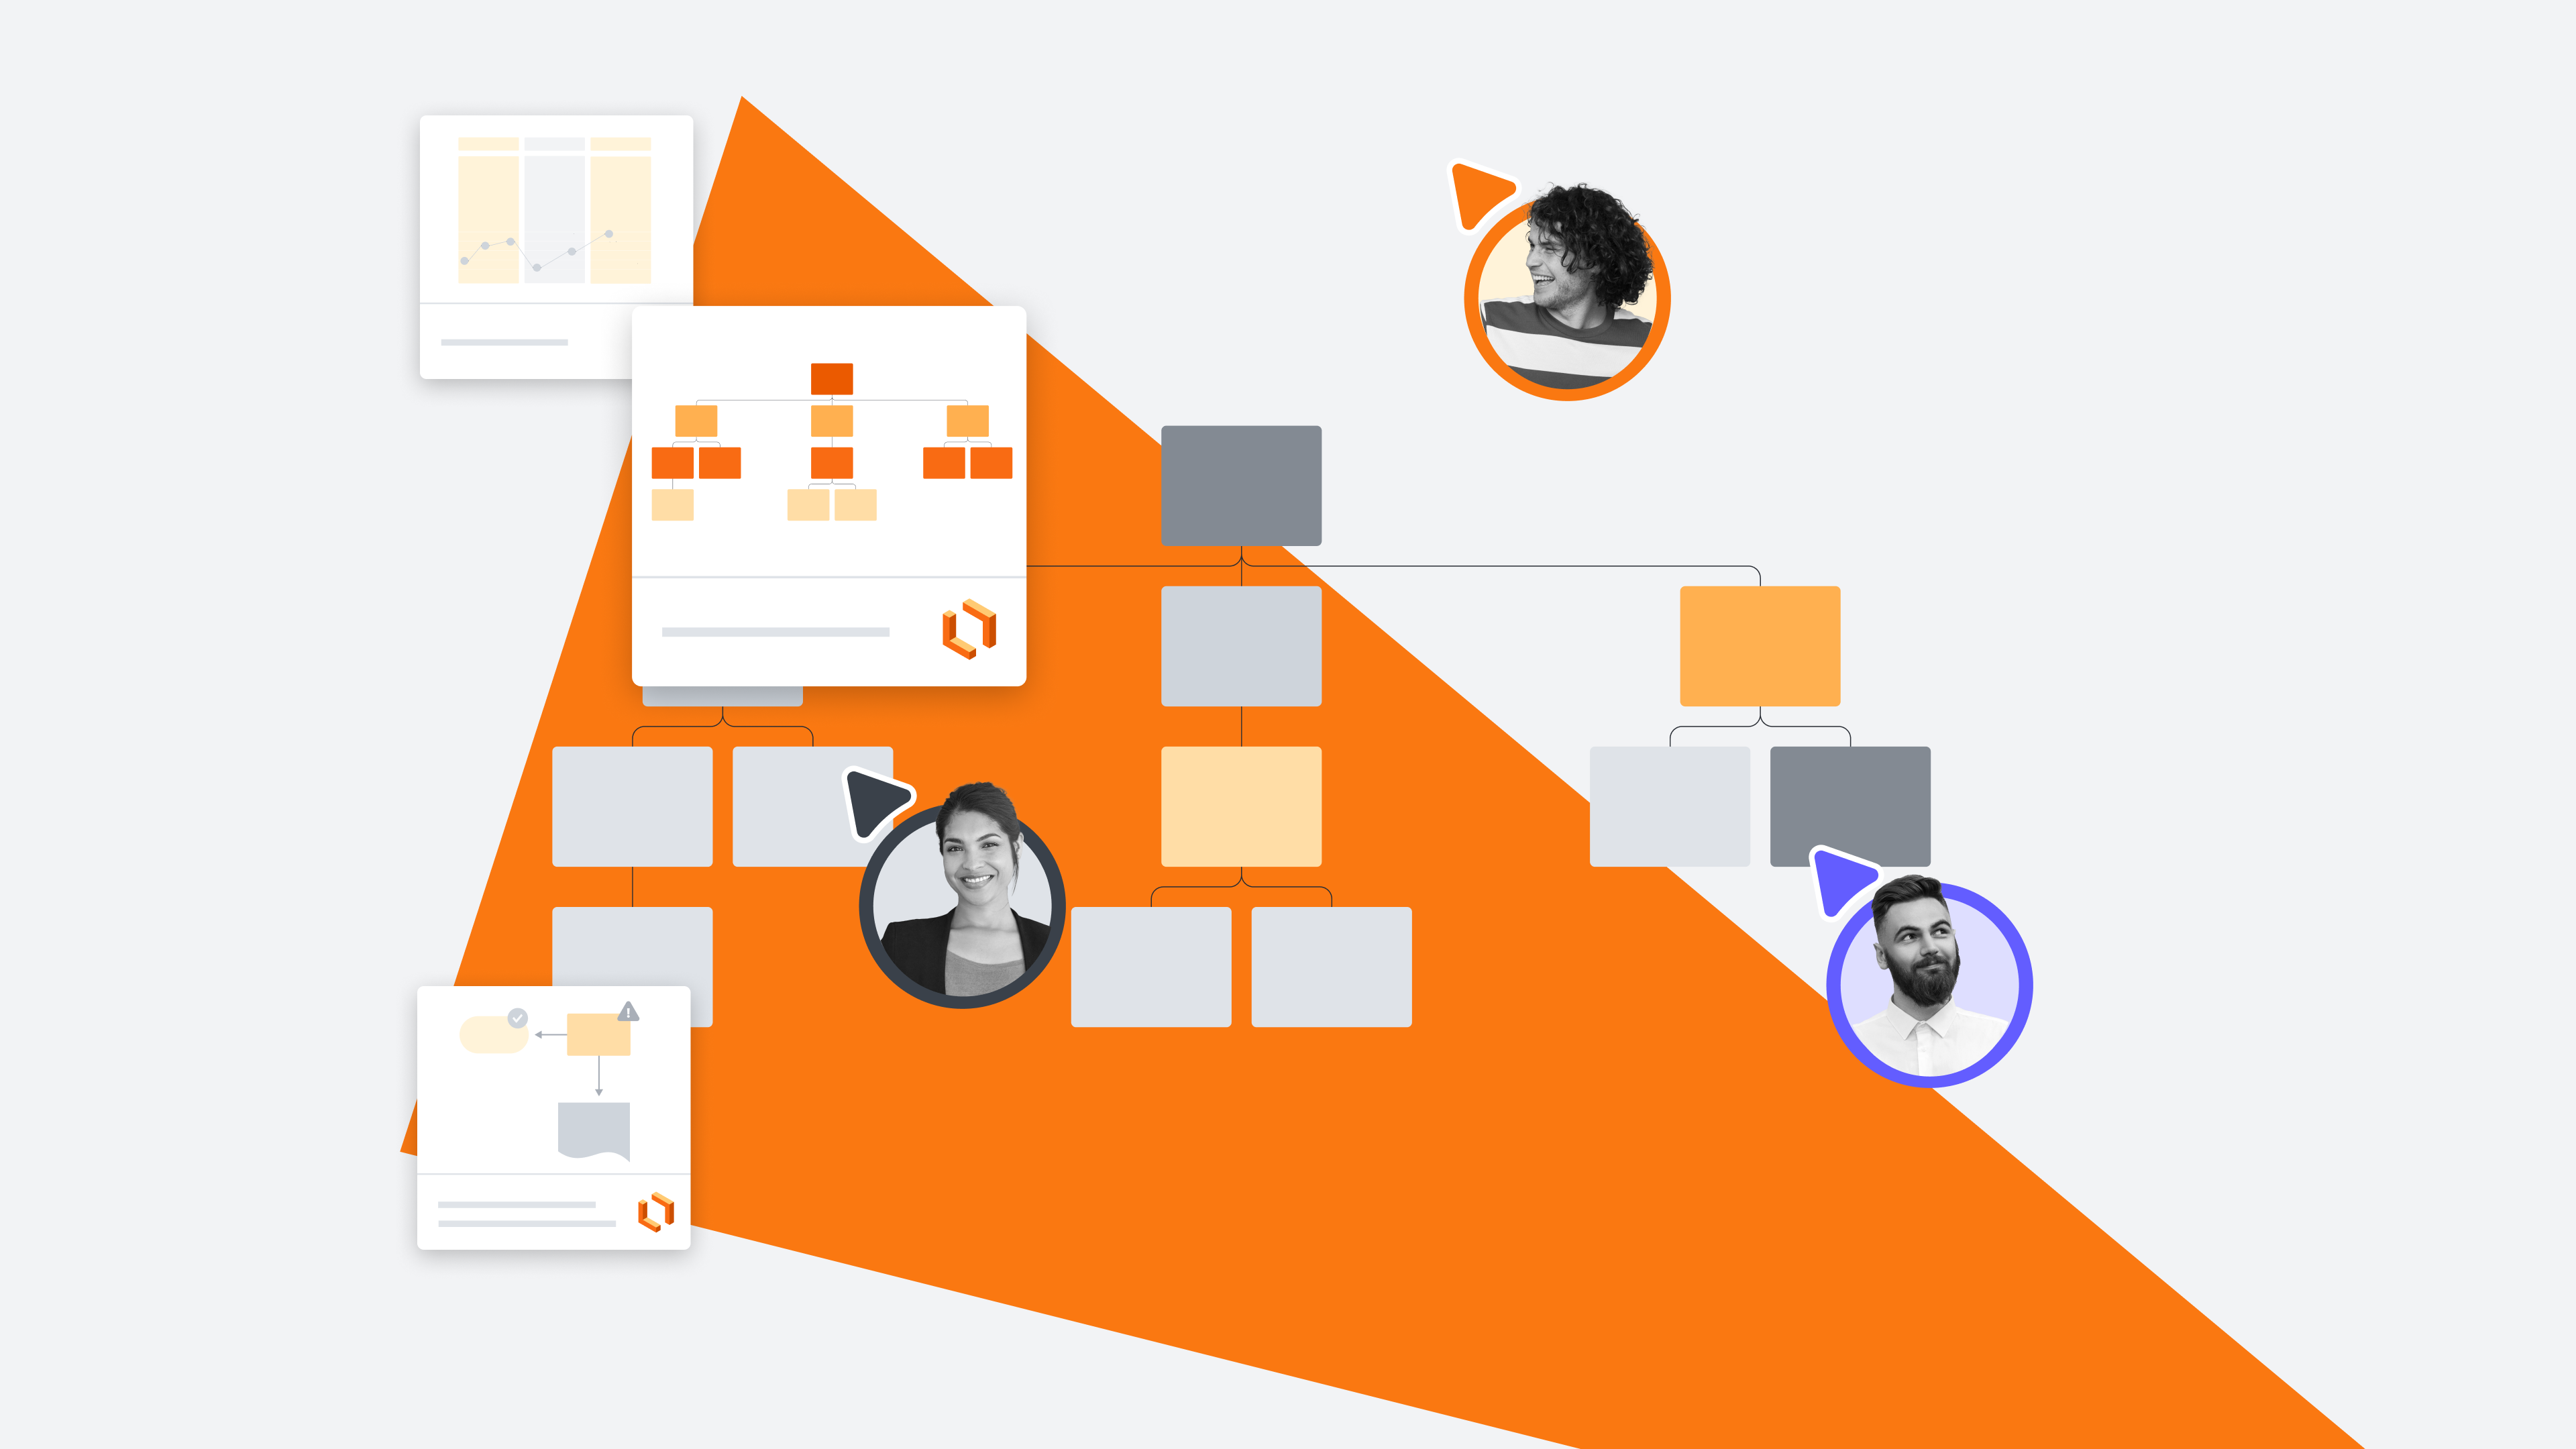
Business Process Modeling Notation is its own language—specific shapes create a standardized way of conveying various business actions across the organization. BPMNs are great for creating a consistent experience to eliminate misunderstandings, but they also have a bit of a learning curve. Luckily, we have a course that can help.
The content of this article is pulled from the BPMNS in Lucidchart training course. Check it out for yourself to learn more!
What is a Business Process Modeling Notation (BPMN)?
A BPMN uses specific shapes to create a standardized way of communicating business actions across the organization.
Benefits of BPMN
There are many reasons why BPMN could be useful in your org.
- Eliminate the risk of important information being misunderstood.
- Visualize your business’s current state.
- Identify potential areas of improvement.
- Map out future possibilities within the same document.
Steps to creating a BPMN
Building a BPMN can be complex, but Lucid makes it easier.
Build your current state
To improve your business, you’ll need to first visualize its current state. If you want to save time, you can use one of our BPMN templates. Simply customize it to fit your use case. Or, you can build a BPMN from scratch by following these steps.
- First, add the BPMN shape library to your toolbar. Go to Insert, then click on Shapes and select the BPMN standard library. This will add the four shape objects to your library: Flow objects, connecting objects, swimlanes, and artifacts.
- Drag out swimlanes from the toolbar and label them to represent various people or main workflows in your business.
- Drag the “event” shape into a swimlane to indicate it’s the start of a process and label that event.
- Create “tasks” by connecting them to events. Tasks are activities performed by people or systems within the process. Lines in the workflow represent how information flows in the diagram.
- Use a gateway to represent decisions made within the workflow.
- Utilize the contextual panel to select activities, task types, and activity markers.
- Use intermediate events (such as when the customer is waiting for an order) to convey an event that happens anywhere between the start and end event.
- Use a transaction task to visualize the exchange of payment and use a group to organize tasks within a process that hold significant value, such as several tasks about processing payment.
- An end event shape can convey the end of the process.
Find improvements with conditional formatting and adding layers
Improve your process by recognizing gaps in the customer experience. Conditional formatting does the heavy lifting for you by recognizing risks and gaps in processes.
- To set up rules, navigate to conditional formatting. Toggle them on and off to see them appear in the diagram. You can use this, for example, to determine where customers experience longer wait times.
- Share a link to the process with your team by clicking Share in the upper right-hand corner. You and your team can add notes to the process by right-clicking and selecting Add note. You can also mention team members by tagging them in a note for input—just type “@” followed by their name.
Mapping out a future state
- Notate changes with different event colors.
- Highlight the future state, right-click, select Move to layer, then choose New layer. Name the new layer “Future state.”
- Create a button to toggle between your current and future state. Choose a shape from the shape toolbar, drag it to your work area, add color to it, and label it. Select the new button and navigate to Actions. Then select Layers and find the toggle drop-down, then choose the “Future state” layer you created. Now, your shape acts as a toggle button between the current and future state.
Learn more in the course
Analyze where your business is at, collaborate with peers to make improvements, and prototype a future state with proposed changes using BPMNs in Lucidchart.
Still need help? Want to learn more? Sign up for the rest of our course to access the rest of the content.