So you’ve made your move to the cloud, or maybe you’re currently planning your cloud migration. In either case, it can be challenging to keep track of all the moving parts of the cloud. As part of your efforts to better understand your cloud environment and plan future changes, you may have already created a cloud architecture diagram.
However, architecture diagrams are often large and made up of hundreds—possibly thousands—of components. You may find architecture diagrams are inundated with too many details, making them hard to look at and extract actionable insights from.
But, with Lucidscale, you can easily create a cloud diagram and cut through the clutter, focusing on the information that matters most to your organization.
What is Lucidscale?
Lucidscale helps you visualize, understand, and optimize the cloud. In a few simple steps, you can connect to your AWS, Google Cloud, or Azure cloud provider data and automatically generate a cloud architecture diagram.
However, simply having a cloud diagram isn’t enough. At times, you will need to manipulate your diagram and focus your attention on specific elements rather than trying to see past every detail of the entire diagram.
Gain greater insights with advanced functionality
As Lucidscale generates your cloud diagram, it is backed by metadata brought in from your cloud provider. This metadata allows you to visualize your cloud architecture in multiple views, such as changing the layout and filtering out unnecessary information.
Lucidscale comes with standard views so you can see infrastructure through network rules or as an overview of accounts, regions, and VPCs, and more.

Try these options to customize your view with Lucidscale:
- Filter: Remove unnecessary details, filter by criteria, such as AWS tags, VPCs, subnets, and more.
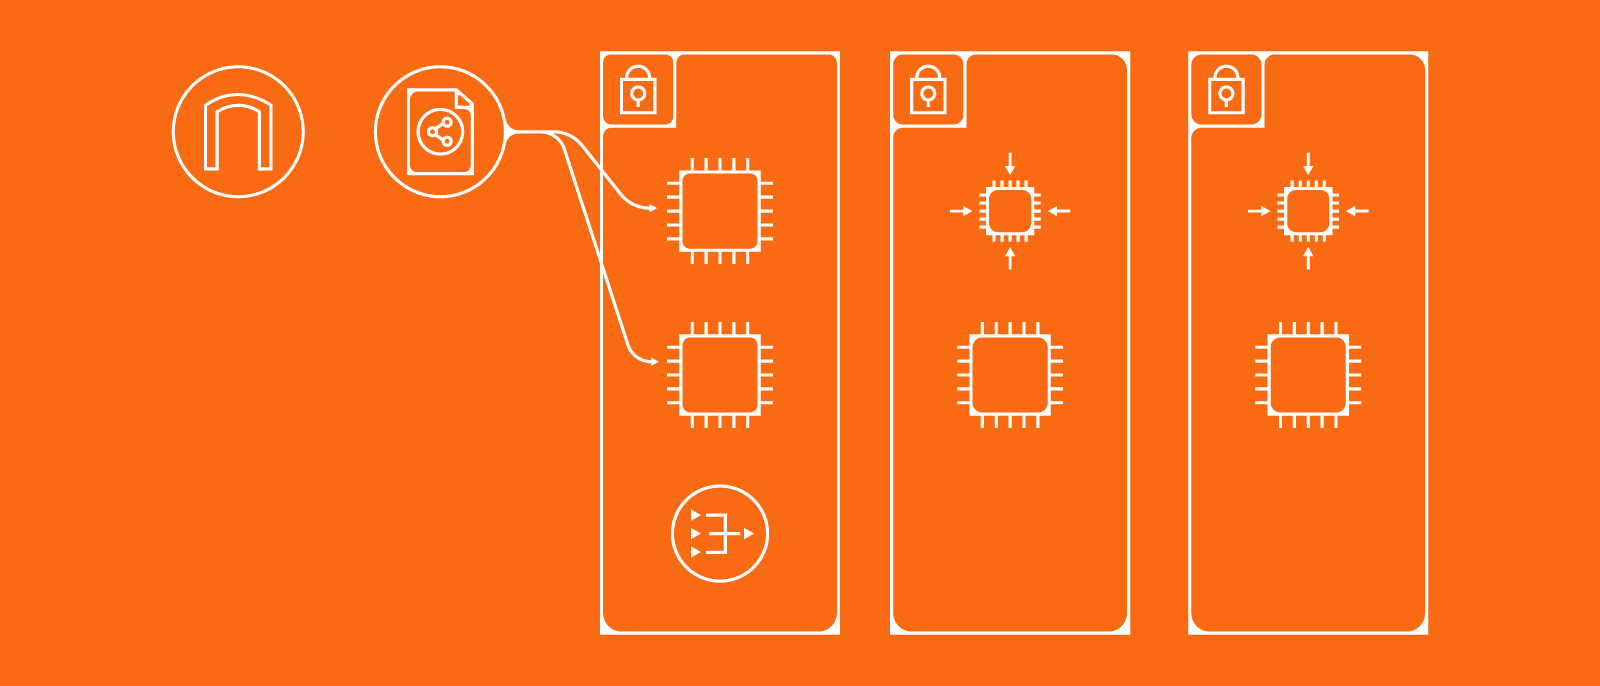
- Change your layout: Group resources within a container by type, adjust the number of columns that shapes within a container are arranged in, or adjust the order for resources to appear.
- Visualize relationships: Draw lines based on relationships between resources.
- Save as a New View: Save your customized settings as a view for future use.
Why apply filters and customize my view?
Architecture diagrams are notoriously challenging to digest, so you’ll likely want a few different versions of your diagram on hand that are tailored to specific scenarios and accessible at a moment’s notice.
For example, you could have different views for:
- Troubleshooting specific parts of your architecture
- Delivering high-level presentations to executives to gain buy-in or budget approval
- Sharing with a development team that is concerned with only one application
- Security leads quickly viewing VPC peering connections to ensure they are set up correctly
To build a diagram, you could use a traditional diagramming application, such as Visio, but you’ll need to manually draw an architecture diagram and then shuffle your components around to create a specific view.
Even if you put in the effort to manually build a diagram that fits your needs, you’ll be forced to reconfigure your diagram every time you—or someone else—makes changes to your architecture to ensure the diagram is accurate, and again if someone wants a new view (among other inconveniences, such as versioning issues and inability to track changes in real time). These inconveniences can be costly, time-consuming, and frustrating.
But, by using Lucidscale, you save time and gain the ability to:
- Clear out cluttered information with filters.
- Focus on the most important information by highlighting essential information.
- Identify best practice violations, such as missing tags.
- Focus on security concerns, such as missing encryption.
- Understand relationships between resources.
- Save time by creating and saving views for future use.
- Communicate better with stakeholders by creating unique or simplified versions of your diagram.
How to customize your view with Lucidscale
With a few simple clicks, your cloud architecture diagram can go from overwhelming and useless to focused and actionable.
Learn how to customize (and save) your view in this step-by-step breakdown.
Filter your architecture diagram
- Click the + Icon.
- Filter by criteria, such as AWS tags or subnets. Select what you'd like to filter by (e.g., Tags or Shape Data), select the resource type to filter, and then type in what specific data you'd like to filter by.
- Click Save to save your filter.

Visualize relationships
- Generate lines to highlight relationships, such as ALBs and EC2s.
- Customize line styles by color, style, and more.
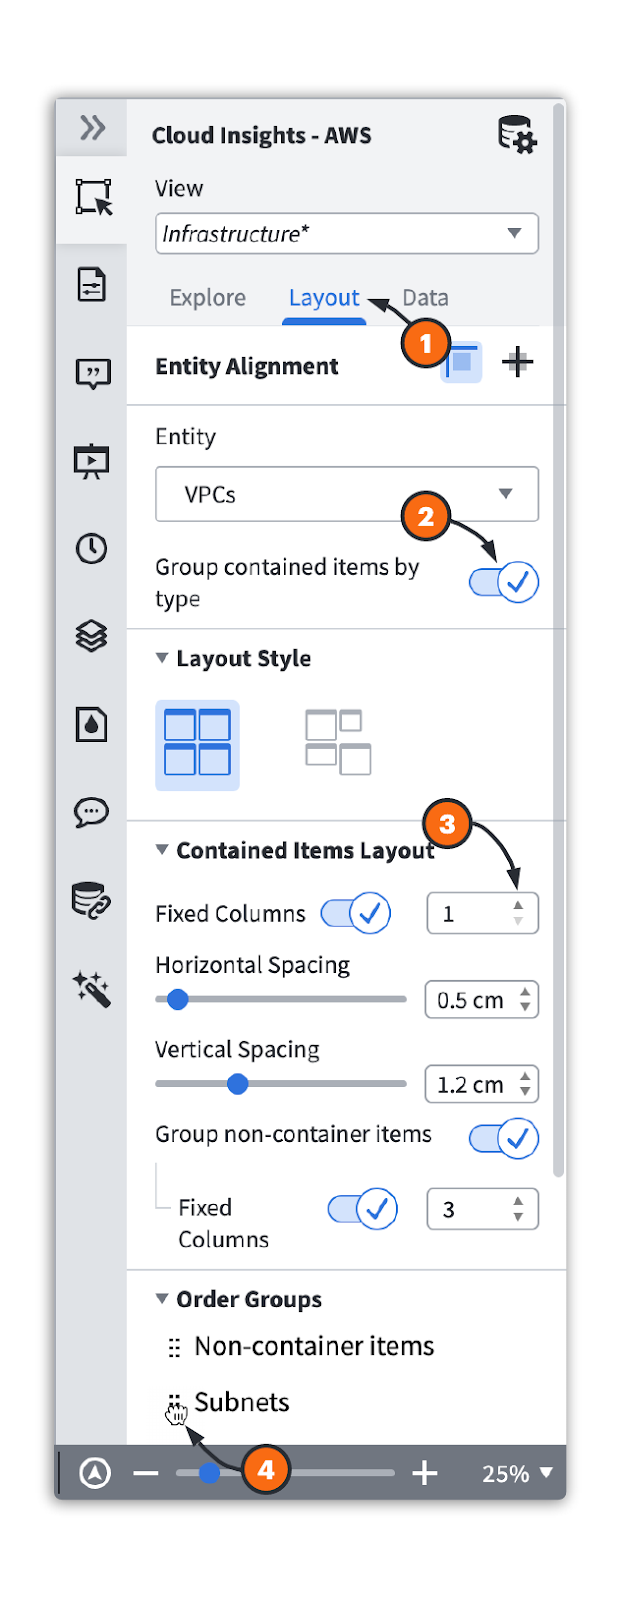
Change your layout
- Click the “Layout” tab.
- Group resources within a container by type.
- Adjust the number of columns inside a specific container type.
- Rearrange the order for resources to appear.
Save as a new view
- Click the pull down menu for “View.”
- Click “Save as New View” to save your diagram for future use
Now that you can see just how easy it is to create and customize your cloud architecture diagram, stop wasting time and try it yourself!