Businesses don’t start out as huge enterprises. They start small and collaborate together as they work to achieve the company’s goals. As the company grows, employees are eventually separated into different departments where they work in more specific roles on team projects. This is when silos often start to form.
When silo mentality creeps in, teams tend to develop a sense of isolation where the projects they are working on sometimes become detached from the vision and goals of the organization. If left unchecked, silo mentality can make the company less efficient and cause other problems, such as:
- Too many handoffs between different teams.
- Delayed feedback because other teams are focused on a different agenda.
- A buildup of technical debt because of poor communication and a lack of standardization.
- The release of poor-quality products.
- A decline in customer satisfaction.
Forming cross-functional teams can help you to connect silos and prevent a lot of these potential problems. Ensuring that representatives from all teams are included on project teams helps create a culture of interdepartmental collaboration. While cross-functional collaboration itself is a good thing, it can lead to inefficiencies, miscommunication, and competing priorities.
Cross-functional process mapping is one tool you can use to help you manage large, cross-functional teams. It can help you to standardize processes and manage projects in a visual way.
What is cross-functional process mapping?
Process maps and flowcharts help team members to visualize and understand the process of the work they are doing. Visuals make it easier for your team to see tasks, interfaces, dependencies, inputs, outputs, and how each person’s individual tasks fit into the overall process. Process maps and flowcharts help managers find opportunities for improvement, ways to reduce costs, and ultimately increase productivity.
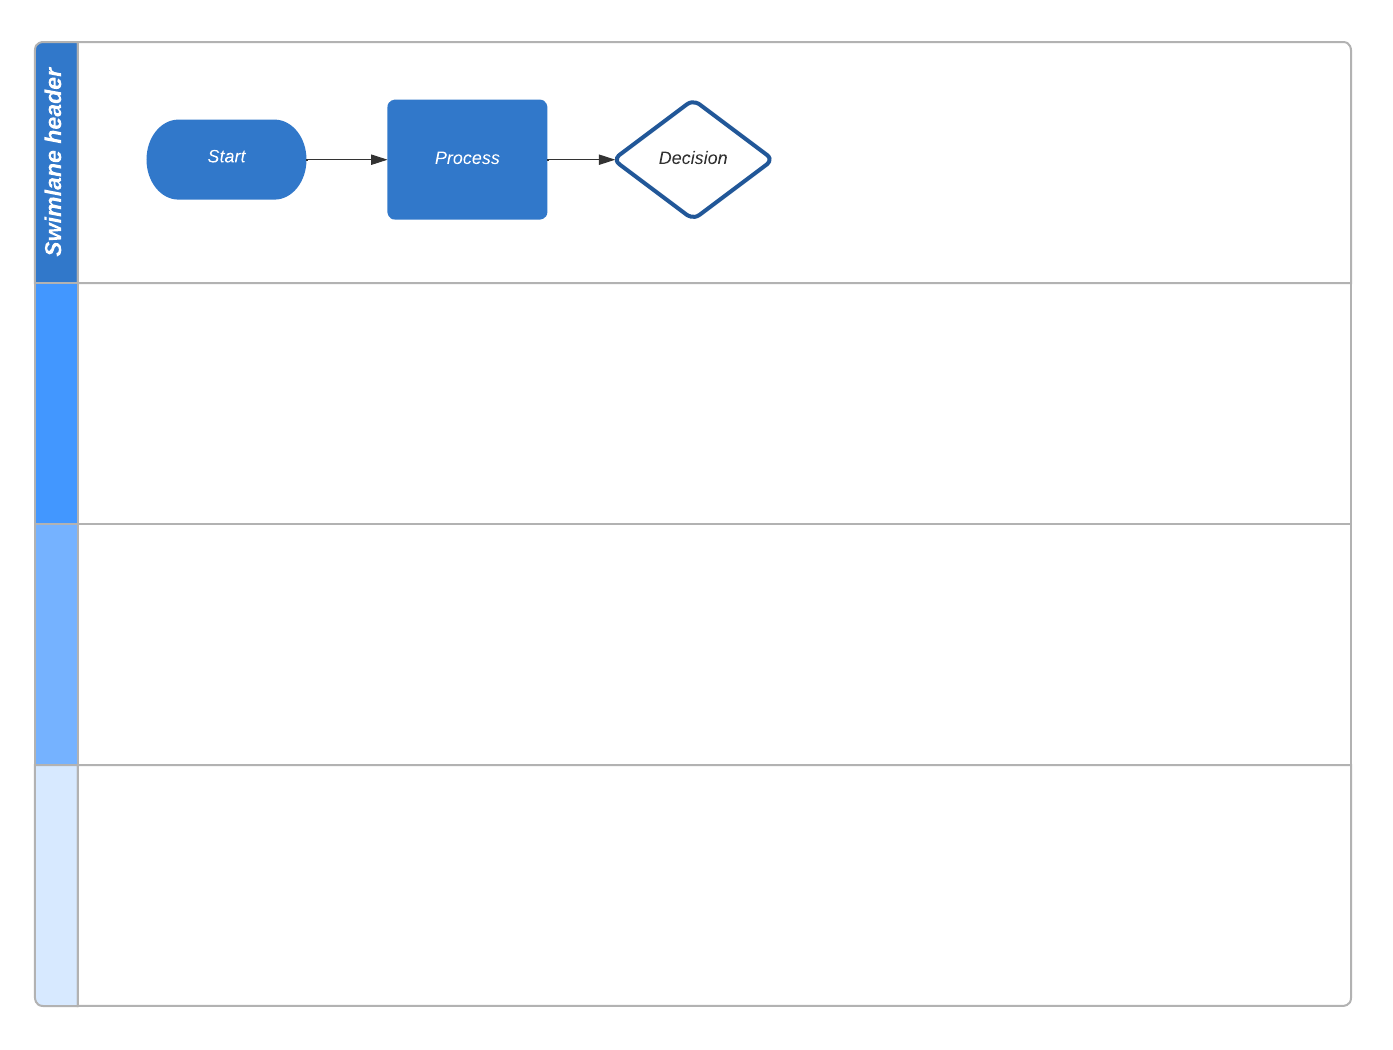
A cross-functional process map takes a process map a few steps further. By introducing “swimlanes” into your flowchart, you can document your local team’s processes and identify tasks that happen concurrently in other departments and by other stakeholders involved with the project.
A flowchart with swimlanes helps you to visualize an entire process and understand which departments are responsible for individual tasks. This helps you track all interdepartmental dependencies and understand how much time each process will take to complete. Teams can also see who’s responsible for what tasks, identify potential redundancies and bottlenecks, and find ways to increase efficiency.
What are the benefits of cross-functional process mapping?
Process mapping helps you to streamline processes and get work done faster. A flowchart with swimlanes brings cross-functional processes to life, helping teams: :
- Get a visual overview of your end-to-end processes: Visually show individuals how their work impacts the work being done by others and how it impacts the final output.
- Support reasons for making changes: Don’t make changes to processes just because you think there needs to be a change. Start by mapping your current processes to use as a baseline. As you find better, alternative ways to do things, use the map to support your ideas.
- Drive ownership, responsibility, and accountability: Help team members understand who is responsible and accountable for specific activities within the process. Everybody knows who to talk to if there are breakdowns.
- Help with onboarding and training: A well-designed and approved process map is a real asset as new team members are brought on board. The visuals can help them to learn your best practices quickly.
- Document compliance with regulations: Maps can show that your company follows regulatory standards and can be a good reference source during internal and external audits.
- Help you find and fix problem areas: Process maps help you to find risks and identify ways to mitigate them.
- Facilitate your continuous improvement efforts: Being able to find and fix problems quickly helps with your efforts to improve and streamline your processes.
How do you create a cross-functional process map?
Mapping individual team processes can be quite a chore. Adding the processes from the entire cross-functional team is a huge task, but it will be worth it in the end. You can easily repurpose current process maps for use in new maps that you create, making the whole process mapping process that much easier each time.
Here are a few tips to help you get started.
Get input from all stakeholders
To begin, don’t try to do this on your own. You can’t presume to know or understand the processes that other teams are working on in your organization. Ask the key stakeholders across the organization to define their goals and describe their processes. This will give you several different perspectives to work from as you begin to determine best practices and plan how to align all teams toward the same goal. Make sure you get input from at least one person from each department that is involved in the project.
Choose the right software
Yes, you can draw flowcharts and maps with pencil and paper, but you probably won’t want to take that route on large, complicated maps. Using software that includes a library of standard shapes and connectors helps you to create your flowcharts quickly and relatively stress-free. With a library of standard shapes, you ensure that you are using a common language that everybody across all teams can read and understand. Documents created this way are also easier to update and share.
Look for process mapping software that is:
- Cloud-based: Standalone software solutions need to be installed on multiple computers and require multiple licenses. A cloud-based solution means that the software is platform independent and can be easily accessed by anyone who needs it. This ensures that everybody involved has access to the same real-time information, encourages collaboration, and allows for quick feedback.
- Intelligent: An intelligent diagramming software does a lot of heavy lifting for you. It lets you link important data to your diagrams, use data to create diagrams, and more.
Lucidchart is a cloud-based, intelligent diagramming solution that can bring your cross-functional teams together and help you create useful dynamic diagrams. Lucidchart users can integrate diagrams with popular applications such as Google Workspace, Atlassian, Microsoft, and Slack.
Draw process flowcharts with swimlanes
Cross-functional diagrams use swimlanes to define who does what in a process. In the diagram, each department or team is assigned to a swimlane. So anything that is placed in a swimlane is the responsibility of the entity assigned to that lane. The container that the swimlanes are placed in is called a pool. Swimlanes in the pool can run vertically or horizontally.
Whether you draw your swimlanes horizontally or vertically, you can follow these suggested steps:
- List the teams, departments, or individuals who are responsible for each process down on the left (for horizontal swimlanes) or across the top (for vertical swimlanes).
- Use standard process notation shapes to document steps in sequence within their assigned swimlanes.
- Show the diagram to participants to make sure all steps have been captured and that they are shown in the correct order. Make adjustments as needed.
- Implement the diagram as a standardized process for production and training purposes.
- Monitor the process, look for inefficiencies, fix any problems that may come up, and adjust the process diagram when necessary.