current state mapping Lucidchart

Mapping your current state with Lucidchart

Reading time: about 7 min

Topics:

  • Diagramming
  • Lucidchart tips
  • Process improvement

A current state map is generally thought of as a snapshot of the processes and methods your organization currently uses to produce products and complete services. But in a constantly changing business landscape, a current state map needs to include more than processes. It should include your business functions, capabilities, applications, and tech stack. 

A current state map is not only important to show you where you are but also for showing you where you need to go. A current state map can help you to:

  • Understand what you need to do to scale your architecture and improve processes.
  • Quickly visualize and understand your organization’s architecture. This helps you make better decisions regarding your company’s future state.
  • Document your company’s architecture, its components, relationships, processes, and more. Documentation is important because it helps new employees get up to speed quickly, and it helps current employees to step into new roles more easily.
  • Present technical ideas and information to audiences with varying levels of technical expertise. It’s generally easier for people to digest, interpret, and retain visual information than text-heaving documentation.
  • Ensure company-wide consistency.

In this article, we will walk you through the process of creating a visual current state map using Lucidchart. 

Step 1: Start with a blank Lucidchart document

Start with a blank Lucidchart document. 

If you don’t already have a Lucidchart account, Sign up for Lucidchart, and choose the plan that works best for you.

Lucidchart document

Step 2: Map business functions

To get a full overview of your company’s current state, you need to document more than just your department or team. You want to bring in other departments or business units to represent various business functions such as sales and marketing, finance, human resources, IT, research and development, and so on. This will help you to understand who does what, where it is done, and how it relates to other functions throughout the company.

You can map your company’s business functions using the Lucidchart functional decomposition template. This template helps you to analyze complex processes and break them down into smaller components. This helps you see how everything fits together, which gives you a better understanding of the requirements, time estimates, and functions that might be causing delays.

functional decomposition template
Functional decomposition template (click to modify online)

You can click the image above to go directly to the functional decomposition template, or you can insert the template into the current state document you just opened. Simply click Insert and select Template. Then, use the search bar to find the correct template.

Lucidchart template search

The template will be added to a new page in your current document. Tabs are placed at the the bottom of the canvas so you can easily navigate from page to page within the document. 

Templates are useful because a lot of the work is done for you. All you need to do is fill in information that is relevant to your business functions.

Step 3: Map business capabilities

Mapping business capabilities helps you to determine whether your company has the capacity to do the work that is identified in the business functions. So you will be looking at employee abilities and expertise, equipment and materials on hand, and any other resources that you need to complete specific tasks. 

A business capability is not mapped like a flowchart or a process. It is simply a visual representation of who knows how to do what and what is available/needed to help that person do that job.

Insert a business capability template into your current state document so you can see who has the right skill sets for specific functions, and where your resources are located. This will help you to determine if you need to hire more people, acquire more resources, or just shift available resources and teams around.

business capability map
Business capability map template (click to modify online)

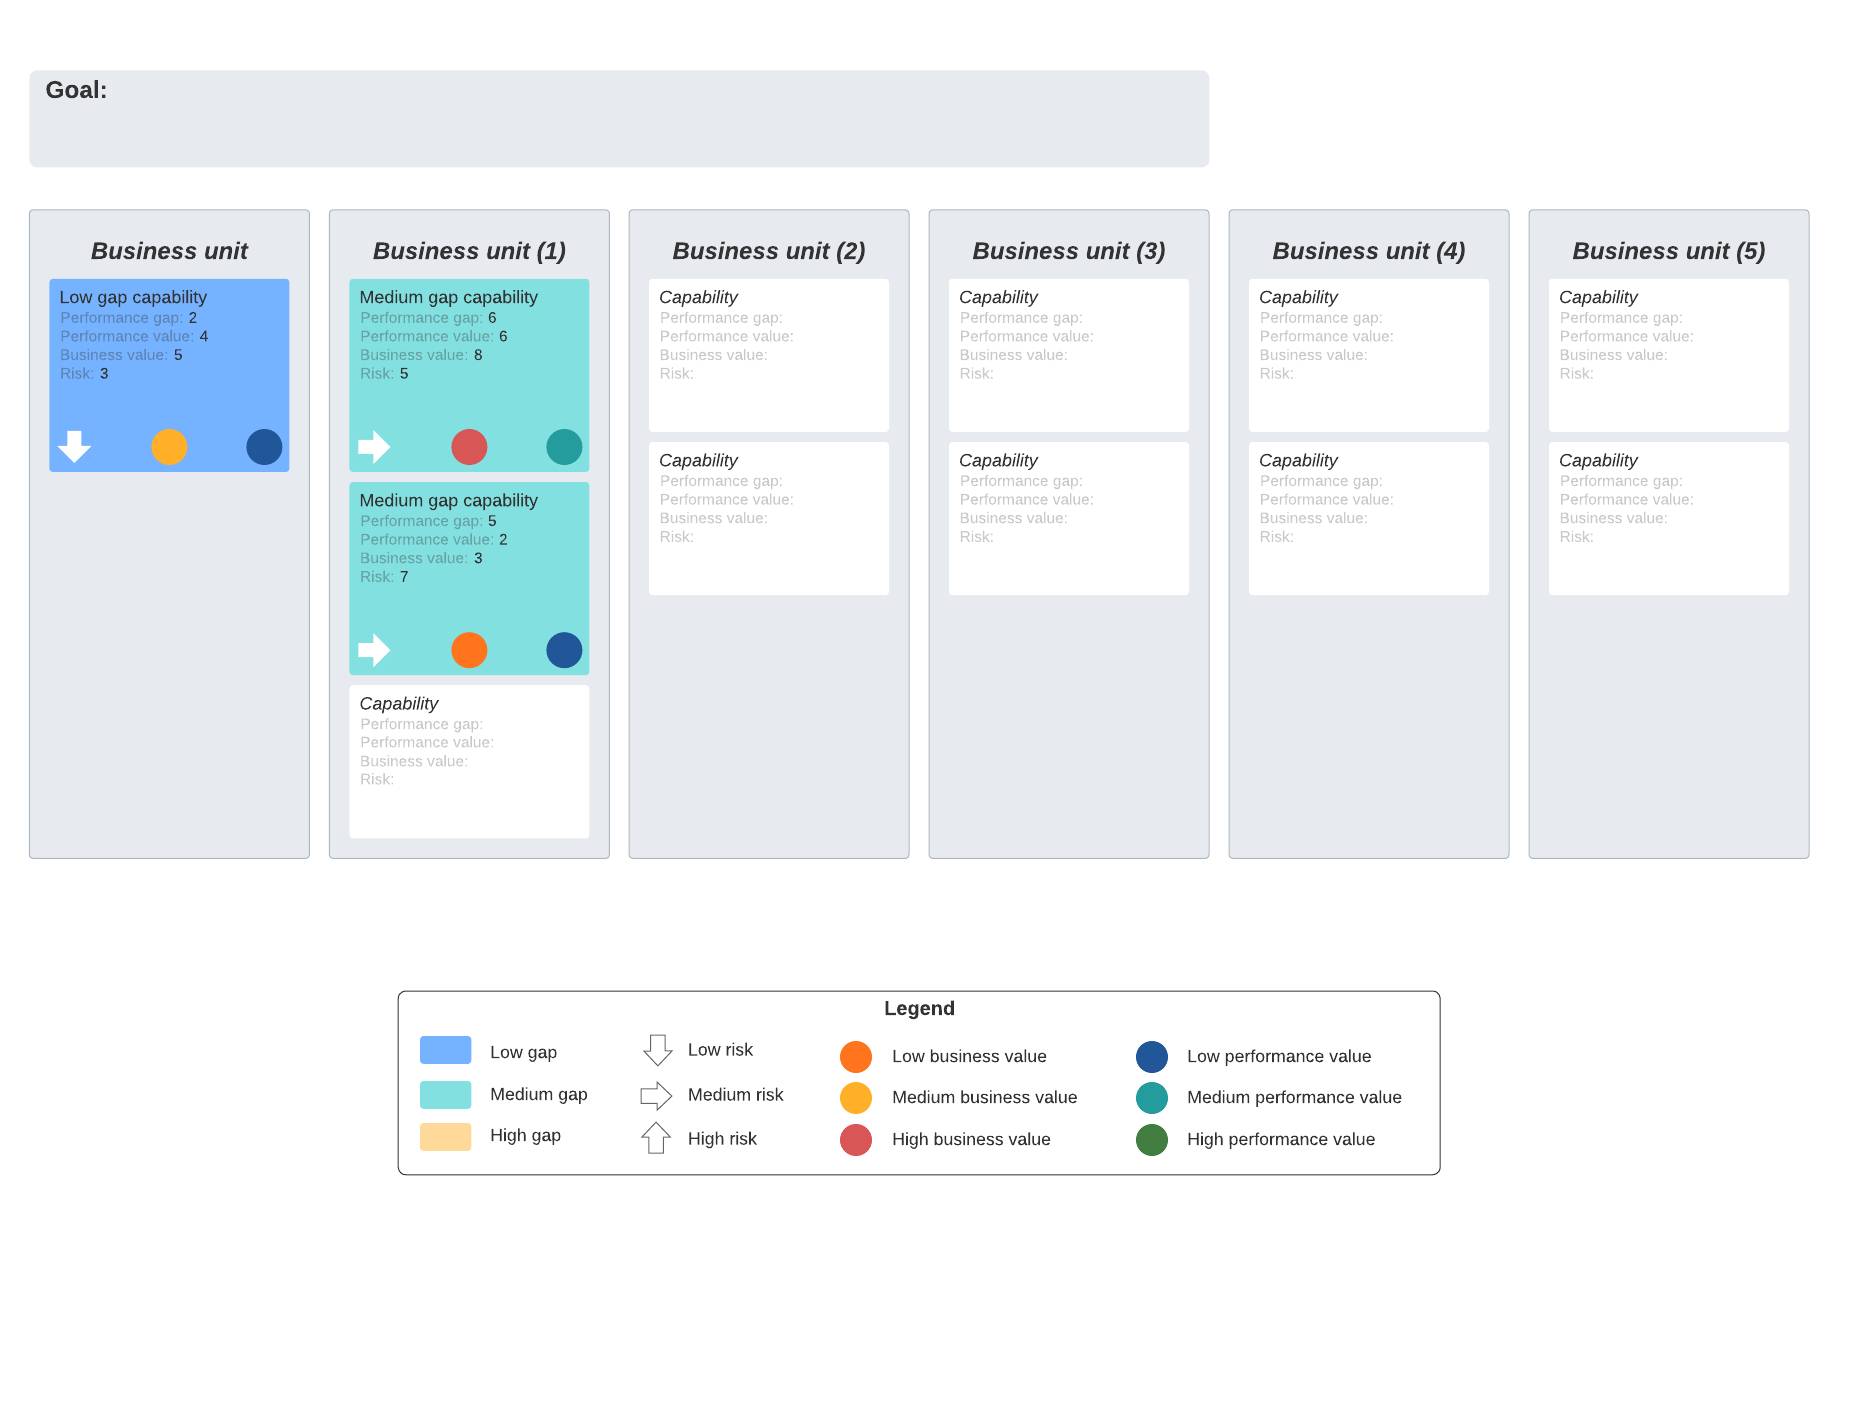
You’ll need to work with various teams and managers to define all of your company’s capabilities. Lucidchart makes it easy to share documents so all contributors can collaborate simultaneously.

Step 4: Map business applications

Mapping business applications is important because it gives you an overview of what you already have to help people throughout your organization manage specific business functions. For example, sales and marketing might have CRM tools and finance might have a set of accounting and payroll business applications. Mapping this out will give you a better idea of what you need going forward.

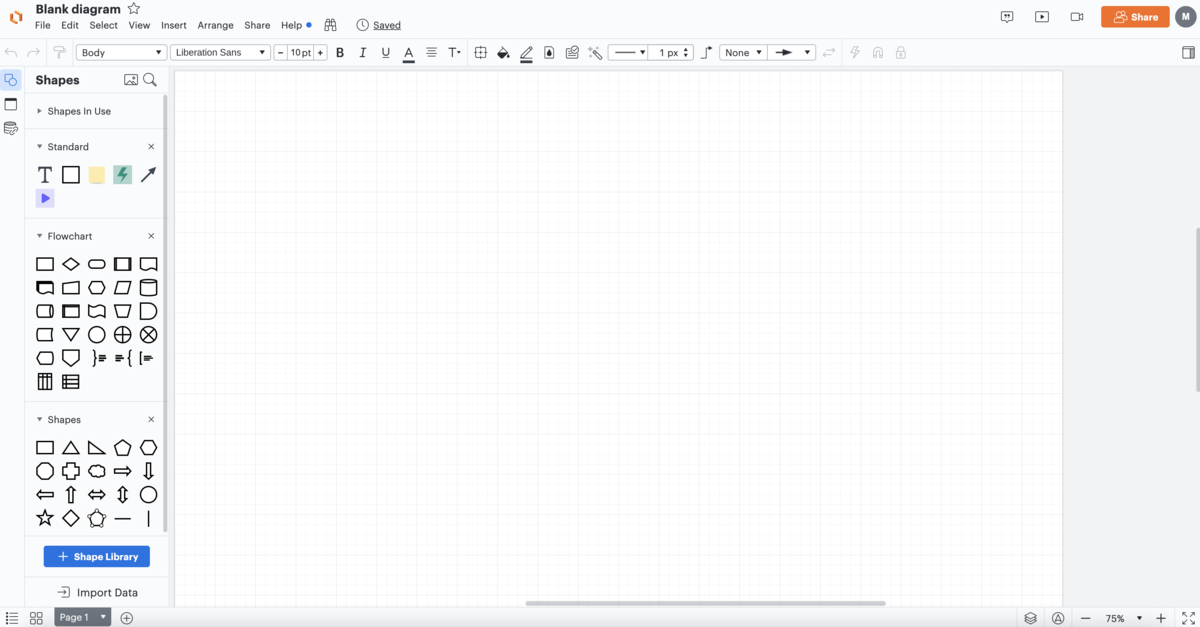
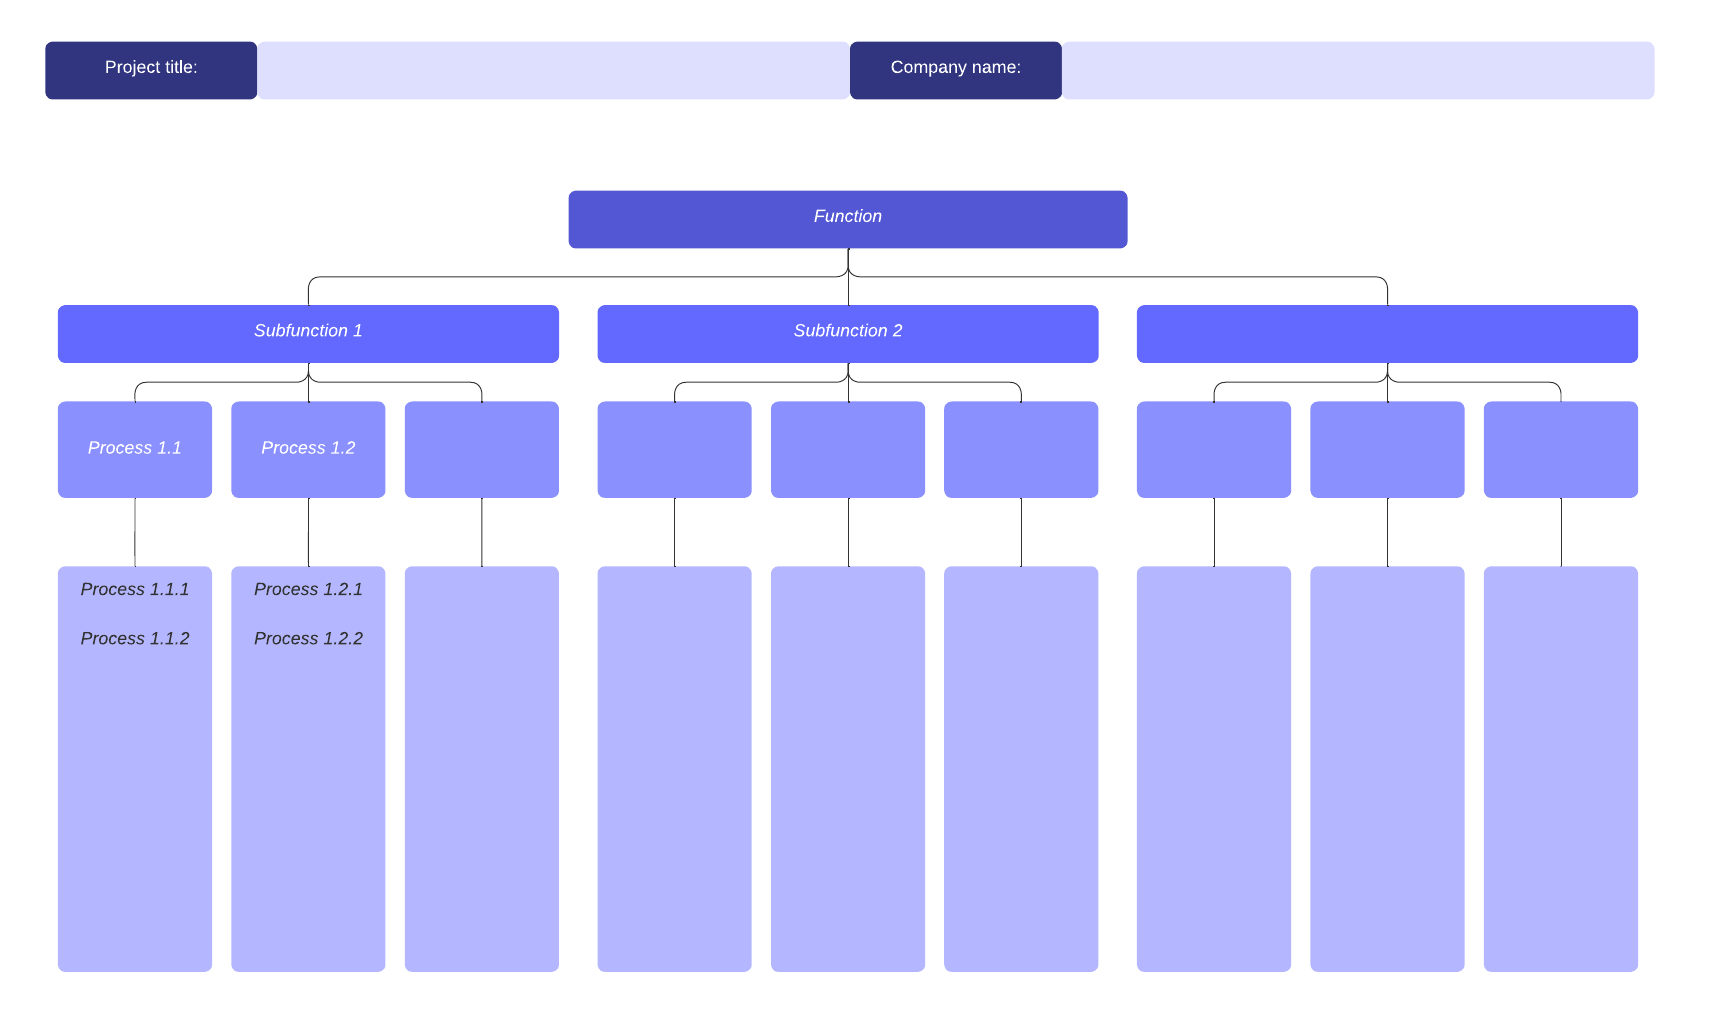
To do this in your Lucidchart document, you can add a new blank page or insert a generic template into your current document to describe your business applications. Or, you can identify applications by department by adding them to the business functions map or the business capability map you’ve already created.

Step 5: Map your tech stack

Mapping your tech stack is similar to mapping your business applications. The difference is that a tech stack is a list of not just software, but also frameworks, platforms, programming languages, architectures, and so on. The list represents all the technologies that a team needs to develop all the parts they are responsible for in the overall project. For example, the finance team might have a technology stack that includes a payroll app, employee time tracking software, accounting tools, project management software, and so on.

Like the business applications map, you can map a tech stack on a blank page or a find a template that fits your formatting preferences. Or, you can identify specific tech stacks that are used in each department by documenting them on the maps you’ve already created.

Step 6: Map your cloud architecture

A cloud architecture diagram describes how different technologies integrate with each other to share scalable resources across a network. It is a critical piece of documentation that gives you a visual overview of your cloud environment. This helps you understand all of the components, capabilities, and relationships that need to work together to run your applications in the cloud. And it helps you to validate that your designs have been implemented correctly. 

Cloud architectures can be complex, and so can manually creating and maintaining a cloud architecture map. Fortunately, you can use Lucidscale—a cloud visualization solution that works with your AWS, Azure, and GCP architectures—to automatically map your cloud environment. 

How to create and maintain cloud architecture documentation using Lucidscale

  1. Import your cloud architecture to the Data Hub.

Select Import Data from the left panel and pull in the metadata from your cloud provider (AWS, Azure, or GCP). 

  1. Create a new model in Lucidscale from the imported data.

From the Model Options menu, select New > Lucidscale. Then select your cloud provider to create a model from your imported data. 

  1. Manage your views.

Use existing views or create your own custom view so you can focus on specific parts of the architecture. Options include:

  • Using multiple views and filters to focus on specific resource groups.
  • Toggling lines on and off to verify specific resources are connected correctly.
  • Adding conditional formatting rules to help organize and sort information.

After you have created the model, you’ll have a visual representation of your cloud’s current state.

 4. Use the Data Hub to keep the model up to date.

From the left pane, select Data Hub. Select your cloud provider and log in with your credentials. This updates the model and keeps the information current.

Why Lucidchart? 

Lucidchart is part of the Lucid Visual Collaboration Suite, so it becomes even more powerful when used with Lucidscale and Lucidspark. You can map your current state in Lucidchart, ideate on improvements in Lucidspark, and auto-generate your cloud architecture in Lucidscale. The Lucid Visual Collaboration Suite is cloud-based, so you can easily collaborate in real time with your team. 

Whether you use just Lucidchart, or all three solutions, the Lucid Visual Collaboration Suite can be used as a single source of truth for your current state. 

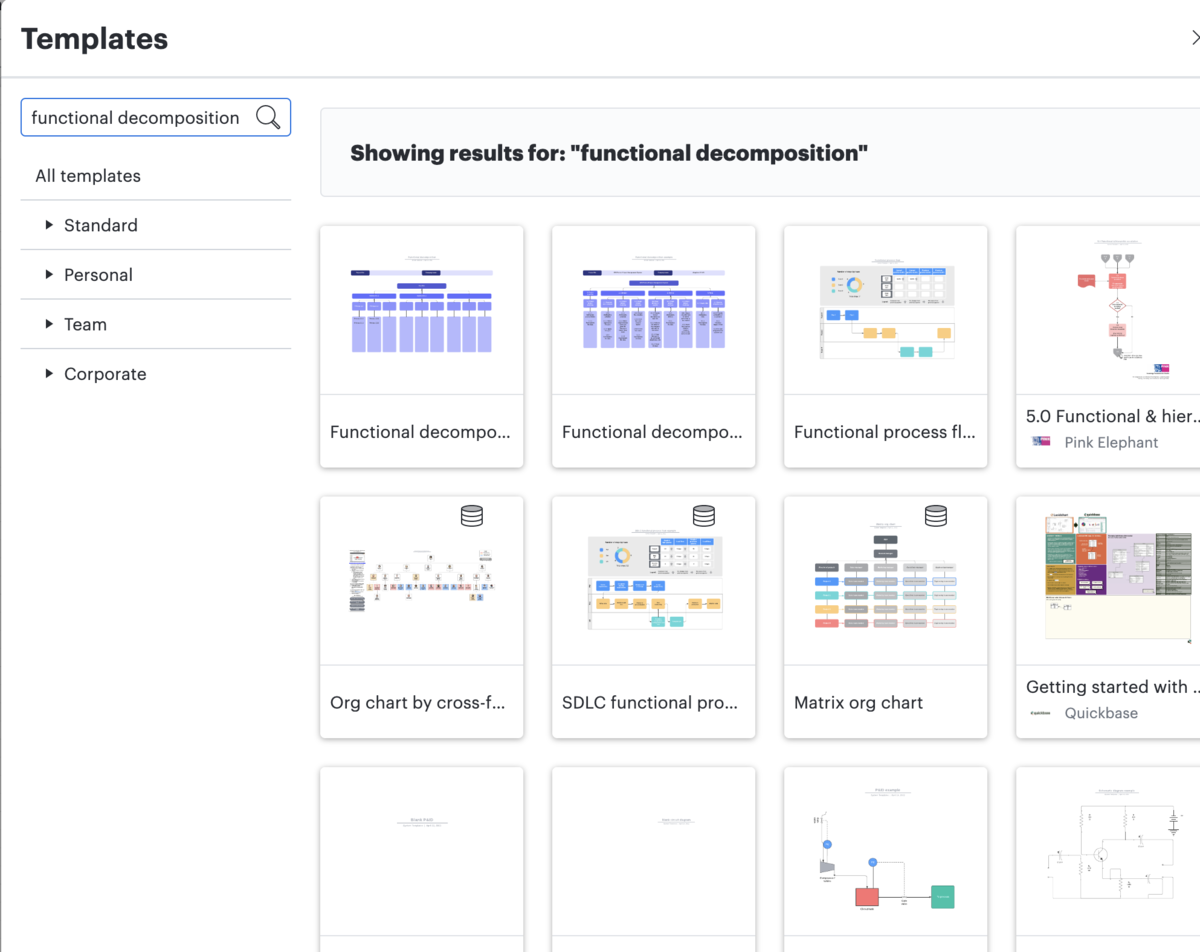
Additionally, Lucidchart features a robust Shape Library and offers more than 1,000 templates, so you can customize your current state maps to fit your team or organization’s needs.

current state mapping Lucidchart

Get started mapping your current state with Lucidchart.

Go now

Lucidchart

Lucidchart, a cloud-based intelligent diagramming application, is a core component of Lucid Software's Visual Collaboration Suite. This intuitive, cloud-based solution empowers teams to collaborate in real-time to build flowcharts, mockups, UML diagrams, customer journey maps, and more. Lucidchart propels teams forward to build the future faster. Lucid is proud to serve top businesses around the world, including customers such as Google, GE, and NBC Universal, and 99% of the Fortune 500. Lucid partners with industry leaders, including Google, Atlassian, and Microsoft. Since its founding, Lucid has received numerous awards for its products, business, and workplace culture. For more information, visit lucidchart.com.

Related articles

Bring your bright ideas to life.

Sign up free

or continue with

Sign in with GoogleSign inSign in with MicrosoftSign inSign in with SlackSign in

Get started

  • Pricing
  • Individual
  • Team
  • Enterprise
  • Contact sales
PrivacyLegal

© 2024 Lucid Software Inc.