
How sales engineers can save time in Lucidchart
Dave Bennett
Reading time: about 6 min
Topics:
Honest question: What do you do as a sales engineer or a solutions engineer (SE)?
Having worked as an SE at multiple companies, this is a question that I have heard many times over, and it’s a question that I respond to differently at each company I’ve been at.
Sales reps might assume that your time is spent creating custom demos for customers, but as you know, that really just scratches the surface of what you and your team members do. While you might focus on creating custom demos and helping your sales reps close deals, you might also architect custom environments for your customers, run your customer’s proof of concept, take the lead on technical questions in an RFP, or work on custom integrations for your customers.
In short, SEs work on a variety of tasks and don’t always have the same job description. Whatever your position might entail, I’d like to cover how Lucidchart can help you, as an SE, save time.
Understanding accounts
For me, one of the most difficult tasks as an SE is getting up to speed on the account that I am working on. SEs are typically only involved once an opportunity has been vetted out, so you have to play catch up once you get assigned to an opportunity. You need to understand who you will be speaking with and what their use case is so that you can create those beautiful custom demos.
There are a number of ways that you can get up to speed—and each of these methods will provide different results based on the AE that you will be working with. Some AEs will provide you information without you even asking for it, and others won’t give you any real information even if you do ask for it. With such a wide range of information quality, it can be hard to know if you are prepared for a demo or not.
My current solution to this problem? Account maps.
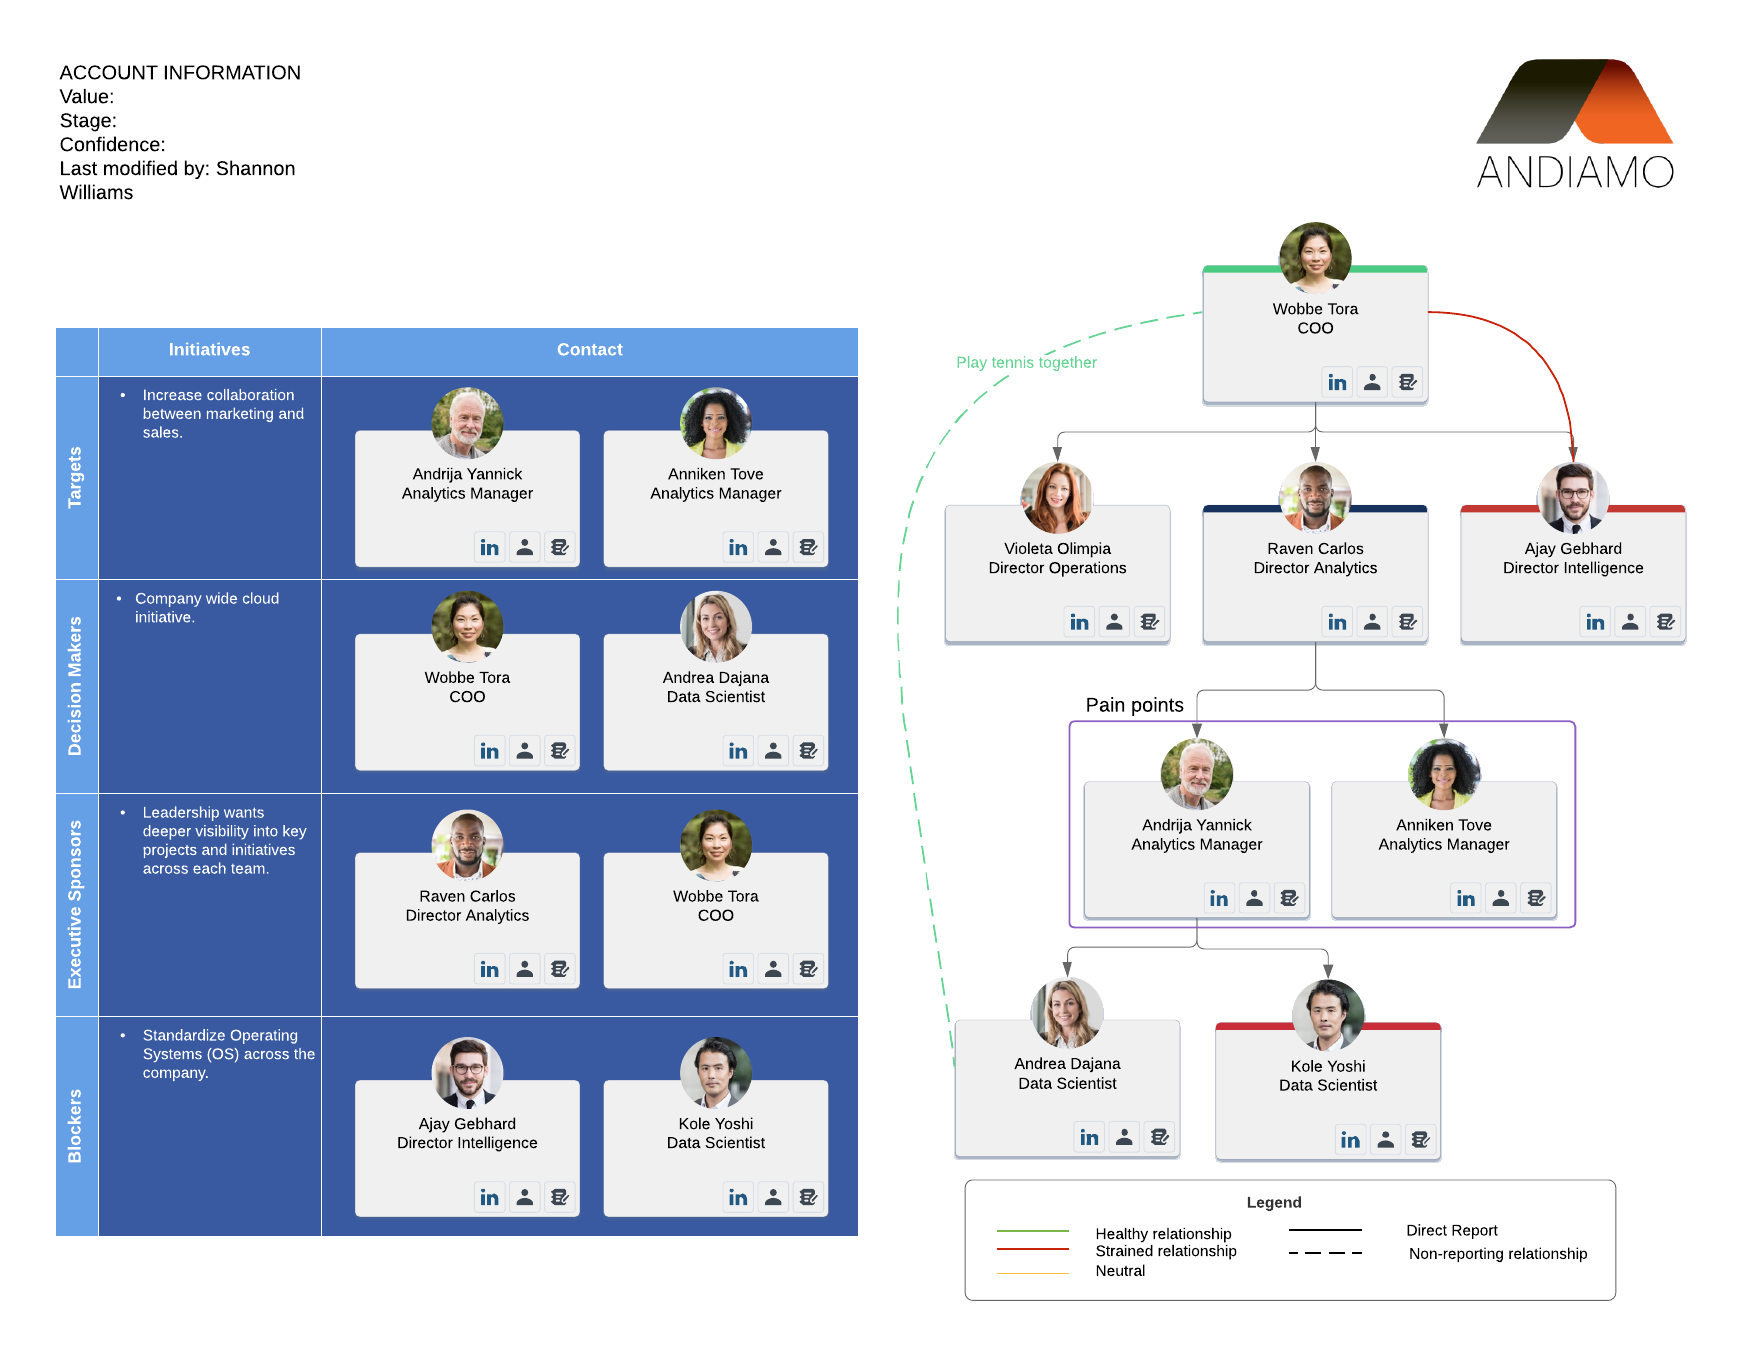
Account maps help sales reps visualize key stakeholders and the relationships between them—all with the intent to identify gaps in the buying team and determine the best path to sale. But a great side effect of account maps is that these documents can be viewed by other team members, whether those team members are managers, SEs, or other AEs.
It’s very easy to get a good understanding of where the account stands, who you will be working with, and what notes your AE has recorded (e.g., discovery call notes highlighting what they’d like to see in a demo), either in Lucidchart or in Salesforce.

This information helps me and other SEs understand who already likes the product/who our champions are, who I really need to wow, and who the blockers are, plus the roles of the individuals that I’ll be speaking with and demoing to. By very quickly and easily getting up to speed, you can save time and really focus on what’s important, creating demos and helping your AE close deals.
Lucidchart makes it easy for AEs to create account maps and for you to gain access to them. Sales reps can import their Salesforce contacts to build account maps that are tied to the Salesforce account or opportunity. So if you have access to the account, you’ll be able to quickly learn more about key stakeholders.
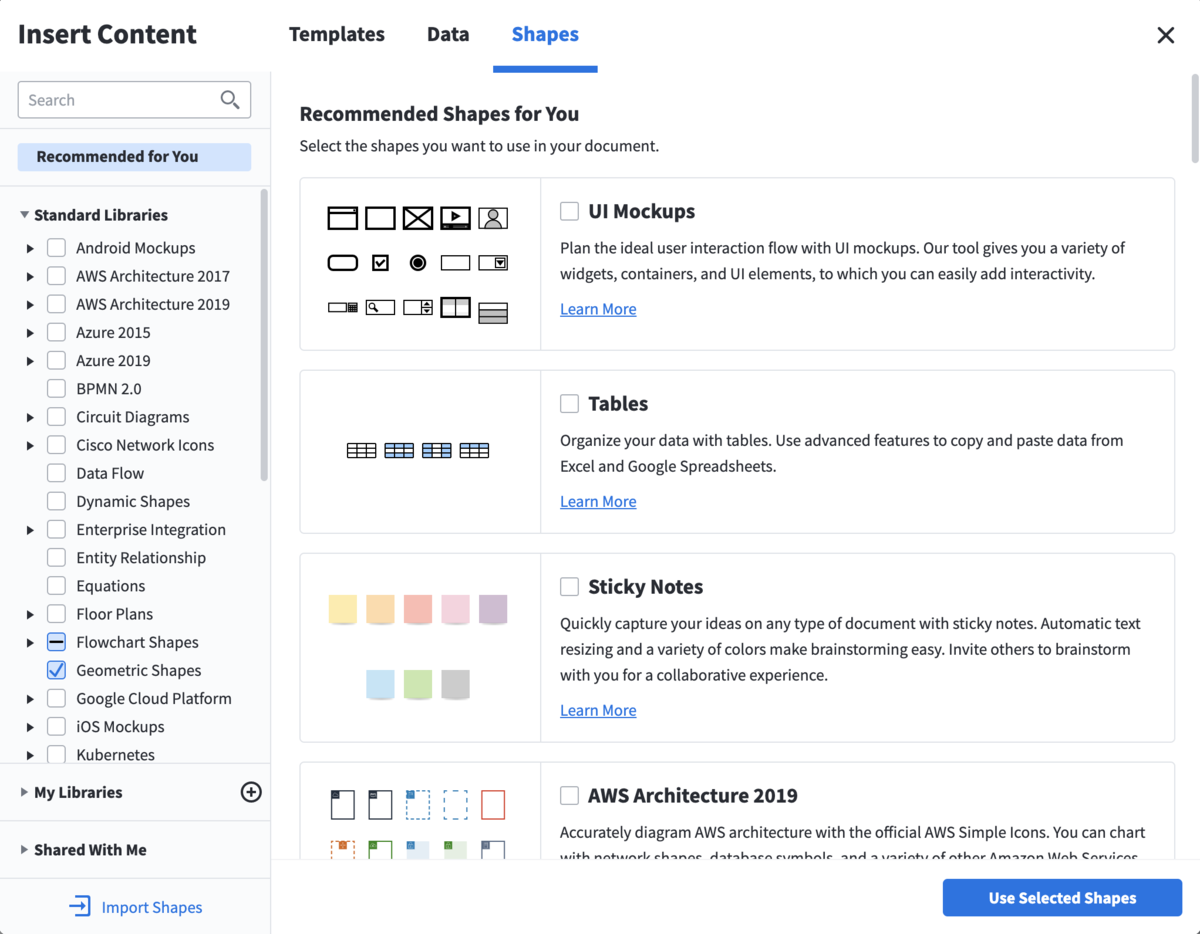
For instance, you might use the same shapes over and over again, either shapes you have created or shapes found in a number of different shape libraries. By creating your own custom shape library, these shapes can all be stored in one central location, and you can speed up the process of document creation within Lucidchart.
Speeding up document creation
Now that you’ve been able to get up to speed on the account that you’ll be helping with, what’s your next step as an SE?
Do you often find yourself building out architecture documentation or entity-relationship diagrams? Maybe you help build out UML diagrams for your customers or AWS infrastructure diagrams?

Lucidchart can help automate the creation of many of these documents and help you save significant time and energy as you are working through the sales cycle. Whether you are building out diagrams for your pitch decks or whether you are building out diagrams for custom architectures, any type of automation will help you to relieve some of the stress put on you during the sales cycle.
While automation can help you to get a jump start on the document creation, Lucidchart offers other tools to help you build out the different documents that you need throughout the sales cycle.
For instance, you might use the same shapes over and over again, either shapes you have created or shapes found in a number of different shape libraries. By creating your own custom shape library, these shapes can all be stored in one central location, and you can speed up the process of document creation within Lucidchart.
Creating interactive and understandable diagrams
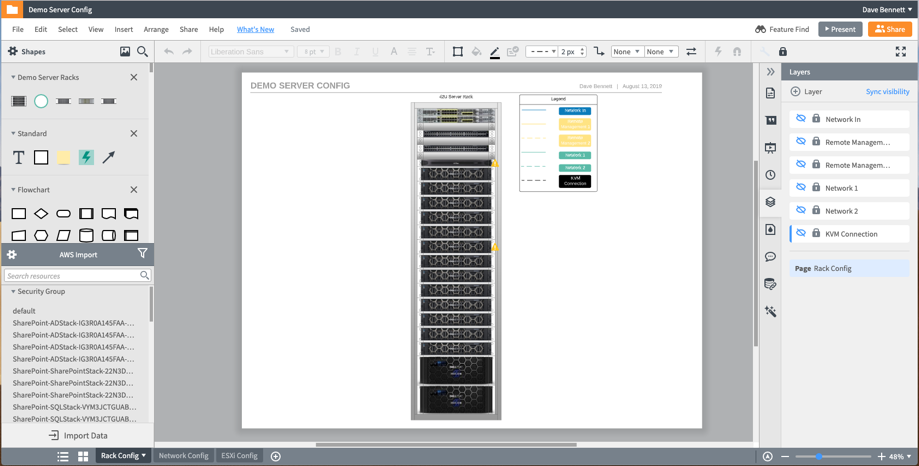
How about ways to organize complicated diagrams or a nice way to show future state of a network? Lucidchart has your back here as well.
Using Layers, you can make complicated documents easy to view and understand. For example, you might want to show the current state vs. the future state of your customer’s AWS infrastructure. Or maybe you want to show different network connection levels in your network diagrams and hide information depending on who you are showing the diagram to.
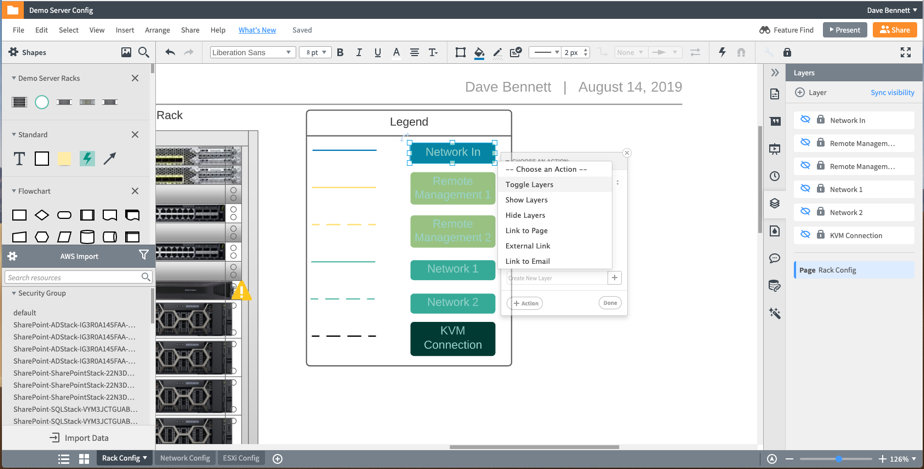
And if you use Hotspots/Actions in conjunction with Layers, your documents can become interactive. Think about how much better those wireframes you make could be.
Now Hotspots and Actions can be used for quite a bit more than just toggling Layers on and off. They can also be used for linking your documents to different webpages, to other documents that you’ve created, or to email addresses. Using Hotspots and Actions can really help your documents come alive and help you show your customers what they need to see without your documents becoming a jumbled mess.
Collaborating internally and externally
This final set of features—and what truly makes Lucidchart a tool designed for SEs—are our features around sharing and collaboration. Easily share documents within your organization—you can share the documentation you’ve built with sales reps, and they can share account maps with you.
You can also publish documents to share outside of Lucidchart. You know all the network diagrams you’ve been printing out and giving to customers? Simply publish them, and your customers will have access to them, even if they don’t have a Lucidchart account. (You can even password-protect your published links to be sure that only certain people can access your documents.)
When you publish Lucidchart documents, those diagrams maintain the full functionality of Layers and Hotspots. Your customers can still interact with these documents and see the documents how you intended them to be seen. Leave a lasting impression and show your customers how much work you put in specifically for them.
Lucidchart has saved me time and made it easier to excel in my day-to-day tasks—and my hope is that it can make your life easier, too, by helping you get up to speed on accounts faster and create documents that are truly special for each one of your customers. Try some of these features today.

Don't have a Lucidchart account yet? Start an account to win back hours of your time.
Sign up nowAbout the author

Dave Bennett works with advanced technical demos, professional services, and security as a Sr. Solutions Engineer at Lucid. He has a background in software engineering and graduated from BYU in computer science. When he isn’t working, he can be found playing in the mountains with his family.
About Lucidchart
Lucidchart, a cloud-based intelligent diagramming application, is a core component of Lucid Software's Visual Collaboration Suite. This intuitive, cloud-based solution empowers teams to collaborate in real-time to build flowcharts, mockups, UML diagrams, customer journey maps, and more. Lucidchart propels teams forward to build the future faster. Lucid is proud to serve top businesses around the world, including customers such as Google, GE, and NBC Universal, and 99% of the Fortune 500. Lucid partners with industry leaders, including Google, Atlassian, and Microsoft. Since its founding, Lucid has received numerous awards for its products, business, and workplace culture. For more information, visit lucidchart.com.
Bring your bright ideas to life.


By registering, you agree to our Terms of Service and you acknowledge that you have read and understand our Privacy Policy.