How to estimate story points for improved Agile planning
Lucid Content
Reading time: about 7 min
Story Points symbolize the work needed to implement a live product backlog item. Each individual story point represents a time frame. The specific time frame lengths are unknown during the estimation. For instance, one story point item could be a range of 4-6 hours, 2 story points 5-10 hours, etc. The goal is to have a rough estimate of how much time each product backlog item will take to be finished.
If you’ve ever experienced traffic in Los Angeles, you know that the amount of time it should take you to get from Arcadia to Santa Monica is subject to a number of forces including traffic, weather, construction, time of day, and the whims of other drivers. It’s a 32-mile distance that could take 41 minutes or 4 hours.
The items in your Scrum product backlog are subject to a similar number of variables, often making Agile planning as frustrating as sitting in Southern California traffic.
And that’s a massive problem. If you fail to accurately and consistently estimate the time or velocity during Agile planning, it can lead to missed deadlines, bottlenecks, roadblocks, scope creep, and sometimes even the failure of a project.
The good news is that there’s a better way to estimate the time it takes for Agile planning: story point estimation.
Downsides of other time estimation methods in Agile projects
Before we get into the value of story point estimation, let’s consider other estimation techniques used in Agile planning.
Many teams assign an estimate to projects and items by the hour, and then they assign a total number of hours per sprint. But, if we return to the driving analogy, this practice is similar to only looking at distance when driving and not accounting for other factors.
Another way to estimate is the “ideal day” technique. Each workday consists of emails, chats, and meetings, which means that your developers aren’t going to be available to work for 8 hours every day, even though they’re still at work. The downside to this estimation method is that it still relies on hours, not effort.
What are story points?
So how does story point estimation give your team a more accurate estimate of the time user stories will take to complete?
With story points, teams take into account the effort and complexity to assign each item in a product backlog with a numerical value. Story points are much more comprehensive than looking at only one factor—time—to estimate sprint planning.
Story point estimation includes three main components:
- Risk: The risk of a particular project or item includes vague demands, dependence on a third party, or changes mid-task.
- Complexity: This component is determined by how difficult the feature is to develop.
- Repetition: This component is determined by how familiar the team member is with the feature and how monotonous certain tasks are within development.
By incorporating the three points above, your team can more accurately plan sprints, include cushion for uncertainty, better estimate issues, and avoid leaning too heavily on time commitments. Story points allow for consistency not just in teams, but across departments.
3 steps to Agile story point estimation
Follow this process to more accurately plan out your sprints, give realistic expectations, and push projects through faster.
1. Use Fibonacci sequence numbers
It’s tempting to assign items with a linear scale, but those integers aren’t differentiated enough to clearly define an estimate.
You’ve likely encountered this at the doctor’s office with a pain scale. If 1 on the pain scale represents “totally fine” and 10 is a pain so severe it feels like you may be dying, what is 4? And, furthermore, how is 4 different from 5? And where does a kidney stone fit in on the scale if you’ve never experienced severe pain before?
Fibonacci sequence numbers eliminate those minor jumps. As you might remember, the Fibonacci sequence is a series of numbers where each number is the sum of the two previous numbers: 0, 1, 1, 2, 3, 5, 8, 13, 21, etc.
For Agile, the sequence is typically modified to 0.5, 1, 2, 3, 5, 8, 13, etc. Using these numbers, it’s much easier to decide if an item is 3 story points or 5 story points.
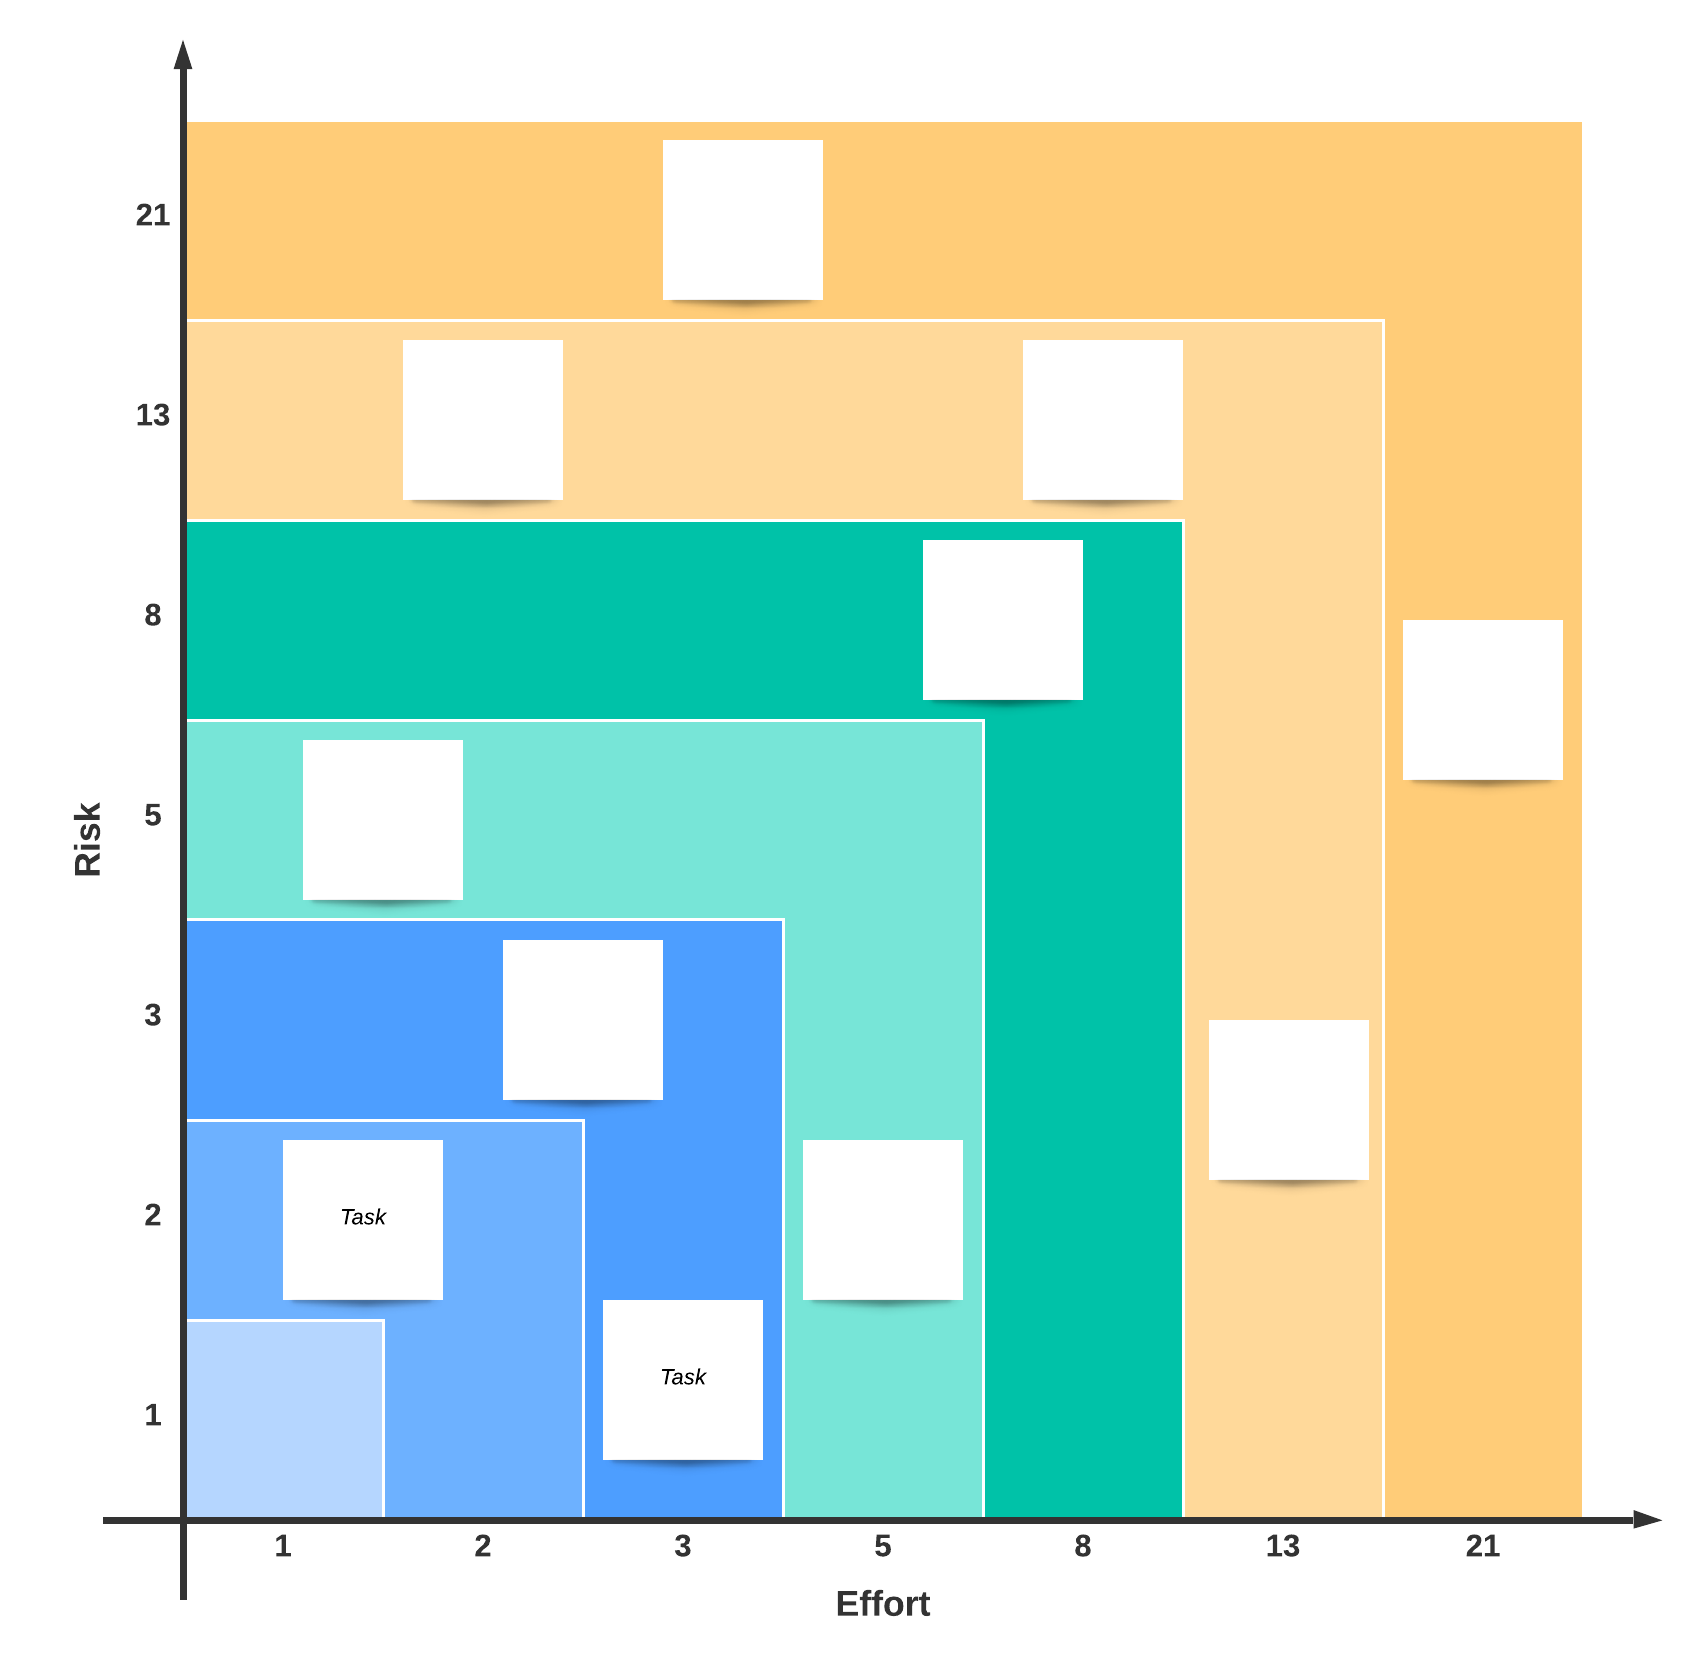
2. Determine a matrix
After you’ve decided to use the Fibonacci sequence, it’s time to determine a baseline for each story point. For instance:
1 = Add a new product to a dropdown menu
2 = Add order tracking for logged-in users
3 = Add a ratings system to the website
5 = Add a forum to the site
8 = Add GDPR and CCPA compliance across the site
Your baseline is included in this matrix as 1, which sets the standard for what the least amount of risk, complexity, and repetition looks like in practice. This matrix is a way to more concretely measure effort; keep this in mind instead of defaulting to judging items based only on length of time.
3. Hold a round of planning poker
Planning poker helps a team gain a consensus of correct story point approximation for each item. Here’s how it works:
- In a sprint planning meeting, each developer and tester receives a set of cards, each one depicting a number of a Fibonacci sequence.
- A backlog item is brought to the table so that the team may ask questions and clarify features.
- When the discussion is closed, each developer and tester privately selects the card that most accurately reflects their estimate.
- When all cards have been selected, the estimators reveal their cards at the same time. If a consensus is met, it’s time to move on to the next backlog item. If the estimates vary, the leaders discuss until they arrived at a consensus.
It’s useful to have a completed matrix on hand for the estimators to reference during planning poker, as it allows for greater consistency across tasks. Also, it’s useful to set a maximum limit (13, for instance). If a task is estimated to be greater than that limit, it should be split into smaller items. Similarly, if a task is smaller than 1, it should be incorporated into another task.
At this point, within your sprint planning meeting, items in the product backlog can be prioritized and divided out amongst the team based on the team’s workload capacity.
How to estimate sprint velocity
You may at this point be wondering how many story points a team can complete during a sprint. That amount is called sprint velocity, and unfortunately, there’s no way to determine that until the first sprint has been completed.
During the first sprint after your first story point planning meeting, keep track of how many story points were completed. That total number can then be used to determine a reasonable number of story points your team can complete during a sprint. Then, you’ll be able to estimate how many sprint cycles will need to be completed for a project.
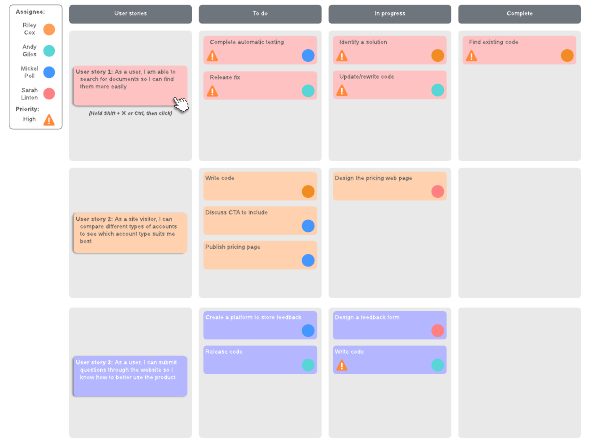
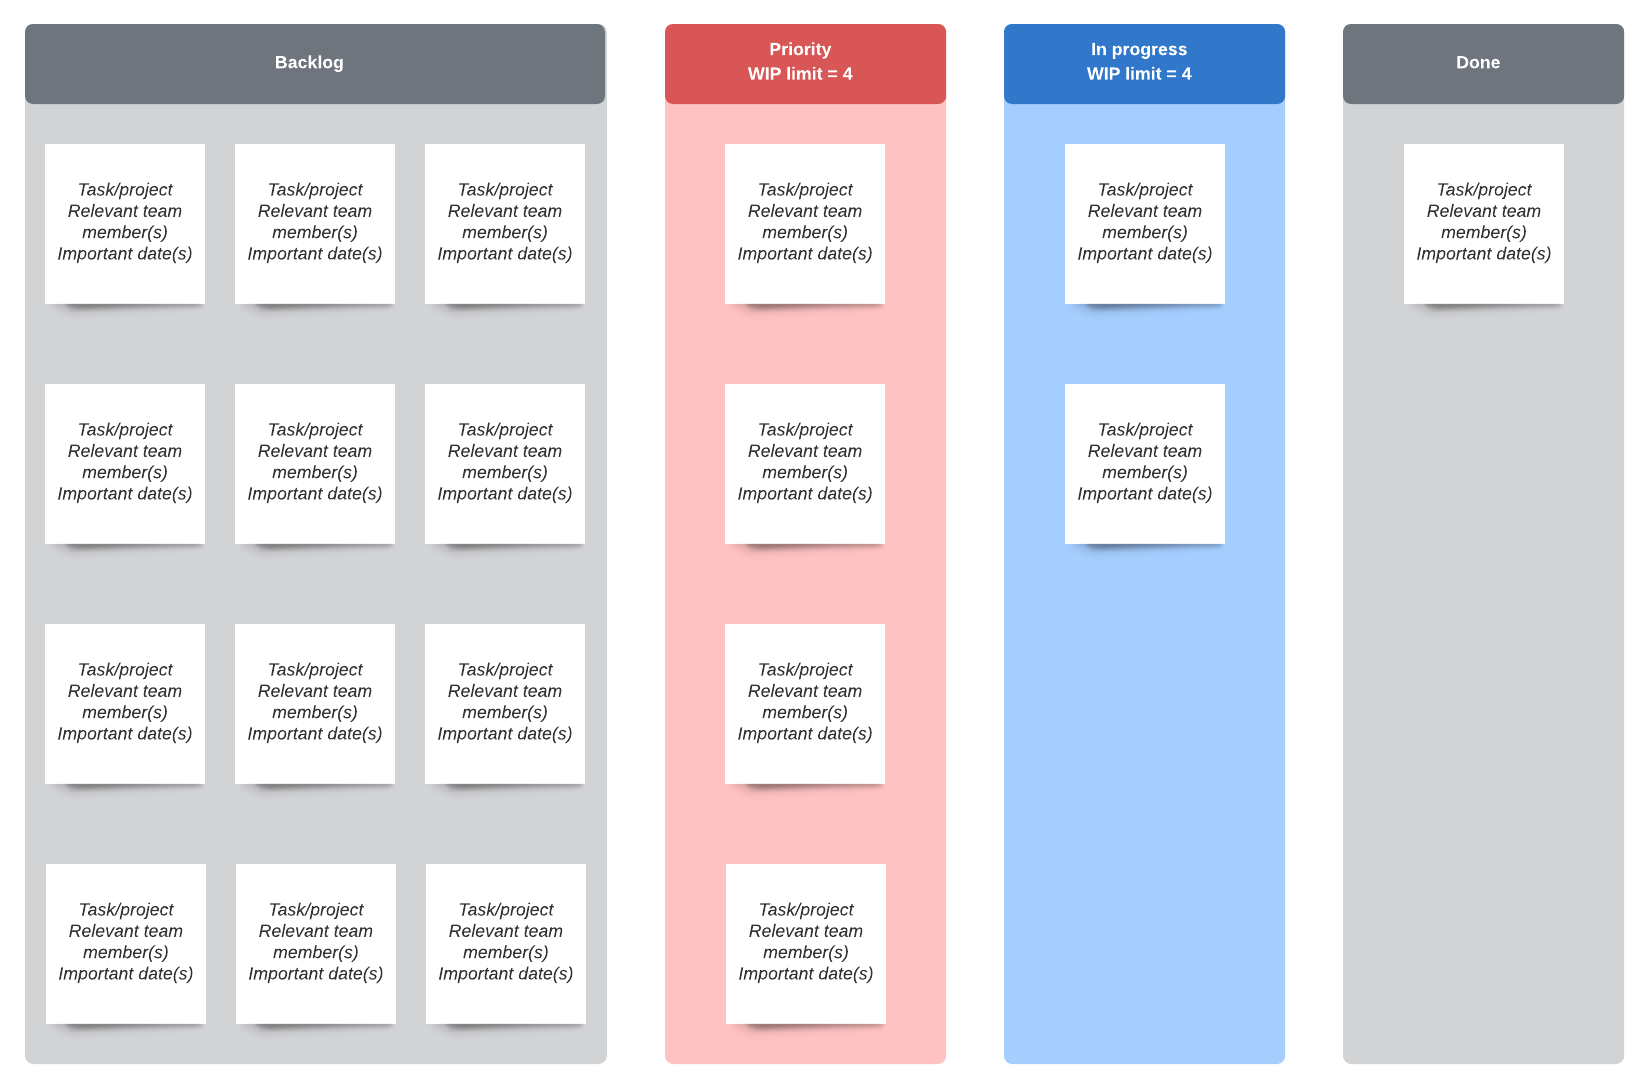
If you’re using a Scrum or Kanban board, simply look at the “Done” column at the end of your sprint and total up the number of story points. Over time, you can average several weeks worth of data to estimate a more accurate sprint velocity.
Continue to improve based on past sprint estimates
The first sprint after adapting the story point technique is not going to go perfectly. And that’s completely normal. Set that expectation with your team in the beginning so that frustration doesn’t hijack the process.
At the next sprint planning meeting, ask your team what went right, what went wrong, and what can be done to improve. You may need to adjust your initial matrix to better estimate items moving forward. And that matrix may be adjusted until your team is more comfortable with estimating each task’s effort.
Since Agile development is a team effort, it’s important to lean heavily on the team’s feedback to determine improvement. While story points may not feel as intuitive as simply assigning hour estimates to each task, you’ll find that, by estimating effort instead of time, you’ll have a calmer sprint, a more organized and prepared team, and a less stressed overall experience for every sprint. Further, you’ll be able to discuss expectations with stakeholders and set more reasonable delivery dates moving forward, which improves efficiency and ultimately improves the product.

Now that you have estimated all of your story points, the next step is to create your Agile release plan.
Learn moreAbout Lucidchart
Lucidchart, a cloud-based intelligent diagramming application, is a core component of Lucid Software's Visual Collaboration Suite. This intuitive, cloud-based solution empowers teams to collaborate in real-time to build flowcharts, mockups, UML diagrams, customer journey maps, and more. Lucidchart propels teams forward to build the future faster. Lucid is proud to serve top businesses around the world, including customers such as Google, GE, and NBC Universal, and 99% of the Fortune 500. Lucid partners with industry leaders, including Google, Atlassian, and Microsoft. Since its founding, Lucid has received numerous awards for its products, business, and workplace culture. For more information, visit lucidchart.com.
Bring your bright ideas to life.


By registering, you agree to our Terms of Service and you acknowledge that you have read and understand our Privacy Policy.